There is an ongoing battle over Valeant’s (VRX) valuation and business model between short-sellers and investors. This opportunity allows us to improve our analysis skills and understanding of business models. Also, how will Sequoia, an owner of over 20% of Valeant’s equity, handle their portfolio?
My first question is whether Valeant is a franchise with durable competitive advantages or a roll-up of commodity products dressed-up in a fancy industry (Pharma)? We should use this case to learn how experienced analysts present their opposing views.
First: What’s not to like? Valeant has rapid growth with huge profit margins? Of course, the PERFECT investment is a company that has high returns on capital and can constantly redeploy its capital at the same high returns. The classic case would be the early (pre-2000) history of Wal-Mart (WMT) as the high returns generated from its stores could be redeployed into new stores on the borders of their regions which had economies of scale in administration, advertising, and management costs per unit of sales. WMT did not have, for example, advantages in gross margins, but net profit margins. See WMT_50 Year SRC Chart.
What would be the source of Valeant’s high returns and competitive advantages?
Sequoia (a well-known value fund with an excellent long-term record) saw strong competitive advantages. See their recent investor transcript:
Sequoia-Fund-Transcript-2015-August Note the date of the transcript and the questions regarding Valeant concerning Philador and Sequoia’s 20% concentration.
Other investors (Charlie Munger, Citron) disagreed:
April 2, 2015 from www.fool.com
…..Recently, during a shareholders meeting for the Daily Journal Corporation, a newspaper where he serves as Chairman, Munger had this to say about Valeant Pharmaceuticals Intl Inc.(TSX:VRX)(NYSE:VRX): “Valeant is like ITT and Harold Geneen come back to life, only the guy is worse this time.”
What exactly does Munger mean by this?
A little history lesson
Who exactly was Harold Geneen? And what did he do at ITT that’s so infamous?
Geneen took over ITT Corp in 1959 when it was still mostly a telegraph and telephone company. After being blocked by the FCC in an attempt to buy the ABC television network in 1963, Geneen decided to diversify away from the company’s traditional business and completed more than 300 acquisitions during the decade in areas such as hotels, insurance, for-profit education, and the company that made Wonder Bread.
Geneen used cheap debt to finance these acquisitions, which later proved to be the company’s downfall. After Geneen’s retirement as CEO in 1977, subsequent CEOs spent much of the next two decades paying off the debt by selling most of Geneen’s acquisitions.
Is Valeant really comparable?
On the surface, Valeant looks like it could be pretty comparable to ITT. Since merging with Biovail in 2010, Valeant has made more than 30 different acquisitions, most of which were paid for with debt or by issuing shares.
Since the end of 2010, Valeant’s debt has skyrocketed from US$3.6 billion to US$15.3 billion. Shares outstanding have also gone up considerably from 196 million to 335 million. It’s obvious that Munger is onto something.
But on the other hand, I’m not sure Valeant is anywhere close to being as bad as ITT was. For one thing, all of the company’s acquisitions are at least in the same sector. ITT was buying up hotels and car dealerships, while Valeant is buying up pharmaceutical companies. Valeant’s efforts scale up a whole lot better than ITT’s ever did.
There’s also a bit of hypocrisy coming from Munger on this issue. Munger is actively involved in a company that does pretty much the same thing as ITT did back in the 1960s. Sure, Berkshire doesn’t use much debt or engage in hostile takeovers, but Berkshire and ITT have more in common than Munger is willing to admit. Both attempted to dominate the business world using a roll-up acquisition strategy; Buffett and Munger were just a little more patient with their plan.
But just because Munger exaggerates how bad Valeant’s acquisition spree has been doesn’t mean the stock is necessarily a buy at these levels. The company had earnings of just $2.67 per share in 2014, putting the stock at a P/E ratio of nearly 100 times. Yes, earnings are expected to grow substantially in 2015, but the outlook is simple. For the stock to continue performing, the company must continue to make acquisitions.
After making more than 30 acquisitions in just a few years, it’s hard to keep finding deals that will not only be big enough to make a difference, but will also prove to be good long-term buys. There’s so much pressure on management to keep buying that a serious misstep could be coming. If that happens, this hyped stock could head down in a hurry.
Although I don’t buy Munger’s alarmist concerns about Valeant, I agree with him on one thing. The stock just isn’t attractive at current levels.
Citron, a short-seller, attacks with a report: Valeant-Part-II-final-b. Valeant is another “Enron.” Use the search box on this blog and type in Enron and follow links to review that case. Enron never showed the profit margins that Valeant is currently showing. NEVER take another person’s statement on faith. Check it out for yourself.
Valeant today (October 26th, 2015) counters Citron and answers investors’ concerns with 10-26-15-Investor-presentation-Final4 Valeant and video presentation: http://ir.valeant.com/investor-relations/Presentations/default.aspxeep.
Ok, so what is Valeant worth? Can you make such an assessment? How do you think Mr. Market will weigh-in? If you owned a 20% stake in Valeant, how would you manage the position? What are the main issues to focus on?
This may be too difficult to analyze for many of us but we have or will have many documents and reports to provide insights. Remember that there are two sides to every narrative. Can we move closer to reality or the “truth”?
Note www.whalewisdom.com and type in VRX. What type of investor owns Valeant? Will momentum investors stick and stay?
Your comments welcome.
Sign up for Whitney Tilson’s emails on investing. Worth a look: leilajt2+investing@gmail.com
Today’s equity analysts are better educated (CFAs, MBAs, CPAs) better informed and command more computer muscle than ever. What they lack, critics say, is courage.
Instead of leading clients to investment ideas, many analysts follow the crowed, churning out duplicative research reports that become part of a cacophony of timid group-speak.
“Too many analysts think alike; too few are willing to risk being wrong by taking a gusty, controversial stand,” according to a widely circulated report last month from market strategist Byron Wien at Morgan Stanley & Co.
Wien’s sentiments were echoed in interviews with other market strategists, mutual fund managers, research directors and analysts themselves.
Such complaints are not new, but they come at a time when research departments are slowly rebuilding their ranks following layoffs several years ago. These new analysts will be of little use, however, if they fall in with the herd and fail to produce ground-breaking research.
Critics say both analysts themselves and the incentives that drive the brokerage business are to blame for the group-think.
In a job where performance is measured every trading day by eights of a point, many analysts find security in mimicking their peers. If they are wrong, at least they don’t stand out. Yet, analysts’ opinions are most valuable when they are not only correct but also are in the minority.
If you’re always with the consensus, you probably won’t make much money, but you won’t get fired,” Wien said in an interview with Investor’s business Daily.
Stefan D. Abrams, managing director at Trust Co. of the West, argues that brokerage firms put too much emphasis on the morning call, when analysts announce their latest recommendations to their firm‘s brokers.
The practice may generate lots of trading commissions, but it also leads to a confusing fragmentation of information.
“Analysts are basically not doing the job of helping investors develop conviction in the long-term prospects for companies.” Abrams said.
“They’re too preoccupied with the morning call so they can spout some information that may not be that important. It’s a tidbit of information. Analysts are in the tidbit business.”
The very nature of the brokerage business also stunts the effectiveness of research.
CLIENTS’ INTEREST
An analysts’ purpose, after all, is to come up with winning investment ideas that will prompt their institutional clients to trade stocks through their firm’s brokers and generate commissions. But many of these clients are interested only in larger, more liquid stocks, so analysts tend to concentrate on these types of companies.
Often, “an analysts picks up a stock simply to attract trading calls, “ said Jonathan C. Schooler, a mutual fund manager for AIM Advisors Inc. in Houston.
The result is that dozens of analysts end up covering the same behemoth company. For example American Telephone and Telegraph Co. and NationsBank, the most widely covered U.S. companies , are followed by 59 analysts each. According to Nelson Publications Inc.
The 25 most widely watched U.S. companies have an average 52 analysts each.
By virtue of their size and number of shareholders, these companies deserve wide coverage. But each additional research report adds less value if, as is often the case, it resembles the reports it succeeded.
Moreover, this kind of duplicative effort leaves analysts less time to ferret out tomorrow’s AT&T or Microsoft Corp.
Of course, there are analysts who make a point of discovering companies early in their growth cycles and who are not afraid to cut their own path.
Oppenheimer & Co.’s Cecelia Brancato started following Cisco Systems Inc. in the summer of 1990. It has since increased 2,344%.
OTHER SIDE OF THE STREET
Brancato said she knew about Cisco even before its market debut, and recognized the potential for both the company and the entire computer networking industry. This gave her the conviction to ignore the periodic negative rumours that would temporarily weaken the stock.
“Typically, I am on the other side of the Street, whether it be on my opinion or my earnings estimates,” she said. “More often than not.”
ORIGINAL RESEARCH
Wien and others suggest, however, that analysts would build more credibility by conducting original research and developing maverick opinions that help clients make money.
Meantime, many institutional investors will continue to do their own research, they say, because too much of the information from Wall Street is stale.
“I throw those things out,” Art Bonnel (PM of MIM Stock Appreciation Fund) said, referring to most research reports. By the time it gets to me, everyone knows about it.”
—-
Coal Stocks Under Stress
Coal in a battle of “survival of the fittest,” Citigroup says
May 27 2015, 14:56 ET | By: Carl Surran, SA News Editor
A day after Credit Suisse warned that coal miners such as Arch Coal (NYSE:ACI) and Alpha Natural Resources (NYSE:ANR) were in “dire straits,” Citigroup analysts say it will be “survival of the fittest” for the world’s coal miners.
While Citi believes current coal prices are below sustainable long-run levels, it does not expect a return to prices anywhere near the levels seen a few years ago; the firm cuts its long-run thermal coal price forecast to $80/ton from $90 and its met coal price forecast to $125/ton from $170.
The firm sees China and India as the largest sources of downside risk to its long-run forecasts, particularly for met coal, where China could re-emerge as a net exporter.
The above “research” copy-cats an amazing insight of the obvious as coal company, ACI, declines from $78 to 49 cents:
Ask yourself what was the purpose of stating the obvious after the fact? The analyst should produce original work such as what has the market already discounted today? What about an industry-map showing production costs and sales per ton for each type of coal and where mines are located relative to domestic and export markets? What are the dynamics affecting the market and what can change? How much supply needs to be reduced? Who will and won’t benefit from consolidation? Do the companies have different management than the CEO’s and Boards of Directors who took on debt to make acquisitions at the top of the market in 2011? What drove management’s actions. Can companies work together to merge and rationalize supply and return to profitability.
Reporting the obvious to mimic a competitor seems silly. What do YOU think?
—
A reader suggests a sub-group (off of the Deep-Value group at Google Groups) be formed to learn and study different concepts. I certainly encourage the idea. Let me know how I can help.
—
How Crazy is This?
What Chicago’s Fiscal Emergency says about the Quality of Credit Analysis in the Municipal Bond Market
Because it demands large-scale paradigm destruction and major shifts in the problems and techniques of normal science, the emergence of new theories is generally preceded by a period of pronounced professional insecurity. As one might expect, that insecurity is generated by the persistent failure of the puzzles of normal science to come out as they should. Failure of existing rules is the prelude to a search for new ones.
— Thomas Kuhn, The Structure of Scientific Revolutions
In a sense, Moody’s was only validating the bond market’s opinion of the city’s creditworthiness — the bonds had already been trading at junk levels for several months. This should have been a straightforward event for the chattering class to process intellectually. Rating actions tend to lag the market rather than lead it.
Oddly, however, Moody’s downgrade sparked a debate over whether Moody’s was being “fair” to Chicago. And with Chicago attempting to convert a portion of its variable rate debt to a fixed rate tomorrow, this debate has received considerable amounts of publicity. How could Moody’s cut the city to junk when the other rating agencies rate the city so much higher? (That has obviously never happened before in an era of ratings shopping and superdowngrades.) Wouldn’t having a diverse economy and large tax base cancel out the costs associated with machine politics? (It’s not like this is Chicago’s third fiscal crisis in the past century.)
This was probably the first instance in the history of the capital markets that a rating agency was accused of having too radical an attitude toward risk. How did we get here, folks?
A period of pronounced professional insecurity
Since the financial crisis, municipal bond market participants have been particularly defensive about the level of credit risk in the market as a whole. Commentary on any financially challenged issuer is reliably qualified with “the municipal market defies generalizations,” “these issuers are outliers,” or “remember that, historically, municipal defaults are small relative to corporate bonds.” But the parade of apologies for an issuer with Chicago’s level of financial dysfunction should signal that things have gone too far.
These observations began as a legitimate response to Meredith Whitney’s extremism. Whitney was never going to be correct — the amount of local defaults she predicted exceeded the amount of local government debt outstanding. It was mathematically impossible. It is still mathematically impossible. The financial media that turned her claims into clickbait have moved on to sensationalizing other sectors.
Five years later, however, many municipal market participants remain locked in an unproductive dialogue with an irrelevant personality. Consequently, they are now blind to the fact that what they are saying is no longer true. The market has more financially challenged issuers than can be counted on one hand. These governments are not outliers. They are a class, with similar characteristics and a universe of risks that differentiate them from other borrowers. And they are not small borrowers. It is a more meaningful trend that bondholders are receiving pennies on the dollar in court than it is that defaults remain rare.
There is a conversation to be had about how politics influences the perception of financial commitments and whether bond structures can further evolve to protect bondholders. If the general obligation pledge — absent a statutory lien, which few states have — lacks teeth in court, why isn’t it obsolete? Why is this bond structure still the foundation for credit analysis? Does the general obligation pledge allow governments to over-commit themselves financially in certain political contexts? I would submit to you that this is absolutely the case with Chicago.
None of these issues will be substantively explored so long as market participants remain in “move along, nothing to see here” mode. These are the first fiscal crises where pensions have been a factor at all. In previous fiscal crises, capital markets creditors had the luxury of control. That is no longer a given.
So municipal credit analysis has a lot of growing up to do. Essentially half the market was insured several years ago. As Kuhn noted regarding paradigm shifts in science, there will probably be “a period of pronounced professional insecurity” in the municipal market until new approaches emerge. Until then, there will be a lot of failures.
I will explain my own philosophy regarding financially challenged issuers at the end of this essay.
Rating divergence is actually the status quo — that’s not the story here
Before looking at rating divergence specific to Chicago, it’s helpful to look at the long-term trend of rating divergence between Moody’s Investors Service and Standard and Poor’s. In our opinion, the ratings of the two rating companies have been largely incongruous for several years …
While S&P upgraded 1.01 municipal ratings for each Moody’s upgrade from 2002 through 2007, that ratio ballooned to a whopping 6.66 S&P upgrades for each Moody’s upgrade from 2008 to 2014. And, as noted by the unemployment rate at the time, S&P’s drastic spike in the pace of upgrades occurred at the height of the Great Recession and continued through 2014. This was long after the recession’s effect on municipal finances became apparent to most market participants. While Moody’s pace of upgrades slowed in response to the recession, S&P behaved as though the recession never happened.
We believe this broader context is important to understanding how S&P could rate Chicago’s general obligation pledge at A+ (now A-) while Moody’s rates the same pledge at Ba1. Specific to Chicago, however, we find that not only has the market long treated Chicago’s debt as being at a speculative credit quality — but that it is also well-founded given the credit fundamentals.
Moreover, it is worth noting that the credit rating agencies have published rating methodologies. S&P’s US Local Government General Obligation Ratings Methodology and Assumptions (September 12, 2013 — stashed behind their paywall) includes overriding factors for liquidity and structural imbalance that the rating agency has long decided to ignore for Chicago. Those factors would have put a junk-level ceiling on Chicago’s ratings. In other words, S&P is arbitrarily holding Chicago to different standards than the other local governments the agency rates. And it is obvious why.
What financial risks does Chicago pose to investors?
Let’s examine Chicago’s credit profile and you can decide whether or not the city’s bonds are speculative investments.
Unfunded pension liabilities
The magnitude of Chicago’s unfunded pension liabilities receives considerable attention, and rightfully so. From Nuveen:
Chicago’s combined annual debt and pension costs are substantially higher than any [of the ten largest US cities] when these obligations are indexed to total governmental revenue. Chicago’s fiscal 2015 debt service and annual pension costs account for 44.8% of fiscal 2013 governmental revenue. San Jose is the next closest city at 27.8%. The nine cities other than Chicago averaged 22.4% of revenue.
The next 10 years will be the most difficult for Chicago, as current statutes require the city to increase contributions to its four pension plans by 135 percent in 2016, and 8 percent annually through 2021, according to Moody’s. Pension payments will rise 3 percent, on average, through 2026 and around 2 percent through 2032 …
The median per capita aggregate unfunded actuarial accrued pension liability for the largest US cities and Puerto Rico is $3,350. The City of Chicago’s is $7,149.
Most municipal market analysts assume that the city will address its unfunded pension liabilities and relatively high debt burden by increasing residents’ property taxes by nearly 50%.
Chicago officials have been unwilling to raise property taxes for at least a decade. Offering documents indicate that this attitude continues. The city iscurrently in negotiations with its police and fire unions to postpone transitioning from a system of arbitrary contributions to actuarial contributions (i.e., contributions that reflect the true cost of benefits).
If officials lack the political will to raise taxes when their bonds are trading at 300 basis points (3%) over the AAA benchmark, will there ever be a resolution short of insolvency? This is a material risk that should not be shrugged off.
Borrowing money in order to borrow money
Bloomberg also notes that Chicago has the second-highest general obligation debt per capita among US cities at $3,047, following New York City at $5,500.
According to offering documents (available here), the city won’t be able to afford to make debt service payments on its outstanding bonds from available funds until 2019. The city has been borrowing money on a long-term basis to make debt service payments since before the financial crisis:
Since 2007, proceeds from general obligation bonds in the range of $90 million to $170 million per year have been used to make the city’s general obligation debt service. The city expects to use approximately $220 million of proceeds of long-term general obligation bonds to fund general obligation debt service in levy year 2015 for debt service paid in 2016. The city currently plans to eliminate the use of general obligation bonds to pay general obligation debt service by 2019.
As I described at length in my earlier essay, How Chicago Has Used Financial Engineering to Paper Over its Massive Budget Gap, the city has also been using long-term debt to: (1) finance everyday expenses and maintenance; (2) finance judgments and settlements, including police brutality cases and retroactive wage increases and pension contributions for unionized employees; (3) restructure the city’s existing debt to extend the the maturities on its bonds far out into the future, in order to avoid having to pay the debt as it was coming due; and (4) provide slush funds for the city’s 50 aldermen to undertake projects in their respective areas (i.e., pork).
State and local governments typically only issue bonds to finance the construction of capital projects — buildings and infrastructure with long useful lives that will benefit residents for generations. Chicago has incurred literally billions of dollars of debt where residents have nothing to show for it.
Excessive reliance on short-term debt
Besides a sharp loss in population (as what happened in Detroit), excessive reliance on short-term debt is a solid indicator of financial stress. Chicago has essentially used its credit lines as permanent source of funding in the sense that they are usually carrying a large balance and have frequently been utilized for non-capital expenditures. The city recently expanded its short-term borrowing program to $1 billion. For the sake of comparison, the city’s general fund operating budget is in the neighborhood of $3.3 billion.
Forbearance agreements
Apparently the irony of assigning an investment grade rating to an issuer that is already in forbearance — i.e., its lenders and counterparties have conditionally agreed to delay declaring events of default and exercising their rights and remedies —has been lost on the rating agencies, let alone an issuer that has $2.2 billion worth of forbearance agreements for variable rate debt, short-term credit facilities, and interest rate swap agreements. Chicago’s offering documents contain six pages of triggered events of default. It would be understandable if the city simply needed to replace a deal participant, but having to take it all out at (presumably) much higher interest cost in short order?
Absent these forbearance agreements, that $2.2 billion would become due immediately. The city usually has less than $1 billion of liquidity. The municipal bond market has not seen a liquidity problem of this magnitude for a local government borrower since the financial crisis. And S&P calls this situation “short-term interference.”
Although a portion of these products will be addressed by the city’s offering this week, Chicago’s lenders and counterparties have imposed some strict conditions on the remaining amount. The agreements are for a short period of time and if the city’s credit continues to deteriorate, the standstill agreements will end and the remaining amount will come due.
A large and diverse tax base, but…
Many of the analysts arguing that Chicago should still be considered investment grade cite the city’s large and diverse tax base. Chicago is a transportation hub and home to a number of major corporations.
The city’s population has been declining in recent years and only grew by 82 residents last year. That is not a typo. According to the Chicago Tribune:
Chicago’s population grew by only 82 residents last year, giving it the dubious distinction of being the slowest-growing city among the top 10 US cities with one million or more residents.
With a population of 2,722,389 residents as of July 1, 2014, Chicago still easily holds its place as the nation’s third-largest city … But cities on both sides of it are gaining.
New York maintained its ranking as the nation’s largest city, gaining 52,700 residents last year, for a gain of 0.6 percent that pushed its population to 8,491,079. Los Angeles added 30,924 residents, up 0.8 percent and bringing its population to 3,928,864.
Sun Belt cities with more than 1 million residents — places like Houston, San Antonio, Dallas and Phoenix — all continued to see dramatic gains in new residents …
“The boom of Chicago in the 1990s was due to immigration,” said Rob Paral, a Chicago-based demographer who advises nonprofits and community groups. “You take away the catalyst of immigration, and you see what we have. They’re going to different parts of the country, and there much less immigration to the US than there was decades ago.
“Texas, as an example, has been a magnet for a lot of lower-paying jobs and has the benefit of lower housing costs. If you’re making $15 an hour, the difference between making it where a house costs $100,000 and $300,000 is great.”
This last point brings us to property taxes. Some have also pointed out that Chicago has the lowest effective tax rate in Cook County, which means the city can withstand a large tax increase. This is true. According to Bloomberg, Chicago’s effective tax rate on residential property is 1.8% versus Harvey’s 8.9%. On commercial property, Chicago is not the lowest, but its 4.9% effective tax rate is much lower than Harvey’s 15.1%.
Discussing the level of property taxes in absolute terms fails to capture residents’ calculus in deciding on where to live, however. Just because Chicago has a lower tax rate does not mean residents will stay in the city if or when tax rates are increased significantly. In other areas, higher taxes will translate into more government services, better schools, and so on. In Chicago, they will be used to offset the costs associated with meaningless debt and unfunded pensions from a decade of fiscal mismanagement. That’s a huge difference and something to take into account.
The city has few assets left to sell
Chicago has already blown through the reserves it established from the Skyway and lease of its parking meters. It could try to hawk Midway Airport, but that has already failed three times.
The city’s other tax districts have their own problems
The Chicago Board of Education is also heavily indebted and its recent downgrade likewise triggered events of default. These will force the school system to pay penalty interest rates ranging from 9% to 13.5% and make swap termination payments. The board has significant unfunded pension liabilities and a $1 billion deficit.
Bonds are legally and likely politically subordinated to pension benefits
Some rulings in federal bankruptcy cases suggest that Chapter 9 could potentially be used to adjust pension liabilities. For that to happen, however, the municipality would have to want to adjust its pension liabilities. So far, when capital markets creditors have gone toe-to-toe with pension beneficiaries in court, they have walked away with massive haircuts.
Why is this happening? I see two (largely ignored) things driving outcomes in municipal bankruptcy cases where pensions are involved. The first is that courts neglect to situate claims in larger public policy contexts. Perhaps this is because some of the judges and law firms involved have mostly corporate restructuring experience and do not fully understand how public policy works. Perhaps it is just impossible the way Chapter 9 was drafted. Whatever the reason, the vocabulary of sacrifice in Chapter 9 cases has become quite mangled. The second is that Chapter 9 provides subtle opportunities for political rebalancing in regions where machine politics prevails. Let’s discuss these in turn.
The treatment of other post-employment benefits (i.e. health care) has been a land mine for capital markets creditors in Chapter 9 cases, whether they realize it or not. Bankruptcy judges have agreed with the municipalities that pension beneficiaries are “making sacrifices” when a plan of adjustment strips them of their health care benefits but leaves their income benefits intact.
It has become something of a farce that the courts fail to recognize and quantify the other forms of government assistance available to retirees in determining the scope of their sacrifices. In a post-Affordable Care Act world, a municipality shedding OPEBs is not an economic sacrifice — it is tantamount to transferring those commitments from local taxpayers to state and federal taxpayers. It does seem like a sacrifice from a contract perspective, however, which allows locals to say, “See what we gave up? Now it is your turn.”
This is sufficient logic for capital markets creditors to receive haircuts, which then provide the resources required for the city to honor its pension commitments. To the extent that there are future Chapter 9 cases, expect OPEBs to be the starting point for crafting a plan of adjustment going forward. It’s just too easy.
If one looks at these insolvencies from the standpoint of local politics, it is not difficult to see how capital markets creditors can end up in the crossfire between different interest groups. Market observers tend to talk about organized labor as if it were a unified whole. In reality, large city governments can have dozens of labor groups with different perspectives and connections. This can be a very big deal with respect to pension politics. Cities can have several different pension plans depending on employees’ affiliations with funded levels that vary according to influence. Pension contributions are appropriations and appropriations are political.
If a municipality can keep its income benefits whole by making a token sacrifice that “frees up” funds that would have otherwise gone to investors, then policymakers can realign the political interests of all of these groups. They are all finally back on equal footing with respect to what they are due from the government. This keeps the machine working like a machine. Considering that governments can wander down this path (and in Detroit’s case, with open contempt for its investors) and still have some borrowing options, it is not surprising that Chapter 9 cases remain tethered to local politics.
That’s a bit of a digression, but it is still instructive with respect to Chicago. Chicago bondholders could potentially be subjected to the same destructive politics, but they would be in a worse situation legally if the city’s credit continued to deteriorate. Chicago is not eligible to file for Chapter 9, which means bondholders would have seek remedies in state courts with resistance from all of the other stakeholders (who are local). The Illinois Supreme Court has elegantly subordinated their claims to pensions through its interpretation of the state constitution and has expressed indifference about the financial impact. Absent Chapter 9, there isn’t even the possibility of sharing resources.
Regardless of what one thinks about ratings divergence, the divergence between the rating agencies and market participants with skin in the game makes perfect sense. Bondholders have been repeatedly hosed for giving municipalities the benefit of the doubt in these circumstances.
How I regard financially challenged governments
Chicago’s fiscal emergency is the confluence of two distinct, but related, problems: (1) the city has made extraordinarily bad decisions for over a decade about how to manage its resources; and (2) the city has made extraordinarily bad decisions for over a decade about which financial products to use in borrowing money. Both the city and its school system used excessive amounts of short-term debt, variable rate debt, and interest rate swaps. They have also waited until it is too late (expensive) to transition their debt portfolio to a more sustainable structure.
Ester Fuchs points out in Mayors and Money: Fiscal Policy in New York and Chicago, a classic text on fiscal crises, that municipalities can “afford” (i.e., financially survive) decades of mismanagement as long as the municipality can service its debt. While I agree with this observation (cynical as it is), I believe financial innovation has introduced some notable twists.
A municipality can “afford” either protracted fiscal mismanagement or an unconventional debt structure. Municipalities that are dealing with both, however, tend to be screwed. As its credit deteriorates, resources that would have cushioned the municipality against mismanagement are instead diverted to resolving broken debt structures (until they aren’t).
In Chicago’s case, the city is going to have to learn how to function without most of the gimmicks that have helped it through the last decade. Many market observers underestimate how difficult that will be, even with steep tax increases. They also seem to believe city officials are capable of becoming intellectually honest overnight.
Chicago is hardly exploring new territory here. All of the recent insolvencies in the municipal bond market have combined protracted fiscal mismanagement with a reliance on innovative financial products (e.g., interest rate swaps and pension obligation bonds). This epiphany continues to elude many market participants, especially those who believe credit analysis is as simple as financial ratios.
Perhaps Chicago will successfully navigate through this storm, but it is insane to disregard the risk involved.
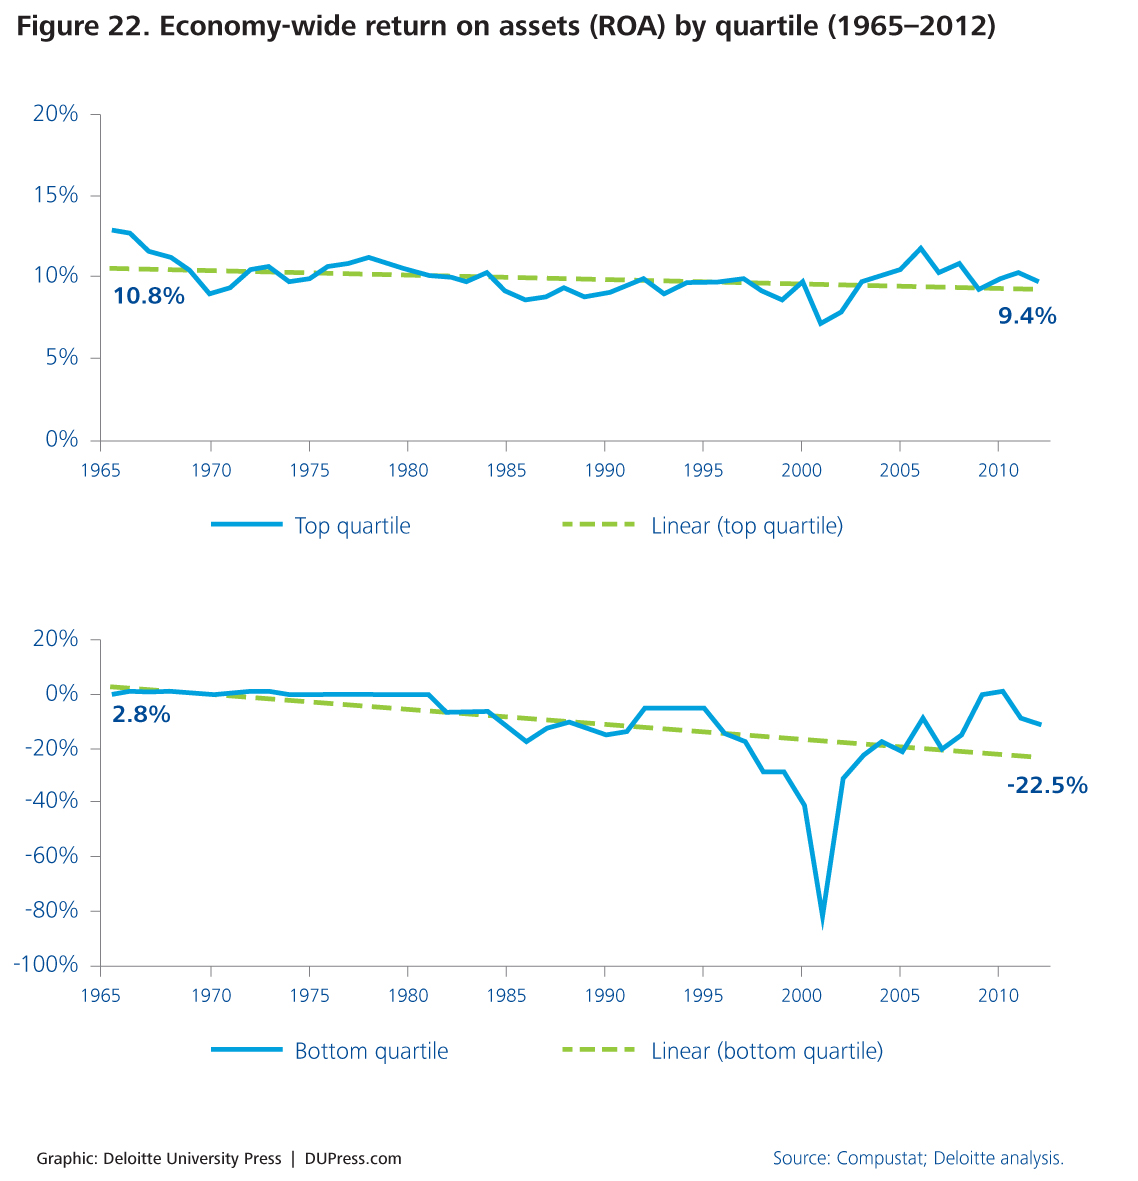
Our last lesson was in Mean Reversion (Chapter 5 in Deep Value) discussed http://wp.me/p2OaYY-2Ju View this video on a very MEAN Reversion.
We must understand full cycles and reversion to the mean. Let’s move on to reading Chapter 2: A Blueprint to a better Quantitative Value Strategy in Quantitative Value.
Investors should be skeptical of history-based models. Constructed by a nerdy-sounding priesthood using esoteric terms such as beta, gamma, sigma and the like, these models tend to look impressive. Too often, though, investors forget to examine the assumptions behind the symbols. Our advice: Beware of geeks bearing formulas. -Warren Buffett, Shareholder Letter, 2000.
A WONDERFUL BUSINESS
Greenblatt defined Buffett’s definition of a good business as a high Return on Capital (ROC) – EBIT/Capital
Capital is defined as fixed asses + working capital (current assets minus current liabilities) minus excess cash.
ROC measures how efficiently management has used the capital employed in the business. The measure excludes excess cash and interest-bearing assets from this calculation to focus only on those assets actually used in the business to generate the return.
A BARGAIN PRICE
High earning yield = EBIT/TEV
TEV + Market Cap. + Total debt – minus excess cash + Preferred Stock + minority interests, and excess cash means cash + current assets – current liabilities.EBIT/TEV enables and apples-to-apples comparison of stock with different capital structures.
Improving on the Magic Formula?
ROC defined as Gross profitability to total assets.
GPA = (Revenue – Cost of Goods Sold)/Total Assets
GPA is the “cleanest” measure of true economic profitability.
The authors found GPA outperformed as a quality measure the magic formula. Note on page 48, Table 2.3: Performance Stats for Common Quality Measures (1964 – 2011) that most simple quality measures do NOT provide any differentiation from the market!
The authors found that analyzing stocks along price and quality contours using the Magic Formula and its generic academic brother Quality and Price can produce market beating results
The authors: “Our study demonstrates the utility of a quantitative approach to investing. Relentlessly pursuing a small edge over a long period of time, through booms and busts, good economies and bad, can lead to outstanding investment results.”
Ok, let’s come back to quality and avoiding value/death traps in the later chapters (3 and 4) in Quantitative Value. We are just covering material in Chapter 2.
INVESTORS BEHAVING BADLY
Investors and the Magic Formula
Adding Your Two Cents May Cost a Lot Over the Long Term by Joel Greenblatt
01-18-2012 (Full article: Adding Your Two Cents
Gotham Asset Management managing partner and Columbia professor Joel Greenblatt explains why investors who ‘self-managed’ his Magic Formula using pre-approved stocks underperformed the professionally managed systematic accounts.
So, what happened? Well, as it turns out, the self-managed accounts, where clients could choose their own stocks from the pre-approved list and then follow (or not) our guidelines for trading the stocks at fixed intervals didn’t do too badly. A compilation of all self-managed accounts for the two-year period showed a cumulative return of 59.4% after all expenses. Pretty darn good, right? Unfortunately, the S&P 500 during the same period was actually up 62.7%.
“Hmmm….that’s interesting”, you say (or I’ll say it for you, it works either way), “so how did the ‘professionally managed’ accounts do during the same period?” Well, a compilation of all the “professionally managed” accounts earned 84.1% after all expenses over the same two years, beating the “self managed” by almost 25% (and the S&P by well over 20%). For just a two-year period, that’s a huge difference! It’s especially huge since both “self-managed” and “professionally managed” chose investments from the same list of stocks and supposedly followed the same basic game plan.
Let’s put it another way: on average the people who “self-managed” their accounts took a winning system and used their judgment to unintentionally eliminate all the outperformance and then some! How’d that happen?
1. Self-managed investors avoided buying many of the biggest winners.
How? Well, the market prices certain businesses cheaply for reasons that are usually very well-known (The market is a discounting mechanism). Whether you read the newspaper or follow the news in some other way, you’ll usually know what’s “wrong” with most stocks that appear at the top of the magic formula list. That’s part of the reason they’re available cheap in the first place! Most likely, the near future for a company might not look quite as bright as the recent past or there’s a great deal of uncertainty about the company for one reason or another. Buying stocks that appear cheap relative to trailing measures of cash flow or other measures (even if they’re still “good” businesses that earn high returns on capital), usually means you’re buying companies that are out of favor.
These types of companies are systematically avoided by both individuals and institutional investors. Most people and especially professional managers want to make money now. A company that may face short-term issues isn’t where most investors look for near term profits. Many self-managed investors just eliminate companies from the list that they just know from reading the newspaper face a near term problem or some uncertainty. But many of these companies turn out to be the biggest future winners.
2. Many self-managed investors changed their game plan after the strategy under-performed for a period of time.
Many self-managed investors got discouraged after the magic formula strategy under-performed the market for a period of time and simply sold stocks without replacing them, held more cash, and/or stopped updating the strategy on a periodic basis. It’s hard to stick with a strategy that’s not working for a little while. The best performing mutual fund for the decade of the 2000’s actually earned over 18% per year over a decade where the popular market averages were essentially flat. However, because of the capital movements of investors who bailed out during periods after the fund had underperformed for a while, the average investor (weighted by dollars invested) actually turned that 18% annual gain into an 11% LOSS per year during the same 10 year period.[2]
3. Many self-managed investors changed their game plan after the market and their self-managed portfolio declined (regardless of whether the self-managed strategy was outperforming or underperforming a declining market).
This is a similar story to #2 above. Investors don’t like to lose money. Beating the market by losing less than the market isn’t that comforting. Many self-managed investors sold stocks without replacing them, held more cash, and/or stopped updating the strategy on a periodic basis after the markets and their portfolio declined for a period of time. It didn’t matter whether the strategy was outperforming or underperforming over this same period. Investors in that best performing mutual fund of the decade that I mentioned above likely withdrew money after the fund declined regardless of whether it was outperforming a declining market during that same period.
4. Many self-managed investors bought more AFTER good periods of performance.
You get the idea. Most investors sell right AFTER bad performance and buy right AFTER good performance. This is a great way to lower long-term investment returns.
Go-where-it-is-darkest-when-company.html(Vale-Brazilian Iron Ore Producer). Prof. Damordaran values Vale and Lukoil on Nov. 20, 2015. I am looking at Vale because they have some of the lowest cost assets of Iron Ore in the world. They have good odds of surviving the downturn but where the trough is–who knows.
I think the author at least knew of the risks, but underestimated the extent of the cycle due to massive distortions caused by the world’s central banks. It did get darker..as iron prices fell another 10% and still falling.
Month
Price Iron Ore
Change
Aug 2014
92.63
–
Sep 2014
82.27
-11.18 %
Oct 2014
80.09
-2.65 %
Nov 2014
73.13
-8.69 %
Dec 2014
68.80
-5.92 %
Jan 2015
67.39
-2.05 %
Feb 2015
62.69
-6.97
Damodaran: I have not updated my valuation of Vale (as of Feb. 20th), but I have neither sold nor added to my position. It is unlikely that I will add to my position for a simple reason. I don’t like doubling down on bets, even if I feel strongly, because I feel like I am tempting fate.
Prof. Damodaran is responding to a poster who is asking about Vale’s plummeting stock price. If you are a long-term bull you want declining prices to bankrupt weak companies in the industry so as to rationalize supply.
A franchise-type company does not often become a distressed, deep value investment. But since we will next be discussing Buffett and his development from cigar-butt investing to buying See’s Candies, I thought a review of franchises by this money manager would interest you.
One mistake investors make is confusing an average company with a franchise. Not to pick on anyone but when Monish Pabrai said Pinnacle Airlines had a moat due to the type of aircraft the airline was flying or Excide Batteries had a brand, he thought he was investing in a franchise. Yes, Excide batteries may be well-known but it doesn’t change a consumer’s behavior.
Inflationary Expectations If you only study one aspect of human action to understand our current environment, let it be this:
There is no scientific way to predict at what point in any inflation expectations will reverse from deflationary to inflationary. The answer will differ from one country to another, and from one epoch to another, and will depend on many subtle cultural factors, such as trust in government, speed of communication, and many others. In Germany, this transition took four wartime years and one or two postwar years. In the United States, after World War II, it took about two decades for the message to slowly seep in that inflation was going to be a permanent fact of the American way of life.
When expectations tip decisively over from deflationary, or steady, to inflationary, the economy enters a danger zone. The crucial question is how the government and its monetary authorities are going to react to the new situation. When prices are going up faster than the money supply, the people begin to experience a severe shortage of money, for they now face a shortage of cash balances relative to the much higher price levels. (page 67, The Mystery of Bankingby Murray Rothbard). How banks create money in the modern economyfractional-reserve-banking-and-the-fed_salernoThe Mystery of Banking
But csinvesting.org readers know their history when technological change or a catalyst for regulatory change Airline_deregulation upends an incumbent, then the plunging price becomes a value trap versus an opportunity. Reflexively reaching for this 8% yield by not turn out well.
Of course, the future is uncertain, but after a five year bull run, failure to advance after last quarter’s earnings beat and pricing pressure from UBER, then TAXI’s high valued medallions may become less so. The government is placing an artificial restriction to keep supply low while boosting prices that hurt consumers’ choices and pocketbook. I wonder how this fight will turn-out? I will be watching this unfold.
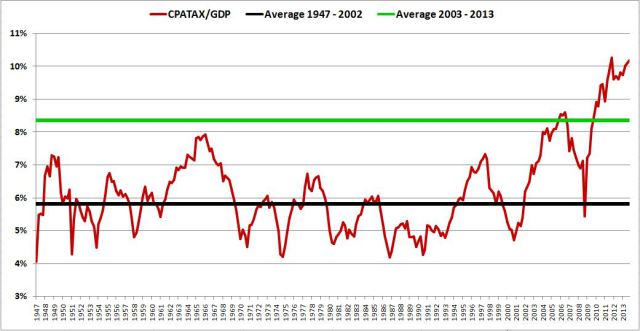
The following chart shows CPATAX divided by GDP from 1947 to present. The black line represents the average from 1947 to 2002, and the green line represents the average from 2003 to 2013.
As you can see in the chart, CPATAX/GDP is wildly elevated at present. It currently sits 63.3% above its average from 1947 to 2013, and a whopping 75.0% above its average from 1947 to 2002.
As readers of this blog have probably inferred by now, I’m not very patient when it comes to waiting for “mean-reversion” to occur. In my view, when a variable deviates for long periods of time from a reversion pattern that it has exhibited in the past, the right response is to expect something important to have changed–possibly for the long haul, such that a predictable reversion to prior averages will no longer be readily in the cards. The task would then be to find out what that something is, and try to understand it. Go here:
Can you help me understand one aspect of ROE? In Indian companies, some of the companies have ROE < ROCE.
Isn’t that a violation of the observation that ROE ~ ROCE times Leverage.
I define ROCE as Return on Capital Employed.
ROCE = EBITDA (1-Tax Rate)/Total Capital Employed (=Debt+Equity)
I use ROCE as a measure of the attractiveness of the industry and the company. High ROCE is good, implying a moat, low ROCE is not.
Some of the reasons I could think of are:
Exceptional losses, which lead to Net Income << EBIT(1-Tax) *Leverage
Extremely high interest charges. ( higher than return on the debt portion) which leads Net Income << EBIT(1-Tax)* Leverage
There is a slump sale of a division, and thus suddenly huge amount of profit has come inincreasing inordinately the average shareholder equity. So suddenly the effective leverage has dropped.
Update May 1:
I made a mistake in describing ROCE. In my defense, I dont exactly calculate ROCE and merely use the numbers from screens.
ROCE = EBIT(1-Tax Rate)/ Total Assets and not EBITDA as mentioned before.
Does someone want to have a crack at this? I see issues whenever you use EBITDA without understanding maintenance capex. Please read this:Placing EBITDA into Perspective
The prior post asked you to guess the name and price that you would pay for this case study: http://wp.me/p2OaYY-2np (Part 1)
It is Annual:1974-annual-report-for-walmart-stores-inc. If you had paid the HIGHEST possible market price in 1974 or the first quarter of 1975 (after reading this annual report), you would have about 1, 300 times your money over 40 years not including annual dividends which today stand at about 31 times what you paid in the market (WMT 2014) through and despite wars, high inflation, double-digit interest rates, civil unrest, political changes and a mundane, extremely competitive industry, AND WMT’s stock price “UNDER-performing” the general stock market one-third of the time. See Wal-Mart 50 Year Chart_SRC.
Eat your heart out Buffett, Munger, Peter Lynch, and all other investing pantheons. The point is you would have made a lifetime fortune sitting on your hands for more than a third of a century. WMT is the pinnacle of an investment–a relentless compounding machine. Buffett said the goal of an investor is to put together a portfolio of compounding machines.
Well, Wal-Mart was the king of compounders; a company that could generate high returns on capital AND reinvest those high returns into similar high returns. As many of you know, it is easy to spot a company with high ROIC or ROE but how do you know if the company can grow and reinvest those high returns at the same high rates? If not, then that company should return the excess capital which it can’t reinvest to you through dividends or appropriate (below intrinsic value) stock buy-backs.
You could have paid any price in 1974, 1975, 1976, 1977, 1978, 1979 and generated over-15% annual returns. How would you know that WMT would keep growing with such high returns? What could you have KNOWN? What can we use for tomorrow’s investments?
AT Hindsight Capital (my firm) we always pick the Wal-Marts.
Joking aside, what is the point of this case study and what are the lessons we can use? Let’s be realistic, we may never find another “Wal-Mart” but at least we can study “perfection” or the best to grasp what principles to look for in a company and an investment. You could do worse than spend weeks or months studying the history of Wal-Mart. Start here Walmart.com/annual-reports and go to here: WalMart_AR. And read: Sam-Walton-Made-America.
You gotta at least see and hear excellence to know it.
Let’s get back to Wal-Mart. What is the essence–the key–to its ability to grow profitably for so long? What can you spot in the 1974 annual report that would have alerted you to its competitive advantage? In other words, follow Hannibal Lecter’s tutelage when analzing any investment: What is its nature? http://youtu.be/f33ieCWRWlI.
Here are two hints:
Sam Walton‘s passions included flying his own plane over the American countryside, hunting with his dogs, and sharing his good fortune with his family. But Walton will always be best remembered for his lifelong passion for providing low prices and good service to customers at Wal-Mart, his chain of discount stores that revolutionized the retail industry.
Walton did not invent the discount store when he opened his first store in 1962. But he did do something new. Wal-Mart introduced the concept of selling a large number of items at cheap prices to residents of rural towns—customers other discount retailers ignored. From that base, Walton expanded Wal-Mart across the United States and eventually reached into foreign markets, using the latest technology to keep costs low.
“I think I overcame every single one of my shortcomings by the sheer passion I brought to my work.… If you love your work, you’ll be out there every day trying to do it the best you possibly can.” Read more: Walton
The second hint is that you will not see the financial results of WMT’s competitive advantage in its GROSS margins but in its NET margins. WHY?
The answer to my questions can be found in Competition Demystified (Chapter 5) but don’t cheat yourself. Think it through. In fact, if YOU wanted to get a job at hedge fund, investment firm or even work for a major service firm, you could do a comprehensive study of Wal-Mart’s rise and semi-fall of its competitive advantage and then find a new company or industry (Auto-parts?) where the same factors are at work. Show what you can do while providing a study of value. You will stand out from all the Harvard and Columbia MBAs.
I will post in Part 3: Analysis on WMT next week. Meanwhile focus on what is important.
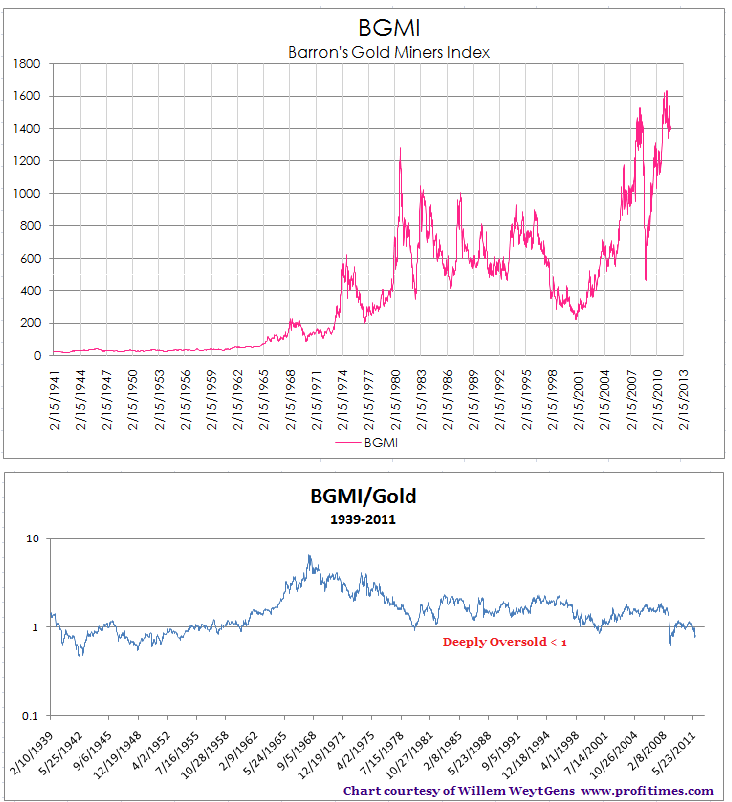
Mark Twain: “A mine is a hole in the ground with a liar standing next to it.”
Initial Steps
We first have to understand the product/market of our gold company. Gold companies produce gold and silver which is money. What is money? Precious metals have exchange value which makes up a large part of their value. You first have to understand the gold market. Note: why did gold go down LESS than other commodities such as oil in the 2008/2009 credit crisis?
You need to draw up an industry map. How? Find out who the participants are.