The Santangel’s Investor Forum invites eligible students to apply to receive a free ticket to attend the 2015 Forum, to be held in New York City on October 22, 2015.
A benefactor who wishes to remain anonymous has endowed a table at the upcoming conference to enable a select number of talented students to attend the annual invitation-only event.
All enrolled undergraduate and graduate students are eligible. Interested candidates should apply by emailing their resume and a current investment idea write-up to Steven Friedman (sfriedman@santangels.com). The idea can be for any type of security or asset class, but the write-up must be limited to 300 words. Preference will be given to unique and original ideas. Please submit ideas by September 15, 2015.
Please feel free to pass this along to anyone who may have an interest.
We skip Chapter Six (for now) and focus on Chapter 7 in DEEP VALUE: Catch a Falling Knife: The Anatomy of a Contrarian Value Strategy
In Search of Un-Excellence
The authors identified 36 publicly traded “excellent companies” on the basis of out-performance in six criteria, measured from 1961 to 1980.
Asset growth
Equity growth
Return on total capital
Return on equity
Return on sales
Market to book value
Then an investment analysts, Michelle Clayman, identified 39 publicly traded “un-excellent companies” which ranked in the bottom third of all Peters and Waterman’s criteria from 1976 to 1980. These “in search of disaster” companies outperformed 24.4% pa over five years vs. 12.7% for the “excellent” companies.
The good companies under-perform because the market overestimates their future growth and future return on equity and, as a result, accords the stocks overvalued price-to-book ratios; the converse is true of the poor companies.
Over time, company results have a tendency to regress to the mean as underlying economic forces attract new entrants to attractive markets and encourage participants to leave low-return businesses. Because of this tendency, companies that have been good performers in the past may prove to be inferior investments, while poor companies frequently provide superior investment returns in the future.”
Note pages 128 to 136 in DEEP VALUE: Tables 7.1 to 7.9
Stocks in the Contrarian Value portfolios were cheaper than the comparable Glamour portfolios on every metric but on a Price-to-Earnings basis, possibly because the earnings in those portfolios were so weak.
First, valuation is more important than growth in constructing portfolios.
Cheap, low growth portfolios systematically outperform expensive, high-growth portfolios, and by wide margins. It seems that the uglier the stock, the better the return, even when the valuations are comparable. Oppenheimer found in a study on Ben Graham Net/Nets that loss making and non-dividend paying net/nets outperform profitable, dividend-paying net/nets. Ben Graham Net Current Asset Values A Performance Update
In almost any study, the cheap, hated, ugly, least-admired, and poorly performing stock outperforms the high-growth, glamour stocks.
What these studies demonstrate is that mean reversion is a pervasive phenomenon, and one that we don’t intuitively recognize. Our untrained instinct is to pursue the glamorous stock, the high-growth stock, the story stock, the excellent stock, the admired stock, the A+ stock, or even the profitable net net, but study after study shows that this instinct leads us to under-perform. Buying well-run companies with good businesses at bargain prices seems to make even more sense. The research shows , however, that the better investment–rather than the better company–the value stock, the scorned, the unexcellent, the Ds, the loss-making net nets. And the better value stock, according to Lakonishok, Shleifer, and Vishny’s research is the low-no-growth value stock, what they describe as “contrarian value,”
What is clear is that value investing in general, and deep value (buying the ugliest of ugly) in particular, is exceedingly behaviorally difficult. It is counter-intuitive and against instinct, which is why many investors shy away from it.
Lecture by Toby Carlisle on Deep Value Investing
Next Lesson:
We will finish up this chapter by covering The Broken-Leg Problem. Please give this chapter a close study–the conclusions are extremely COUNTER-INTUITIVE and the opposite of what most investors look for. We are at the heart of deep value investing.
When everything is coming your way, you’re in the wrong lane. –S. Wright
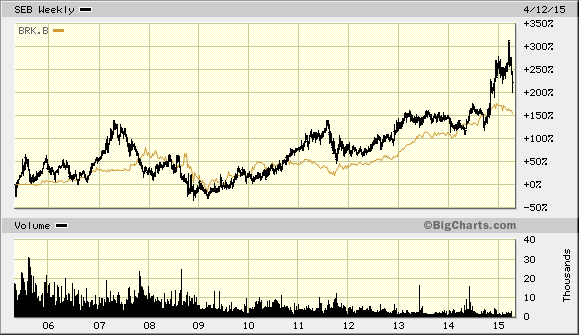
Above you can see Seaboard’s stock price vs. Berkshire’s over the past decade.
Below is a good example of research on a cyclical company. Note that the analyst goes back far enough to see how the business performs over several cycles and economic booms and busts. You may not agree with his conclusions (say that the company will continue to grow at 12%) but you can clearly see his assumptions.
If readers in the Deep-Value group (Google Groups) find interesting case studies don’t hesitate to share with the group. You will learn more from each other than from just reading this blog or the blogs listed below.
I couldn’t repair your brakes, so I made your horn louder. –Steven Wright
A Reader shares good news.
Hi John,
Partly motivated by your blog and lectures on value investing, I decided to quit my dead-end Hedge Fund job, and open my own investment management firm, Apatheia Capital. Think Schloss, and early Greenblatt special situations.I intend to use the best from quant and value investing in terms of buying cheap special situation stocks consistently.
So far it has been fun, exciting and anxiety-ridden process, and few friends and family have been misguided to be infected by my optimism. Please keep up the good work! I cannot stop thinking about my ideas (about ever-present fat tails in special situation value stocks). So far in the process, I have filed for state registrations etc. and finalized a mission document for the firm.
—
I wish you a great journey. Be flexible and patient. Use your small size to your advantage by going anywhere there is value. Keep good records of your investment journey and keep in touch!
The Relation Between The Enterprise Multiple and Avg Stock Returns 2010 more research on the efficacy of using the enterprise multiple as an indicator of value. Remember to adjust for normalization because at the top of a cycle you will see low EV to EBITDA (like in housing circa 2005/06) or high EV/EBITDA (11 x) BTU VL Dec 2014 near a depressed cycle. Coal reserves are priced low and production doesn’t generate high enough cash flows for the industry to generate a normal return, so mines are being closed, production shuttered, mines consolidated. The cure for low prices is low prices.
Why can’t 70% of professional money managers beat chimps?
High fees/costs, index hugging, inconsistency, overconfidence in their ability to be above average, lovers of stories, herding, and the institutional imperative? Don’t forget incentives that differ from achieving performance like asset gathering. See the case study at the end of this post.
We left off with a reader asking why do money managers do better or follow a deep value approach? http://wp.me/p2OaYY-2IZ
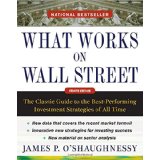
One goal of our Deep Value journey is to find a method that suits us. This method should have a large base case rate of beating an index over a long period of time, say fifty years. The lesson learned so far—I hope—is that CHEAPNESS wins whether that is price to book value, price to sales, price to cash flow. My recent reading of the most recent 4th Edition of What Works on Wall Street shows that high EBITDA-to-EV has beaten out Price-to-Sales (3rd Edition) What Works on Wall Street, Third Edition as the best metric as a value factor. However, combined with quality of earnings metrics, it performs even better or about 18% to 19% per year since 1964 to 2009. Our goal is to put the odds on our side and CONSISTENTLY play the odds through thick and thin. Our other edge is to realize how flawed our thinking is and thus we build protection against ourselves by developing a disciplined approach.
What Works: Notes from Joel Greenblatt’s class 2002:
Read: What Works on Wall Street by James P O’Shaughnessy. He started a fund in 1996-1997 but he underperformed the market by 25% and after three years in business of underperforming he sold his company at the bottom of the cycle. The guy who wrote the book quit his system! It seems like it is easy to do, but it is not easy to do.
This book, What Works on Wall Street, has born out its wisdom. The two funds that are patented that follow his strategy have been phenomenal. HFCGX is the patented fund based on his top idea of Cornerstone Growth; over the last 5 years it has had an average return of 13.44% per year vs. the Vanguard 500’s -2.01% per year (6/1/00 through 5/31/05). HFCVX is the patented fund based on his 2nd to best idea of Cornerstone Value; over the last 5 years it has had an average return of 6.47% per year vs. the Vanguard 500’s -2.01% per year (6/1/00 through 5/31/05).
The most interesting point is that the author points out those investors often are too emotionally involved to have the discipline to see the strategy through. Not only did the first reviewer bash the book because he did like the returns strategy JUST one year after the book came out, but Mr. O’Shaughnessy sold the funds to Hennessy Funds at the end of 1999 after it failed to surpass the returns of the bubble that soon after collapsed. Seven years after it was published an investor would be much wealthier had they followed the books top strategy instead of the investors who dog-piled onto the stocks of the market’s bubble.
We are going to try to understand why it works. Why it has to work over time. That is the only way you can stick it out. The math never changes: 2 + 2 = 4. That is the level of your understanding I want you to have by the time we are done. If I get that right, forget all this other stuff and noise, I will get my money. No genius required. Concepts will make you great and your ability to STICK IT OUT.
There is a lot of experience involved in valuation work, but it doesn’t take a genius or high IQ points to know the basic concepts. The basic concepts are what will make you the money in the long run. We are all capable of doing the valuation work.
—
Notes from the 4th Edition of What Works on Wall Street
Why Indexing Works
Indexing works because it sidesteps flawed decision-making and automates the simple strategy of buying the big stocks that make up the S&P 500. The mighty S&P 500 consistently beat 70 percent of traditionally managed funds over the long-term by doing nothing more than making a disciplined bet on large capitalization stocks.
Money Management Performance
Past records of most traditional mangers cannot be predictive of future returns because their behavior is inconsistent. You can’t make forecasts based on inconsistent behavior.
Common Sense Prevails
We now have the ability to empirically compare different investment strategies and their ongoing performance over time. What you will see in coming chapters is that almost all of them are deeply consistent with what common sense would tell you was true. Strategies that buy stocks that are selling at deep discounts to cash flow, sales, earnings , EBITDA-to-enterprise value (Yeah, but don’t forget MCX), and so on do extraordinary better than those that are willing to buy stocks with the richest valuation. WE will be sensitive to data mining.
Systematic, structured investing is a hybrid of active and passive management that automated the buy and sell decisions. If a stock meets a particular criteria, it’s bought. If not, not. No personal, emotional judgments enter into the process. Essentially, you are indexing a portfolio to a specific investment strategy and, by doing so, uniting the best of active and passive investing. The disciplined implementation of active strategies is the key to performance. Traditional managers usually follow a hit-and-miss approach to investing. Their lack of discipline accounts for their inability to beat simple approaches that never vary from the underlying strategy.
The ONE thing that unites the best money managers is consistency.
Successful investing requires, at a minimum, a structured decision-making process that can be easily defined and a stated investment philosophy that is consistently applied.
Goeth said, “In the realm of ideas everything depends on enthusiasm; in the real world, all rests on perseverance.” While we may intellectually understand what we should do, we usually are overwhelmed by our nature, allowing the intensely emotional present to overpower our better judgment.
Human Judgment is limited
Why models beat humans
Models beat the human forecasters because they reliably and consistently apply the same criteria time after time. It is the total reliability of application of the model that accounts for its superior performance.
We are ALL above average.
Base rates are boring
We prefer gut reactions and stories to boring base rates.
Stocks with low PE ratios outperformed the market in 99 percent of all rolling 10-year periods between 1964 and 2009.
The best way to predict the future is to bet with the base rate that is derived from a large sample.
Base rates are boring while experience is vivid and fun. Never mind that stocks with high P/E ratios beat the market less than 1 percent of the time over all rolling 10-year periods between 1964 and 2009.
Montier in his book, Value Investing writes: “One of the recurring themes of my research is that we just can’t forecast There isn’t a shred of evidence to suggest that we can.
We prefer the complex and artificial to the simple and unadorned.
Nowhere does history indulge in repetition so often or so uniformly as in Wall Street. When you read contemporary accounts of booms or panics, the one thing that strikes you most forcibly is how little either stock speculation or stock speculators today differ from yesterday. The game does not change and neither does human nature.—Edwin Lefevre.
Brain Research
Because of the interrelated nature of the emotional and rational centers of our brain, we will never be able to fully overcome our tendency to make irrational choices. Simply being aware of this problem does not make it go away. To break from our human tendencies to chase performance and perceive patterns where there are none, we must find an investment strategy that removes subjective, human decision-making from the process and relies instead on smart, empirically proven systematic strategies. We can become wise by realizing how unwise we truly are.
Rules of the Game
It is amazing to reflect how little systematic knowledge Wall Street has to draw upon as regards the historical behavior of securities with defined characteristics. –Ben Graham
Richard Brealey, a respected data analysis, estimated that to make reasonable assumptions about a strategy’s validity (95% confidence level or statistically relevant) you would need 25 years of data.
Short periods are valueless
Consider the “soaring sixties” when the go-go growth managers of that era switched stocks so fast that they were called gunslingers. The go-go investors of the era focused on the most rapidly growing companies without even considering how much they were paying for every dollar of growth. Between Jan 1, 1964, and Dec. 31, 1968, $10,000 invested in a portfolio that annually bought the 50 stocks in the Compustat data base with the best annual growth in sales soared to $33,000 in value , a compound return of 27.34 % a year. That more than doubled the S&P 500’s 10.16% annual return, which saw $10,000 grow to just $16,200. Unfortunately, the strategy went on to lose 15.7% per year for the following five years compared to a gain of two percent for the S&P 500.
Had this same hapless investor had access to long-term returns, he would have seen that buying stocks based just on their annual growth of sales was a horrible way to invest—the strategy returns just 3.88 percent per year between 1964 and 2009. Of course, the investor received similar results if he repeated the experiment between 1995 and 1999 and then the next five years.
EBITDA to EV was the best on an absolute basis for all the individual value factors we examine from 1964 to 2009 such as price to cash flow, price to earnings, etc.
EV/EBITDA in the lowest decile (the most EBITDA per EV) generated a 16.58% CAGR vs. 11.22% for the All Stocks universe with a standard deviation of returns of 17.71 percent, more than 1 percent below that of All stocks, 18.99 percent. The worst five-year period for the metric was 2000 during the Internet Mania. These ups and downs for a strategy are all part of the bargain you must strike with yourself as a strategic investor. Pages 103 to 124 in What Works (4th Ed.) The EV/EBITDA in the highest decile (the most “expensive) did the worst of all the value metrics studied!
EV works well as a guide to under-and-over valuation when contrasted to EBITDA, SALES, and Free cash flow.
Price to book value ratios are a long-term winner with LONG periods of underperformance.
Accounting Ratios can help identify higher quality earnings:
Total accruals to total assets
Percentage change in net operating assets (NOA)
Total accruals to average asses.
Depreciation expense to capital expense.
We are looking for stocks with high earnings quality.
Accounting variables mater. How companies account for accruals, how quickly they depreciate capital expenses and their additions to debt all have a serious impact on the health of their stock price.
Successful investing relies heavily on buying stocks that have good prospects, but for which investors currently have low expectations. Stocks with great earnings gains and high net profit margins are basically high expectations stocks.
History shows that using high profit margins as the SOLE determinant for buying a stock leads to disappointing results. The only lesson here is that it is best to avoid stocks with the lowest net profit margins.
A Case Study in Why Money Managers Lose Even With a Winning Hand
Winning Stock Picker’s Losing Fund
Value Line Research Service Has Beaten Market Handily, But Its Own Fund Suffered By Jeff D. Opdyke and Jane J. Kim Staff Reporters of THE WALL STREET JOURNAL Updated Sept. 16, 2004 12:01 a.m. ET
Value Line Investment Survey is one of the top independent stock-research services, touted for its remarkable record of identifying winners. Warren Buffett and Peter Lynch, among other professional investors, laud its system.
But the company also runs a mutual fund, and in one of Wall Street’s odder paradoxes, it has performed terribly. Investors following the Value Line approach to buying and selling stocks would have racked up cumulative gains of nearly 76% over the five years ended in December, according to the investment-research firm. That period includes the worst bear market in a generation.
Why the Fund Lagged
Past managers bought stocks that in some cases were well below the company’s top-rated choices, hurting performance.
Style drift: The fund has swung among small-, mid- and large-cap shares.
High turnover of fund managers meant little consistent investment discipline.
By contrast, the mutual fund — one of the nation’s oldest, having started in 1950 — lost a cumulative 19% over the same five years. The discrepancy has a lot to do with the fact that the Value Line fund, despite its name, hasn’t rigorously followed the weekly investment advice printed by its parent Value Line Publishing Inc. It also highlights the penalty investors often face when their mutual fund churns its management team and plays around with its investing style. In fact, late last night the person running the fund, Jack Dempsey, said that as of yesterday he had been reassigned and no longer had responsibility for managing the assets. Value Line couldn’t be reached to comment.
Most of all, the discrepancy between the performance of the fund and the stocks it touts shows that investors don’t always get what they think they’re buying in a mutual fund. For even though Value Line’s success is built around stocks ranked No. 1 by the company’s research arm, the fund’s managers have in recent years dipped into stocks rated as low as No. 3.
Ironically, even while Value Line’s own fund struggles to match the Value Line Investment Survey’s success, an independent fund company that licenses the Value Line name is doing much better with Value Line’s investment approach.
The First Trust Value Line 100 closed-end fund, run by Lisle, Ill.,-based First Trust Portfolios, adheres far more rigorously to Value Line’s investment principles, owning only the top-rated stocks.
Each Friday, First Trust managers log on to the Value Line site to download the week’s list of Value Line’s 100 most-timely stocks. During the next week, they sell the stocks that have fallen off the list and buy those that have been added. The result: Since its inception in June 2003, the First Trust Value Line fund’s net-asset value is up 12.4%, slightly better than the 11.6% gain the Standard & Poor’s 500-stock index posted in the same period.
Value Line’s own fund, meanwhile, gained 3.1% in that same time. Because the fund has been such a laggard in recent years, investors have been walking away. Assets in the fund — in the $500 million range as recently as 1999 — are now less than $200 million, though some of that stems from market losses.
Part of the underperformance stems from previous fund managers who didn’t rely entirely on Value Line’s proven model, opting instead to venture into lower-rated stocks, betting that active fund managers could unearth overlooked gems that one day would shine as top-rated stocks. Thus, investors who thought they were buying into Value Line’s winning investment strategy instead were buying into fund managers who thought they could outperform by second-guessing the company’s research — a tactic that didn’t work well.
Because the fund wasn’t performing well, the company changed managers frequently, searching for one who could post winning returns.
Value Line appeared to be moving back toward its roots in March, when it put Mr. Dempsey in charge of the fund. He isn’t the traditional mutual-fund manager; he’s a computer programmer who for a decade helped refine Value Line’s investment models. Value Line, which uses a team-managed approach, has had at least five lead fund managers since 1998, including Mr. Dempsey, according to Morningstar.
In an interview prior to his reassignment, Mr. Dempsey said he had been restructuring the fund to follow the ranking system “in a much more stringent fashion.” Today, about 95% of the stocks in the fund are rated No. 1. Mr. Dempsey said his goal was to liquidate within a week stocks that fell below Value Line’s No. 1 ranking.
The Value Line survey produces independent research on Wall Street stocks. The weekly view of 1,700 stocks, which costs $538 a year online (www.valueline.com) and nearly $600 in print form, is particularly popular with do-it-yourself investors and the abundance of investment clubs in the U.S. Value Line rates stocks in a variety of ways, but is especially known for its so-called timeliness rank. Stocks ranked No. 1 are timely and expected to outperform the market; those ranked No. 5 are expected to lag.
Instead of running an actively managed fund in which a manager cherry-picks the stocks the fund owns, Value Line could operate what amounts to an index fund that simply owns the highest-ranked stocks in the survey. However, active managers believe they can improve the performance of a fund.
“As a fund manager, you want to add value,” Mr. Dempsey said. Still, he acknowledged that “it’s hard to beat our quantitative system.” In the short time that Mr. Dempsey was in charge — a nearly six-month period in which he transformed the portfolio — he accumulated losses of about 2%, compared with losses of 0.2% at the S&P 500. However, he topped the First Trust fund, which is down about 2.5% in the same period. Under Mr. Dempsey, the fund accumulated significant positions in stocks such as Research In Motion Ltd. and added new positions in Yahoo Inc. and Arrow Electronics Inc., among other companies, according to Morningstar.
Value Line, based in New York, doesn’t detail the inner workings of its proprietary stock-picking model. By and large, though, the strategy is built around stocks displaying price and earnings momentum and posting earnings surprises, says John James, chairman of the Oak Group, a Chicago company that runs hedge funds, some of which try to anticipate changes in Value Line’s stock rankings and then invest based on which stocks will rise to No. 1 from No. 2.
However Value Line’s model works, there’s no question the company’s research produces winning choices. Value Line’s list of stocks ranked No. 1 produced cumulative gains of nearly 1,300% from Dec. 31, 1988 through June, 30, 2004, according to Value Line. The S&P 500, by comparison, posted cumulative gains of 311%.
I must say lot of valuable advice from a seasoned investor.
I read the linked article, but I wonder if the folks here took away the key lesson(s)
OK, why was this investment a “Value Trap?” What can we learn from this example or ignore in this article? Are you investing when buying this bank? What makes a bank very different from investing in a widget factory? The article goes on to say you should wait for a catalyst. Is there a flaw to that argument? What about checklists? Can checklists save you from faulty thinking?
—
A Frustrated Reader:
Moreover, I wonder if it would be possible to have an index or anything like that in order to program and coordinate all classes and materials.
I teach under the chaos-and-mayhem method to force you to choose what is important to you. In a more serious light, we are going chapter-by-chapter in DEEP VALUE and it is supplement by Quantitative Value and other readings.
Next, use the search box in the upper right corner of this blog to type in: Lesson 1 Deep Value. Then scroll to the links and begin there. The blog supplements the readings. You should have already received a link to the book folder. Much of the materials are supplementary. For example, we read in Chapter 3 in Deep Value about Buffett’s career, so various case studies were linked in the various posts that correspond to the chapter like See’s Candies or Dempster Mills. Also, the Essays of Warren Buffett were sent out, but that is up to you if you want to read further (I highly recommend that you do and reread every year).
—
A Reader provides links:
Was on reddit’s Security Analysis sub (www.reddit.com/r/securityanalysis) and stumbled upon these notes from some other readers, good supplementary reading:
While I agree completely with your analysis, I think its worth noting additionally that:
Quant Value proponents (e.g. Graham, Greenblatt & Carlisle) are not arguing that any given filter (EV to EBIDTA for instance) accurately measures the intrinsic value of a given company. Agreed
But rather they argue that some filters (or combinations of filters) can capture mis-pricings in a basket of stocks. Agreed
And on average, over time the captured mis-pricings will deliver a return that dramatically exceeds the index and all but the most exceptional stock-pickers. Agreed. “Experts” may even degrade the results of a quant model!
So while a given filter (EV to EBITDA for instance) may be just the beginning of the analysis for a stock-picker working a concentrated portfolio,
that same filter alone may be enough for a Quant Value portfolio to outperform 99%+ of stock-pickers,
and with far less work.
To the extent this finding is true and replicable in real time, it is a remarkable finding. What puzzles me is this:
Given a huge economic opportunity–some screens deliver 2X market returns in back tests
Given the Quant Value idea has been around for 75+ years–since Graham described the Net Net idea in Security Analysis
And given the vast resources dedicated to optimizing portfolios
Why are there so few examples of this simple idea being executed effectively in real time?
The best answers I’ve heard to this question (most of which were mentioned by Greenblatt in TLBTBTM) are:
Quant Value strategies are difficult to stick with because they will under-perform the market for years at a time
Much of the excess return is found in small cap stocks so it cannot be run in a large portfolio
The stocks selected by the Quant Value screens are “ugly” stocks which are difficult to own and defend
While all these explanations make sense, it still appears to me that the lure of 2X market returns would be enough to overcome them. So I am left with the puzzle: why is this opportunity not more widely exploited? I would be interested to hear any thoughts from the group on this…
I will post tomorrow my thoughts on your other questions.
Imagine diligently watching those stocks each day as they do worse than the market average over the course of many months or even years….The magic formula portfolio fared poorly relative to the market average in five out of every 12 months tested. For full-year period…failed to beat the market average once every four years. Joel Greenblatt discusses the role that loss aversion plays in deterring investors from following his ‘magic formula’. (Montier)
A Summary
Greenblatt reinterpreted Buffett’s return on equity capital measure as RETURN ON CAPITAL, which he construed as the ratio of pre-tax operating earnings (earnings before interest and taxes, or EBIT or EBITDA-MCX or operating earnings that are sustainable) to tangible capital employed in the business (Net Working Capital + Net Fixed Assets) defined as:
Return on Capital = EBIT divided by (Net Working Capital (NWC) + Net Fixed Assets)
The use of EBIT makes the return on capital ratio comparable across different capital structures. EBIT makes an apples-to-apples comparison possible.
For tangible capital Greenblatt uses NWC + Net Fixed Assets rather than total assets to determine the amount of capital each company actually requires to conduct its business.
The higher the return on capital ratio, the more wonderful the company.
To determine a fair price, Greenblatt uses earnings yield, which he defines as follows:
Earnings Yield = EBIT divided by Enterprise Value (EV).
EV gives a more full picture of the actual price an acquirer must pay than market capitalization alone. EBIT is agnostic to capital structure so we can compare companies on a like-for-like basis.
The higher operating earnings are in relation to enterprise value, the higher the earning yield, and the better the value.
Greenblatt has quantified Buffett’s wonderful company at a fair price strategy.
Enterprise Multiple (EV) = EBITDA divided by EV or (EBITDA – Maintenance Capital Expenditures) divided by EV.
BEWARE!
The EV to EBITDA ratio is useless without a discussion on asset lives, capital intensity, technological progress or revenue recognition.
EBITDA, or any of its derivatives (EBDIT, EBITDAR, etc.) is simply a crude measure of gross cash flow.
The gross cash flow margin is simply a measure of the capital intensity of the business. A manufacturing business will have a significantly higher gross cash margin than, say, a retailer, because it needs to pay for the capital (via in the accounting sense the depreciation charge) of all its plant and equipment which consumes more of it than a superstore.
What matters is not gross cash flow but net of free cash flow, which is the amount of cash available after reinvestment.
Case Study:
In the heyday of the technology bubble, the EV to EBITDA ratio was a favorite among telecom analysts. Sadly, as new entrants came into the system and pushed up the price of the UMTS licenses (the third generation of mobile networks) to insane levels, the cost of replacement went sky-rocketing; expected free cash flow plummeted, and the telecom shares got more and more ‘attractive’ on an EBITDA basis, which could not capture any of this. Eventually, some went bankrupt, some had to undergo a debt rescheduling exercise or issue new capital, and all saw their share price collapse.
James Murray Wells, a 21-year-old law student in Bristol, UK, needed a pair of glasses, and was faced with a bill of 150 stg. He found that the manufacturing cost off standard spectacles (frame and glasses) was less than 10 stg. This prompted Mr. Murray Wells to set up an Internet-based company to challenge what he claimed was a lack of price competition among the four major high street opticians in England. Three months into his venture, he was selling hundreds of pairs for as little as 15 stg to apparently delighted customers.
The replacement value of the asset, ‘making spectacles and selling them’ is rather low. A 21-year old student with no expertise in the field is apparently able to replicate it from his student room, with a few thousand pounds borrowed from his father. On the other hand, the market value is enormous because, as previously discussed, it equals the net present value of free cash flow discounted to infinity.
The market value is a direct function of the economic profitability of the asset in question and, in this example with a cost of goods sold at 10 and sales at $150, it is plain that economic value added is truly staggering. Making spectacles and selling them has a high ROIC, and an equally impressive asset multiple—the ratio of market value to the replacement value of invested capital.
If the entrepreneur is successful in his venture, he will collapse the marginal return on capital invested of the industry by accepting a lower margin than his competitors. The entrepreneur made an arbitrage between the market value of existing capacity and the replacement value of new capacity, which he found cheaper to create.
Investors in incumbent firms my find out that they have paid too much for the economic value of their asset in the belief that a very high economic return on capital invested was sustainable. Investors who ignore the workings of the capital cycle, the ultimate driver of share prices, do so to their disadvantage.
Investment should just be a replication of the process of arbitrage between market value and replacement value. Good stock pickers are brilliant strategy analysts. They understand the business case for the company. (TATOO that to your forehead!)
—
Questions:
Why is the EV so good at identifying undervalued stocks?
What drives the returns of the magic formula? What Metric? What does this mean for us as Deep Value Investors?
Assuming you read the entire chapter, what two main points about investing did you learn? Anything surprise you?
Supplementary Readings:
What Has Worked in Investing by Tweedy Browne Why do low price-to-book, low price to cash flows, etc tend to generate higher returns than a market average? What is the principle behind the returns? Also, note the Richard Thaler link below for a hint.
When an investor turns to the research on regression to the mean and investors overreacting to poor company performance/bad news in Richard Thaler research, he or she sees that prices of the winner and loser portfolios take three-to-seven years to revert. See also The New Finance: The Case Against Efficient Markets by Robert A. Haugen and Inefficient Markets by Andrei Schleifer.
Thanks for all the comments. A student from Germany kindly offered to host a discussion board for anybody who wants to analyze investment ideas, cases and/or investment subjects in more detail. The infamous Dr. K has also offered to moderate the board. If he upsets too many people, I will referee. As long as differing views are respected then we will be fine.
My overall goals for this course are to study deep value investing while encouraging independent and skeptical thinking. We will try to read original sources and apply principles to our own situations.
I don’t “like” deep value investing or mechanical investing but I was curious why investing in business disasters is so profitable (Preface in Deep Value). I also find it odd at first glance that Ben Graham the father of detailed security analysis gravitated to rule-based (my substitute for “mechanical”) investing. Joel Greenblatt who was the master of special situation, heavily concentrated investing also moved towards the “magic formula” style of investing. Another great investor I know used to visit companies and be highly concentrated into 8 or so businesses. Now he buys a diversified group of STABLE franchises when they go on sale. He also has a rules-based valuation method. What is going on?
Also, as more time passes, you realize that our human flaws are tough to overcome. Toby in Deep Value mentions that experts often DEGRADE mechanical systems. In other words, human tendencies hurt investment performance. Perhaps “mechanical” investing is worth exploring further without preconceived notions.
I often feel investing is like this situation:
Killing a child is wrong. Those soldiers acted, but then the unexpected happened. What now? Morally you know what is right but can you face the consequences?
It isn’t hard to find cheap companies in this pile (but many worth $0), but there is every reason not to act. Can you endure the ridicule?
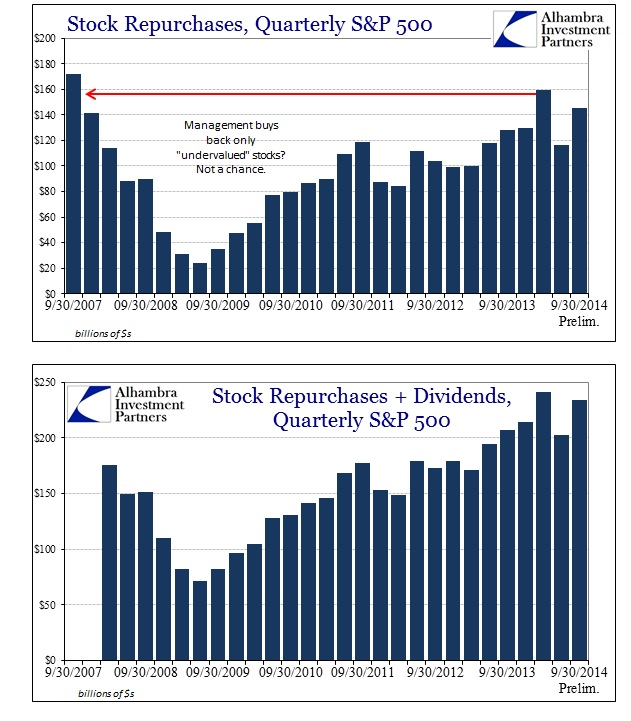
Gold mining is a tough business–when wasn’t it a bad business? Managements are bad (true, but note how US tech firms are buying back stocks near their all-time highs—their managements are no better than the miners yet their stock prices are stratospheric), and on and on.
Altucher writes of Buffett’s early career. Even in the 1990’s Buffett was buying net/nets and companies in Korea trading at 2 to 3xs earnings.
So I chose Deep Value as a guide/textbook to pursue these topics with this group.
The direction of the course will be easy to follow:
We will go chapter-by-chapter in DEEP VALUE by Toby Carlisle while reading the footnotes and original sources as best we can. Let’s understand terms in the book like enterprise value and EBITDA, for example, before moving on to the next chapter.
We just finished Chapter 3, Warren Buffett: Liquidator to Operator where we had the case study of See’s Candies. Buffett moved from investing in deeply discounted tangible assets like Dempster Mills to a franchise like See’s Candies. Buffett was willing to pay a premium over book value because the assets of the business generated returns far in excess of its cost of capital. See’s takes commodities like sugar, milk and chocolate and turns them into boxed chocolates that customers are happy to pay a premium for. Why? The company has a brand built through the customer’s experiences with the product. As a deep value guy, I gave a second-hand box of chocolates to my EX. I said, “Here, ignore the half-eaten chocolates, the rest look OK. I got this on a 95% off sale!” Tense!
So what can WE learn from the case that we can apply in our investments? So rather than try to be like Buffett let’s take his principles and find applications which we can apply going forward. Why is See’s a great business? Taking commodities and turning them into a product that consumers pay a premium for seems like a business to buy. Note that Bicardi was the best business in Cuba and still is going strong. Bicardi takes sugar and water and turns it into premium Rum. I see similarities—brand name built upon quality and good distribution within its geographical boundaries. See’s is strong in southern California, for example. Perhaps, Sherwin-Williams is a bit like See’s Candies. People are willing to pay a premium for paint because 98% of the cost of a painting job is the labor while you want the job to last and look good. Good distribution coupled with service (color tinting/application advice) is also critical. I could go on but the point is to take the general concepts and apply them in your own way. Don’t be Buffett, but be yourself in applying Buffett’s lessons.
Chapter 4: The Acquirer’s Multiple: Fair Companies at Wonderful Prices in Deep Value
I have recently received many suggestions to improve this course. There are almost 600 people in our group with many different backgrounds and experiences. There may be advanced students who wish to discuss current case studies (Why is DLX, Deluxe, not a value trap like Radio Shack?) or potential investments or subjects into greater depth. This course planned to follow Deep Value (book) while digging deeper into the footnotes without preconceived notions. If, for example, we read about Buffett’s transition from net/nets to franchises, we will look at franchises but not focus on them. The point is to give students background to understand the distinctions. However, this may be too basic for many of you.
My goal is to make this a learning community. One idea would be to set up another blog (volunteers?) to discuss various ideas if there is enough interest. I won’t give out anybody’s email without their permission, but if a group of students wanted to dig deeper into various subjects, I am happy to provide a link to this new group or discussion area. I will wait until I hear your feedback.
For example, a reader/student went into vast effort to provide feedback and suggestions. Dr. K (my nickname for this reader) might be an excellent leader to develop a new discussion blog? Below are Dr. K’s emails and links. I will post your suggestions.
EMAIL 1
John; This is Dr. K following up from our phone conversation. So far I am very frustrated with the deep value course and in the following series of emails I will explain why.
Why I hate mechanical investing and problems with back-testing
First of all Seth Klarman in his book (Intro xvi, p.13, p.16-18, p.151, p.162) discusses the folly of searching for the holy grail “mechanical” formula for investing success. BG in The Intelligent Investor p.38-46 and p.194-195 also says mechanical formula investing is self-defeating. It contradictory that we are reading about mechanical formula (Toby Carlisle’s books). Mechanical formula (Toby Carlisle and Joel Greenblatt’s 2nd book) come off as lazy, naïve, and immature to me.
Seth also is not a fan of Wide Moats (see p.32-34, p.93) but I guess that’s OK but it’s very confusing how we are jumping around from one investment ideology to another!! Seth also does not think much of EBITA (see p.71-78) while you seem to mention it on the front of your blog home page in a link at the top.
Now go to http://falkenblog.blogspot.com and read as many past articles as you can. You should also get his first book: “Finding Alpha.” There is no need to read the rest of his books. In that book especially key in on p.115-116 “Geometric vs. Arithmetic Averaging”, p.116-117 “Survivorship Bias”, Ch. 6 p. 113-125 “Is the Equity Risk Premium Zero?” especially read p.121-123 “Transaction Costs” , p.47 “the Size Effect” and p.48 “Delisting bias.” These are just some of the many reasons why mechanical back testing is a dead-end path to investing success.
And/or you can go to http://www.efalken.com and watch the Finding Alpha videos. This should take 8 hours but it’s good if you are short on time or you can do both. I also have many of the papers he has written or mentioned. I can send them to you upon request.
Next go to www.davidhbailey.com.Click on the Mathematical Investor blog and read all of the articles. Now see that attached papers he wrote along with Campbell Harvey.
Go to www.numeraire.com and read all of the links at the top. In the search site map section click on the article about why screening is not valuation.
Now go to www.numeraire.com/download.htm . Read every article in the Research Related Letter section. These are short but notice whom he is critical of. Now read all of the articles in the Research Notes section. Especially read “What is Circular Reasoning” which will explain why most stock screens and mechanical formulas (Toby Carlisle, Joel Greenblatt) are garbage! Make sure you click on or go to all of the links in this article. Notice the lists of various forms of logical errors. Notice the cross correlation with behavioral finance! These logical error list need to be studied in greater detail!! Also especially read “What is Economic Simultaneity?”, “A History of the Size Effect” and notice that on p.4-5 he lists some of the variables that are and are not circular!!, “Evolution of Stock Picking”, “Visual Detection of Circular Reasoning” (it’s vital you understand this) and finally “Fatal Summary.” (it’s vital you understand this also) Read all of the articles in Research Presentations and in Research papers (especially “Circling the Square” and notice on p.8 he gives the return formula and it’s vital you understand this).
You should a somewhat better idea of why mechanical investing is not scientific. You should not trust academic research as well as a lot of p-side research! I am not impressed with Toby Carlisle and Joel Greenblatt’s second book. I have a good feeling that many people in this course and google group are more advanced then you are aware of and feel the same way. I can tell you that I have been reading many academic papers over the years and would attach them when I tried to apply for a research job and never got any positive feedback from attaching them!! In addition Alpha Titans such as Seth Klarman, Peter Lynch, Warren Buffett, Ben Graham were not fan of this type of investing approach.
Let me know when you have read this stuff. I think you need to read and understand them otherwise you are not fully grasping how difficult value investing really is!! Keep in mind I don’t fully understand everything in this material but I know enough to not be impressed by mechanical investing research garbage studies!!
You mentioned www.oldschoolvalue.comon your site in the resource section. I like this site for the free screens and the blog articles which do a good job of teaching quality investment theory. I am not too fond of his software program and he raised the price and his spreadsheets do not include critical off-balance sheet accounting adjustments (I will explain the New Constructs platform in a later email). Jae Jun thinks his spreadsheet program is better than it really is. (in my opinion).
Go to the -VeEV, NNWC and NCAV screens. Some of the stocks duplicate themselves. Now go to Ben Graham Net Net Stocks and a 7 Step Checklist to Make Money with Net Nets . Notice on p.7 Jae says 99% of Net Nets are useless and on p.9 he does not like Chinese ADRs. I think he also does no include financial companies, REITs, CEFs, Shells etc.
Now go to www.grahaminvestor.com.In the screens link at the top go to the NCAV Stocks (Shares Outstanding) screen. Notice it does include Shell companies and Chinese ADRs but only companies listed in the USA. (no Japanese, Canada, Australia, etc.) The next screen is NCAV Stocks (Float). I am not sure what the advantage of this screen is. It only seems to leverage the Current ratio. I have never seen anyone else mention using Float instead of Shares Outstanding instead. This site also gives: NCAV Stocks (Shares Outstanding, new) and NCAV Stocks (Shares Outstanding, new, no Chinese). I sent an email to the people that run this site about the screens but they never got back to me. I would not blindly trust that these companies are true Net Nets. You should verify the numbers yourself.
Go to http://www.netnethunter.com/my-ncav-investment-scorecard/. Does this guy give you the impression that he is a fan of running a mechanical screen and blindly following it?? Notice that he does analysis on the company’s “Burn rate.” Where did Toby Carlisle mention this?? Make sure you read all of the articles.
Now for the subscription. He does screens for Japan, Australia, Canada. The Japanese financials he gets are written in Japanese and gets the aggregated data from Business week.
A good assignment would be to figure out where for free or how you can screen for Japan, Australia, Canada or anywhere else other than the USA. Given the above two mentioned sites we could also for a day analyze (or for a week) every company of the list in greater detail and not do stupid mechanical investing like it has been suggested so far!!
I think I read that www.gurufocus.com has some Net-Net screens for a subscription rate but I don’t know if they are any good or not.
Another reason why Net Net studies and papers are flawed is that they don’t account for Survivorship bias and delisting bias in the historical database the study was conducted from. It’s quite possible that a company could be a “quality Net-Net” from financial standpoint but if the trading volume is too low then the NYSE could delist the company and then the stock loses 90% of its value as it goes from being a listed company to an unlisted (or OTC) company. Most of the deep value research does not discuss how to account for this and how to follow and trade these OTC companies!!
Here is email #3 about Wide Moat Investing.
You mentioned Pat Dorsey and his books. (see The Five Rules for Successful Stock Investing and The Little Book that Builds Wealth).
I met Pat Dorsey at a CFA Rochester, NY meeting while he was working for Morningstar. Morningstar has The Stock Investor newsletter which gives coverage of about 150 companies Morningstar believes are “Wide Moat” companies.
You mentioned Bruce Greenwald’s book and presentations about this subject.
The assignment here is using these various books, articles and presentations someone subscribe to Morningstar’s Stock Investor newsletter, tell us the list of the 150 companies Morningstar list for “Wide Moats.” Then once we have this list we all go through each company and analyze and verify why these companies are indeed “Wide Moat” companies. In a presentation that you posted recently by WB he mentioned that there are no “Wide Moat” companies in Japan. I suppose we could locate “Wide Moat” companies in countries outside of the USA.
—–
This is email #4 about Special Situation investing. You mentioned Seth Klarman’s book. In the second half of that book he gives various “Special Situation” opportunities. Joel Greenblatt’s first book also was pretty good (but now a little out of date while his second book was a bunch of mechanical garbage).
c. You mentioned www.distressed-debt-investing.com in your resource section on your blog. Someone also attached Stephen Moyer’s book about Distressed Debt investing. My advice here would be to stay far away from this area of investing until the investor has more experience under your belt in analyzing distresses equities first. That website and book is very complicated as it requires specialized knowledge of Bankruptcy law, Quant Credit Modeling and simulation. You should not really list this site on your blog unless you make it clear to people this area of investing is not for beginners! It’s for advanced investors!!!!!!!!!!!!!!!! These resources are not written in a way that is easy to learn or read!!
d. There are many sites on the web for following the Insiders. I think I read that www.gurufocus.com gives you coverage of Insiders. Many sites are for free. The absolute best book on Insider Buying is “Investment Intelligence from Insider Trading” by H.Nejat Seyhun. It should be noted that Seyhun’s database goes all the way back to 1975 while I have yet to see any website that goes back that far for a affordable price.
Now here is what I think is going on with Spinoffs. Suppose you have XYZ company with a consolidated financial statement consisting of three divisions: Division A, Division B, Division C. So Consolidated XYZ = [A + B + C]. Now suppose Division B will be Spunoff. Now we have two companies: Parent Company = [A + C] and the Spunoff Company = [B]. I think what is going on here is that when this proposal takes place it won’t occur for a 90 day period so therefore their is a 90 day period where these two companies’ financial statements won’t be in the various databases. Instead Consolidated XYZ = [A + B + C] will still be in the database. I THINK WHAT YOU NEED TO DO IS RECONSTRUCT THE FINANCIAL STATEMENTS SUCH THAT YOU CAN ANALYZE PARENT COMPANY = [A + C] AND SPUN COMPANY = [B] AS TWO SEPERATE COMPANIES. DO NOT ASSUME AS MECHICANICAL INVESTORS DO THAT THE SPUNOFF COMPANY IS THE GOOD DEAL AND THE PARENT COMPANY IS THE BAD DEAL. EVEN IN JOEL GREENBLATT’S FIRST BOOK SOMETIMES THE PARENT COMPANY IS WHAT HE PURCHASED AND SOMETHIMES THE SPUN OMPANY WAS THE BETTER DEAL. I think Joel did an OK of explaining what was going on in his first book but he was not always clear about the timeline of events for how to follow a typical Spinoff situation.
As for the various other types of Special Situations (except for Merge Arb) their is almost no analysis or coverage on how to follow these events!!
Email #5 about “Expectations Investing.”
Go to www.expectationsinvesting.com. Make sure you read “Expectations Investing (2000)” by Alfred Rappaport and Mchael J. Mauboussin and “Creating Shareholder Value (1998)” by Alfred Rappaport. THESE ARE THE ABSOLUTE TWO BEST BOOKS I HAVE READ THAT CLEARLY EXPLAINED WHY CONVENTIONAL ACCOUNTING IS FLAWED AND THE DIFFERENCE BETWEEN ACCOUNTING VALUE AND ECONOMIC VALUE CREATION!! I can’t go into two much detail here but make sure you read and understand every Tutorial on the site!! In a recent post your blog about Enron I think you were trying to highlight the concept of Incremental Capital expenditure. This and Incremental Working Capital expenditure are clearly taught in these two books. These books also do a wonderful job of explaining the underlying drivers of Economic Value creation! You want to understand these spreadsheets in detail!
The assignment here is that New Constructs (See links below) does about 22 various off-balance sheet adjustments. Learn these adjustments and modify the Expectation Investing sample spreadsheets. Know how to do this for companies that New Constructs does not cover. (such as REITs, MLPs, Net Nets, Special Situations, Japan and non-USA stocks). In the case of non-USA companies the accounting conventions would need to be researched.
I think these spreadsheets do such a good teaching job of explaining things!!
(Not posted here-I couldn’t open the zip file)
Michael’s 2nd book “More then you know” and his 3rd book “Think Twice” are gems that do a good job of summarizing what is going on in behavioral finance and must be read. I have many of the papers he mentioned from these books.
David Iben is a deep value investor currently focused on highly cyclical industries like coal, uranium, and gold mining. He has a mandate to go anywhere to invest in big or small companies. He seeks out value. The world is now bifurcated between a highly valued U.S. stock market and the cheaper emerging markets. Social media and Biotech stocks trade at rich valuations while depressed cyclical resource companies languish.
VALUATION
Value to us is a pre-requisite and thus we never pay more than a company’s estimated risk-adjusted intrinsic value. But, failing to think deeply and independently about what constitutes value and how best to derive it, can be harmful. Following in the footsteps of growth investors who had allowed themselves to become too formulaic or put in a box in the late 90s, some value investors were hurt by overly restrictive definitions of value in 2007 and 2008 (Price/Book and Price/Earnings, etc). We find it valuable to use many valuation metrics. Additionally, emphasis is placed on those metrics that are most appropriate to a certain industry. For example, asset heavy and/or cyclical companies often are tough to appraise using Price/Earnings or Price-to-Cash Flow. Price to book value, liquidation value, replacement value, land value, etc. usually prove helpful. These metrics often are not helpful for asset light companies, where Discounted Cash Flow scenario analysis is more useful. Applying these metrics across industries, countries, and regions helps illuminate mispricing. Looking at different industries through different lenses, through focused lenses, using industry appropriate metrics and qualitative factors is important. Barriers to entry are an important factor. Potential winners possess different key attributes. Supply and demand are extremely important detriments of margin sustainability. The investor herd has a strong tendency to use trend line analysis, assuming that past growth will lead to future growth. A more reasoned, independent assessment will often foretell margin collapses as industries overdo it, thereby sowing the seeds of their own self-destruction.
Currently, opportunities are being created when the establishment pays too little heed to supply growth. This fallacy extends to money. Many seem to believe that the Federal Reserve has succeeded in quintupling the supply of dollars without a loss of intrinsic value. That is impossible. Evidence of the loss of value is abundantly clear. Gold supply held by the U. S. Treasury has not increased. As economic theory would predict, the price of gold went up. Following 12 straight years of advance and apparently overshooting, the price has since corrected 40%. The trend followers have their rulers out again, confusing a correction in a supply/demand induced uptrend with a new counter-trend.
We view this as opportunity. At the same time, bonds are priced as if they were scarce rather than too abundant to be managed. It is no secret that this is due to open, market manipulation by the central banks. Intrinsic value must eventually be reflected in market prices. These are abnormally challenging times. Fortunately, we believe markets aren’t fully efficient.
—
If you listen to his conference calls and read his insights, you will have a great education in counter-cyclical investing. It is easy to know what to do but hard to do!
I will be asking for your suggestions for the deep value course. I am collating one reader’s suggestions which I will post next. Some of you may be quite experienced and advanced investors who tire of the theoretical course materials as well as the mechanical aspect of quantitative investing. We will discuss this next………….Thanks for your patience.