Category Archives: Valuation Techniques

No Price Discovery Then No Markets; A Reader’s Question

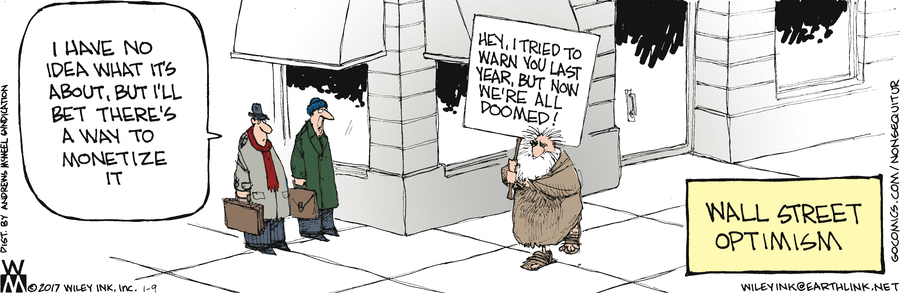
Has the meteoric rise of passive investing generated the “greatest bubble ever”?
The better we understand the baked-in biases of algorithmic investing, the closer we can come to answers.


The following article was originally published in “What I Learned This Week” on June 15, 2017. To learn more about 13D’s investment research, visit website.     https://latest.13d.com/tagged/wiltw

In an article for Bloomberg View last week titled “Why It’s Smart to Worry About ETFs”, Noah Smith wrote the following prescient truth: “No one knows the basic laws that govern asset markets, so there’s a tendency to use new technologies until they fail, then start over.” As we explored in WILTW June 1, 2017, algorithmic accountability has become a rising concern among technologists as we stand at the precipice of the machine-learning age. For more than a decade, blind faith in the impartiality of math has suppressed proper accounting for the inevitable biases and vulnerabilities baked into the algorithms that dominate the Digital Age. In no sector could this faith prove more costly than finance.

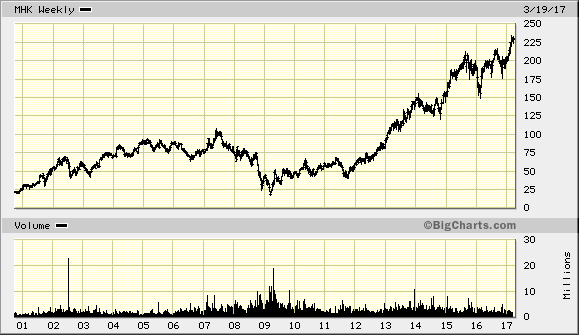
The rise of passive investing has been well-reported, yet the statistics remain staggering. According to Bloomberg, Vanguard saw net inflows of $2 billion per day during the first quarter of this year. According to The Wall Street Journal, quantitative hedge funds are now responsible for 27% of all U.S. stock trades by investors, up from 14% in 2013. Based on a recent Bernstein Research prediction, 50% of all assets under management in the U.S. will be passively managed by early 2018.

In these pages, we have time and again expressed concern about the potential distortions passive investing is creating. Today, evidence is everywhere in the U.S. economy — record low volatility despite a news cycle defined by turbulence; a stock market controlled by extreme top-heaviness; and many no-growth companies seeing ever-increasing valuation divergences. As always, the key questions are when will passive strategies backfire, what will prove the trigger, and how can we mitigate the damage to our portfolios? The better we understand the baked-in biases of algorithmic investing, the closer we can come to answers.

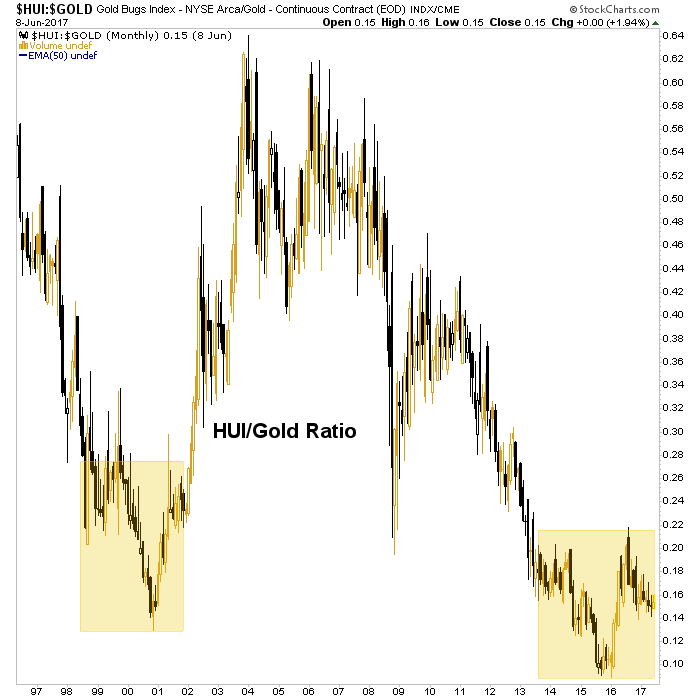
Over the last year, few have sounded the passive alarm as loudly as Steven Bregman, co-founder of investment advisor Horizon Kinetics. He believes record ETF inflows have generated “the greatest bubble ever” — “a massive systemic risk to which everyone who believes they are well-diversified in the conventional sense are now exposed.”

Bregman explained his rationale in a speech at a Grant’s conference in October:
“In the past two years, the most outstanding mutual fund and holding- company managers of the past couple of decades, each with different styles, with limited overlap in their portfolios, collectively and simultaneously underperformed the S&P 500…There is no precedent for this. It’s never happened before. It is important to understand why. Is it really because they invested poorly? In other words, were they the anomaly for underperforming — and is it reasonable to believe that they all lost their touch at the same time, they all got stupid together? Or was it the S&P 500 that was the anomaly for outperforming? One part of the answer we know… If active managers behave in a dysfunctional manner, it will eventually be reflected in underperformance relative to their benchmark, and they can be dismissed. If the passive investors behave dysfunctionally, by definition this cannot be reflected in underperformance, since the indices are the benchmark.”

At the heart of passive “dysfunction” are two key algorithmic biases: the marginalization of price discovery and the herd effect. Because shares are not bought individually, ETFs neglect company-by-company due diligence. This is not a problem when active managers can serve as a counterbalance. However, the more capital that floods into ETFs, the less power active managers possess to force algorithmic realignments. In fact, active managers are incentivized to join the herd—they underperform if they challenge ETF movements based on price discovery. This allows the herd to crowd assets and escalate their power without accountability to fundamentals.

With Exxon as his example, Bregman puts the crisis of price discovery in a real- world context:

“Aside from being 25% of the iShares U.S. Energy ETF, 22% of the Vanguard Energy ETF, and so forth, Exxon is simultaneously a Dividend Growth stock and a Deep Value stock. It is in the USA Quality Factor ETF and in the Weak Dollar U.S. Equity ETF. Get this: It’s both a Momentum Tilt stock and a Low Volatility stock. It sounds like a vaudeville act…Say in 2013, on a bench in a train station, you came upon a page torn from an ExxonMobil financial statement that a time traveler from 2016 had inadvertently left behind. There it is before you: detailed, factual knowledge of Exxon’s results three years into the future. You’d know everything except, like a morality fable, the stock price: oil prices down 50%, revenue down 46%, earnings down 75%, the dividend-payout ratio almost 3x earnings. If you shorted, you would have lost money…There is no factor in the algorithm for valuation. No analyst at the ETF organizer—or at the Pension Fund that might be investing—is concerned about it; it’s not in the job description. There is, really, no price discovery. And if there’s no price discovery, is there really a market?”


We see a similar dynamic at play with quants. Competitive advantage comes from finding data points and correlations that give an edge. However, incomplete or esoteric data can mislead algorithms. So the pool of valuable insights is self-limiting. Meaning, the more money quants manage, the more the same inputs and formulas are utilized, crowding certain assets. This dynamic is what caused the “quant meltdown” of 2007. Since, quants have become more sophisticated as they integrate machine learning, yet the risk of overusing algorithmic strategies remains.

Writing about the bubble-threat quants pose, Wolf Street’s Wolf Richter pinpoints the herd problem:

“It seems algos are programmed with a bias to buy. Individual stocks have risen to ludicrous levels that leave rational humans scratching their heads. But since everything always goes up, and even small dips are big buying opportunities for these algos, machine learning teaches algos precisely that, and it becomes a self-propagating machine, until something trips a limit somewhere.”

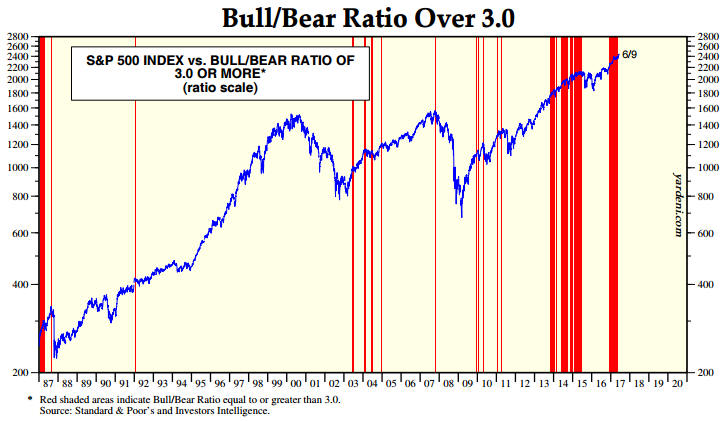
As Richter suggests, there’s a flip side to the self-propagating coin. If algorithms have a bias to buy, they can also have a bias to sell. As we explored in WILTW February 11, 2016, we are concerned about how passive strategies will react to a severe market shock. If a key sector failure, a geopolitical crisis, or even an unknown, “black box” bias pulls an algorithmic risk trigger, will the herd run all at once? With such a concentrated market, an increasing amount of assets in weak hands have the power to create a devastating “sell” cascade—a risk tech giant stocks demonstrated over the past week.

With leverage on the rise, the potential for a “sell” cascade appears particularly threatening. Quant algorithms are designed to read market tranquility as a buy-sign for risky assets—another bias of concern. Currently, this is pushing leverage higher. As reported by The Financial Times, Morgan Stanley calculates that equity exposure of risk parity funds is now at its highest level since its records began in 1999.

This risk is compounded by the ETF transparency-problem. Because assets are bundled, it may take dangerously long to identify a toxic asset. And once toxicity is identified, the average investor may not be able to differentiate between healthy and infected ETFs. (A similar problem exacerbated market volatility during the subprime mortgage crisis a decade ago.) As Noah Smith writes, this could create a liquidity crisis: “Liquidity in the ETF market might suddenly dry up, as everyone tries to figure out which ETFs have lots of junk and which ones don’t.”

J.P. Morgan estimated this week that passive and quantitative investors now account for 60% of equity assets, which compares to less than 30% a decade ago. Moreover, they estimate that only 10% of trading volumes now originate from fundamental discretionary traders. This unprecedented rate of change no doubt opens the door to unaccountability, miscalculation and in turn, unforeseen consequence. We will continue to track developments closely as we try and pinpoint tipping points and safe havens. As we’ve discussed time and again with algorithms, advancement and transparency are most-often opposing forces. If we don’t pry open the passive black box, we will miss the biases hidden within. And given the power passive strategies have rapidly accrued, perpetuating blind faith could prove devastating.

The Greatest Bubble Ever 13D Research   (Sign-up for their updates!)

A Reader’s question that I post below so the many intelligent folks that read this can chip in their thoughts….

The part that confuses me the most is this:

From what I gather, Greenblatt typically calculates his measurement of normal EBITDA – MCX. He then puts a conservative multiple on this, typically 8 or 10 times EBITDA-MCX. He says higher quality companies may deserve 12x or more. He often says something like “this is a 10% cash return that is growing at 6% a year. A growing income is worth much more than a flat income”. He seems to do this on page 309-310 of the notes you sent me  complete-notes-on-special-sit-class-joel-greenblatt_2.

My question is: Greenblatt’s calculation of earnings (EBITDA – MCX) only includes the maintenance portion of capital expenditure. The actual cash flow may be lower because of growth capex. Yet he is assuming a 6% growing income. It seems strange to me that he calculates the steady-state income (no growth capex. Only Maintenance capex), but he assumes that the income will grow. It seems like he is assuming the income will grow 6% but doesn’t incude the growth capex in his earnings calculation. Is it logical to assume that the steady-state earnings will grow, but not deducting the cost of the growth capex from the earnings? 

Answer/reply?………….


Finding Good Capital Allocators; The Problems with Using Sentiment

Finding good capital allocators

Strategic Presentation May 2017b    What would show you that this management team allocates capital well in their resource sector?   Are their actions EXTREMELY rare in the Junior Resource Mining industry?

The Perils of Using Sentiment As a Timing Tool

The limitations of sentiment, revisited

June 12, 2017

In a blog post in March of this year I discussed the limitations of sentiment as a market timing tool. I wrote that while it can be helpful to track the public’s sentiment and use it as a contrary indicator, there are three potential pitfalls associated with using sentiment to guide buying/selling decisions. Here are the pitfalls again:

The first is linked to the reality that sentiment generally follows price, which makes it a near certainty that the overall mood will be at an optimistic extreme near an important price top and a pessimistic extreme near an important price bottom. The problem is that while an important price extreme will always be associated with a sentiment extreme, a sentiment extreme doesn’t necessarily imply an important price extreme.

The second potential pitfall is that what constitutes a sentiment extreme will vary over time, meaning that there are no absolute benchmarks. Of particular relevance, what constitutes dangerous optimism in a bear market will often not be a problem in a bull market and what constitutes extreme fear/pessimism in a bull market will often not signal a good buying opportunity in a bear market.

The third relates to the fact that regardless of what sentiment surveys say, there will always be a lot of bears and a lot of bulls in any financial market. It must be this way otherwise there would be no trading and the market would cease to function. As a consequence, if a survey shows that almost all traders are bullish or that almost all traders are bearish then the survey must be dealing with only a small — and possibly not representative — segment of the overall market.

I went on to write that there was no better example of sentiment’s limitations as a market timing indicator than the US stock market’s performance over the past few years. To illustrate I included a chart from Yardeni.com showing the performance of the S&P500 Index (SPX) over the past 30 years with vertical red lines to indicate the weeks when the Investors Intelligence (II) Bull/Bear ratio was at least 3.0 (a bull/bear ratio of 3 or more suggests extreme optimism within the surveyed group). An updated version of the same chart is displayed below.

The chart shows that while vertical red lines (indicating extreme optimism) coincided with most of the important price tops (the 2000 top being a big exception), there were plenty of times when a vertical red line did not coincide with an important price top. It also shows that optimism was extreme almost continuously from Q4-2013 to mid-2015 and that following a correction the optimistic extreme had returned by late-2016.

Sentiment was at an optimistic extreme late last year, at an optimistic extreme when I presented the earlier version of the following chart in March and is still at an optimistic extreme. In effect, sentiment has been consistent with a bull market top for the bulk of the past four years, but there is still no evidence in the price action that the bull market has ended.

Regardless of what happens from here, four years is a long time for a contrarian to be wrong.   See more at http://www.tsi-blog.com

Lesson? Always place data into context and do not rely on any one piece of information.   Sentiment can be useful as part of an over-all picture of a market or company.

Here is an example of an investor who applies that principle in his OWN method of investing. https://www.thefelderreport.com/2017/05/31/how-a-funny-mentalist-learned-to-avoid-annihilation/

He gained INSPIRATION from his investing heroes but did not try to mimic them.

This analyst of gold doesn’t just use news and sentiment but also fundamentals: https://monetary-metals.com/the-anatomy-of-browns-gold-bottom-report-4-june-2017/

And finally, consider the slow crash: https://mishtalk.com/2017/06/12/buy-the-faangs-baby-slow-torture/#more-46281

Stories and Numbers

I don’t always agree with Dr. Damodaran, but the video can help any analyst writing a research report. You have to link your story to numbers. He mentions that he prefers to teach history majors how to value than teach engineers how to be creative/tell a story with their numbers.

The mistake Prof. Damodaran made on Vale was not normalizing the biggest cyclical boom in iron ore prices in the past five hundred years.

Follow the discussion on valuing UBER.    This is a good exercise for valuing platform/network companies: Damordaran on UBER FiveThirtyEight

See more:

  1. http://pages.stern.nyu.edu/~adamodar/
  2. http://aswathdamodaran.blogspot.co.uk/

Global Warming? https://youtu.be/SXxHfb66ZgM

Core Labs (CLB) So What is It Worth? Is Einhorn Right?

One trick that Warren Buffett uses when he first looks at a company is NOT to look at the price OR another person’s opinion.  He doesn’t want price to influence his valuation of the company, and he seeks his own counsel.

Why don’t we test our valuation skills and do a valuation of Core Labs (CLB) with the data below.

  1. CLB VL 2015
  2. CLB VL 2017
  3. Core Labs CLB 2016_annual_report
  4. CLB 2017_1q_10q

Do your own work BEFORE looking at the post below.  See how you compare or differ Einhorn’s short thesis on CLB.    Do you differ?   Why and how.

 —
Whitney Tilson: CLB and HHC

If someone forwarded you this email and you would like to be added to my email list to receive emails like this one roughly once a week, simply send an email to investors-subscribe@mailer.kasecapital.com. If you wish to unsubscribe, email investors-unsubscribe@mailer.kasecapital.com.

CSInvesting: I suggest subscribing.

——————————-

1) I (Whitney Tilson) attended the always-excellent Ira Sohn conference on Monday and, as often happens, Bill Ackman and David Einhorn stole the show with two outstanding, incredibly-well-researched ideas, long Howard Hughes (which has been one of my largest positions since it was spun out of GGP when it emerged from bankruptcy after the credit crisis) and short Core Laboratories (CLB), respectively.

They have posted their presentations here:

  • HHC
  • CLB   Here is Einhorn’s short thesis on CLB (Core Labs)

If you’re interested in learning more about HHC (and seeing the incredible development underway at South Street Seaport), the company is hosting its first investor day there a week from today, Wed. 5/17 from 8:00am to 1:30pm. Email Tracey.Wynn@howardhughes.com to register. I hope to see you there.

As for CLB, it doesn’t happen very often – maybe once every two years – but sometimes I (Whitney Tilson) see (at a conference) or read (on something like ValueInvestorsClub) an investment thesis that is so compelling and blindingly obvious that I immediately put the position on – which is what I did on Monday just after Einhorn’s presentation. Check it out for yourself – it’s that good. A highly cyclical company masquerading as a secular growth story – trading at nearly 9x REVENUES!


Must see video on indexeshttps://vimeo.com/216016883/10b948b174

I highly suggest you view the video—Yeah, there is hope for value investors.

Hedge Fund Quiz: Economies of Scale

Economies of scale.

If costs per unit decline as volume increases, because fixed costs make up a large share of total costs, then even with the same basic technology, an incumbent firm operating at large scale will enjoy lower costs than its competitors.

Edison Schools IPO’d at $18 per share and now it trades near $14.   Your boss runs in and throws the Edison School’s 2001 annual report on your desk and a top-rated analyst’s report on Edison.   “Get back to me in thirty minutes on what should we do: Buy a boat-load of stock, buy some, buy a little, short or stand aside?”  Your Boss says that management owns a lot of stock along with “smart” money.

You glance at the analyst report:

Greg Capelli, MBA, at Credit Suisse First Boston issued a $30 dollar price target in his fifty-page report.   Capelli says that Edison Schools is extremely undervalued because of “first-mover advantage” and “INCREASING OPERATING LEVERAGE THROUGH ECONOMIES OF SCALE.”

As a refresher you whip out Greenwald’s Competition Demystified:

LOCAL CHAMPIONS

In an increasingly global environment, with lower trade barriers, cheaper transportation, faster flow of information, and relentless competition from both established rivals and newly liberalized economies, it might appear that competitive advantages and barriers to entry will diminish. The fate of once powerful American firms in industries like machine tools (Cincinnati), textiles (Burlington Industries, J. P. Stevens), and even automobiles (Chrysler, GM, and Ford) seems to support this position. Either profits have shrunk or companies have disappeared entirely under the onslaught of imports. But this macro view misses  one essential feature of competitive advantages—that competitive advantages are almost always grounded in what are essentially “local” circumstances.

Consider the history of Wal-Mart, one of the greatest economic success stories of the late twentieth century. The retail business, especially discount retailing, is not an industry with many trade secrets or rare skills. The practices for which Wal-Mart is known, like “everyday low prices” and efficient distribution, are hardly proprietary technologies, impossible for other firms to duplicate. Yet Wal-Mart has successfully dominated many, although not all, of the markets in which it competes. The way in which it achieved this position is instructive.

Wal-Mart began as a small and regionally focused discounter in a part of the country where it had little competition. It expanded incrementally outward from this geographic base, adding new stores and distribution centers at the periphery of its existing territory. The market that it dominated and in which it first enjoyed competitive advantages was not discount retailing in the United States, but discount retailing within a clearly circumscribed region. As it pushed the boundaries of this region outward, it consolidated its position in the newly entered territory before continuing its expansion. As we shall see, when it moved too far beyond its base, its results deteriorated.

An Analyst ALWAYS ASKS:

OK, now you dig in quickly to the Edison Schools AR_2001

What do you say to your boss?  Your comments should be no more than a sentence or two of explanation backed up by a few simple calculations.   Besides the financials, what do you point out in the annual report?   Take no more than twenty minutes.   You go immediately to the important data and disregard the rest.

Address Capelli’s “First Mover Advantage” comment.

Next week, I will post analysis.

AFTER you have answered, you can see the future for investors in Edison:  https://youtu.be/QUYKSWQmkrg

UPDATE 4/17/2017

ETF Insanity is destroying price discovery–opportunity will return.

https://vimeo.com/209940152/f2154e4d3d

Part 1 of this post: http://csinvesting.org/2017/04/20/edison-schools-cs-on-econ-of-scale-part-ii/

An Example of the Analyst Course

It is 2006, and you want to know the true sustainable free cash flow of Mohawk because you love sleepy, mundane industries that are slowly growing. Why? Because people love to buy lottery tickets and glamour so you “go where they ain’t.”

So what is the difference between Mohawk’s GAAP earnings per share and your estimate of FREE CASH FLOW per share?    Use cash flow from operations and maintenance capex (which you need to roughly estimate). Be roughly right, not precisely wrong.

Can you explain the difference?   What is going on with Mohawk and the industry?   Note the ten-bagger or 25% CAGR for almost ten years (move over Buffett) from the 2009 lows.  Surprising or not?    MHK-2006 AR FCF Analysis.   Can you use this as a way to find other ten-baggers?

Of course, the above question is not hard for you since you have already read this 412 page book several times: Wiley Creative Cash Flow Reporting.  You do not have needed to read that book to answer the question. Use common sense and a small bit of accounting knowledge like (amortization of goodwill-hint!)

This an example of how the analyst course would teach. You have to do many case studies to practice learning concepts like free cash flow.  Like flying and sex, you have to practice.

Update: April 11, 2017: The price you pay

If you pay too much even for a great business, then you will have poor returns.

Take the three Value-Lines of Coke (KO).   VL KO and note the $80 + plus price, then track its free cash flow (as calculated by Value-Line which is After-tax earnings plus depreciation + amortization then minus capital expenditures), then earnings.   Track the price and those metrics: KO_VL_Jan 2013 and Ko_VL 2017.   You will see that on average cash flows and earnings and dividends rise from 1998 until 2017, yet returns have been just OK.   Paying too high a price hurts your total returns even with a strong, stable business like Coke. Investors were extremely optimistic over Coke’s growth prospects.  If you held Coke for a long time, your return would equal the company’s long-term return on equity.

Also, Buffett’s non-controlled public investments have generally lagged the S&P 500 Berkshire Hathaway AR 2016.

Good luck.    Those who do not provide the correct answer will have to spend time with my ex-wife:

Fundamentals vs. Technicals, Templeton, Ackman, Analysis of Valeant

Fundamental vs. Technical Analysis

https://monetary-metals.com/technical-vs-fundamental-report-19-mar-2017/

Technical analysis, in all of its forms, uses the past price movements to predict the future price movements. In some cases (e.g. momentum analysis) it calculates an intermediate signal from the price signal (momentum is the first derivative of price). But no matter the style, one analyzes price history to guess the next price move.

This is necessarily probabilistic. There is no way to know that a particular price move will follow the chart pattern you see on the screen. There is no certainty. And when it does work, it is often because of self-fulfilling expectations. Since all traders have access to the same charts, and the same chart-reading theories, they can buy or sell en masse when the chart signals them to do so.

Fundamentals or Arbitrage:

Arbitrage works just like a spring. If the price in the futures market is greater than the price in the spot market, then there is a profit to carry gold—to buy metal in the spot market and sell a futures contract. If the price of spot is higher, then the profit is to be made by decarrying—to sell metal and buy a future.

There are two keys to understanding this. One, when leveraged speculators push up the price of gold futures contracts, then that increases the basis spread. A greater basis is a greater incentive to the arbitrageur to take the trade. Two, when the arbitrageur buys spot and sells a future, the very act of putting on this trade compresses the spread.

If someone were to come along and sell enough futures contracts to push down the price of gold by $50 or $150 or whatever amount is alleged, then this selling would be on futures only. It would push the price of futures below the price of spot, a condition called backwardation.

Backwardation just has not happened at the times when the stories of the big “smash downs” have claimed. Monetary Metals has published intraday basis charts during these events many times.

The above does not describe technical analysis. It describes physics—how the market functions at a mechanical level.

There are other ways to check this. If there was a large naked short position in a contract that was headed into expiry, how would the basis behave? The arbitrage theory predicts the opposite basis move. We will leave the answer out as an exercise for the interested reader, as thinking this through is really good work to understand the dynamics of the gold and silver markets (and you can Google our past articles, where we discuss it).

This check can be observed every month, as either gold or silver has a contract expiring (right now it’s gold, as the April contract is close to First Notice Day).

Templeton

Ackman and Valeant

Ackman and his disasterous investment in Valeant The are many psychological lessons in this article.  What can you learn?

Ironically, one of the best research on Valeant was done by Allergan: Allergan analysis of Valeant 2014.   Did Ackman’s analysts even read it?   At least you have an example of solid research.

Compare to Ira-Sohn-2015-Presentation on Valeant and Other Platform Companies   Studying the two different presentations provides a FREE course on valuation and presenting a research idea.  But not 1 person in 10,000 would be willing to sweat the details like studying the two documents linked above.

Oh well, opportunity for those who work.

A Reader’s Question on DCF


QUESTION:  So the intrinsic value of a company is the present value of all future cash flows?

Now everyone has a different required rate of return or discount rate, so does that mean one person’s intrinsic value of a business will be different from another person (not because of different estimates of future cash flows but because of discount rate)?

CSInvesting: Yes, a pension fund may be fine with a discount rate of 8.5% but you require 15%.

I just want to confirm what it means when in articles, famous investors talk about their investments and they would say for example that they found a business which they think is worth $50 but was trading at $15. Is their estimate of $50 the value they came up with after using their own discount rate, or is it more a comparable analysis of using a discount rate of the industry norm and that’s the value that they come up with.

I don’t know what discount rate they are using, but when you see a company trading at $15 and you think it is worth, then probably your valuation is off.   Markets are not ALWAYS inefficient, but they are usually not GROSSLY inefficient.  Say, you value a miner based on today’s gold price of $1,200 and it trades at triple the price in two years but the gold price trades at $1,600 (US) then a speculative element changed your valuation.


I ask because some say they will buy only if there is a 50% discount to their intrinsic value and would sell around 90-100% of their intrinsic value.  But say for example that you used a discount rate of 20% to get your intrinsic value and it so happens to be selling at 50% discount and you bought it.  Even if price reached 100% of such intrinsic value, basically what that means is going forward for that price, you will be getting 20% returns for holding that investment, which to me is an excellent investment and would hold on and not sell (assuming that the cashflow is certain for the example).


I think you are double counting.   You use 20% discount rate when usually the cost of equity capital is 7% to 11% AND it trades at a 50% discount, then your valuation is probably in fantasy land.

Some go to Prof. Damodaran’s Industry Cost of Capital Spreadsheet


http://people.stern.nyu.edu/adamodar/New_Home_Page/datafile/wacc.htm  But I wouldn’t use it other than to see what most analysts use.
REMEMBER the iron law of CSInvesting.  If you know or do something that everyone else does in the market, then it is probably useless.

DANGER with USING DCFs

STANDARD THINKING

Better:

Chapter 8 Cost-of-Equity-Capital Credit Model by Hackel 

The analysis of risk represents the single most underexplored factor in security research and the primary reason for investor disappointment in their investment returns.

The cost of equity capital, while known as a measure of investors’ attitudes toward risk, more aptly should represent the uncertainty to the cash flows investors can expect to receive from their investment in the security being considered.  Only through n accurate and reliable cost of equity capital can fair value be established as well as the determination of whether management is creating value for shareholders, as measured by the return on invested capital (ROIC) in comparison with its cost.

Because security analysts are not confronted with the daily barrage of problems and hazards that managers and executives working directly for the entity face a wide swath of hidden risks that tends to be ignored or not calibrated properly. Investors need to think and behave like corporate insiders to truly appreciate this multitude of exposures so as to accurately place a cost of capital that takes into account these uncertainties, of which any one could damper cash flows or even threaten the entity’s survival.  On the other hand, if investors were to overweigh such risks, the entity’s valuation multiple would depress, causing misevaluation.

Say the standard tech company has a cost of capital of 9%.  Well, Apple’s might have a lower, 7.6% cost of equity capital, because of the lower operational risk of its business as noted by the cost of its credit.

Use a credit model for the cost of equity capital –See ch. 8: Security Valuation and Risk Analysis by Kenneth Hackel. (in Value Vault)

At least you are garnering a different perspective.    Good questions.

Case Studies on Buffett’s Investing: NYU Course This April

 The Fundamentals of Buffett-Style Investing

Learn the investment techniques of Warren Buffett, the world’s most legendary investor. Examine case studies of Buffett’s acquisitions in order to review the real-world principles that the “Oracle of Omaha” uses to pick companies. Topics include both quantitative methods, such as valuation metrics and cash flow analysis, as well as qualitative principles, such as competitive advantage and economic moats. As a final project, partner with a classmate to present a publicly traded company you believe Buffett would buy. At the conclusion, understand what Buffett means by a “great business at a good price.” This course is appropriate for beginners in the industry and for individuals with a broad array of backgrounds. The final session is taught synchronously from the Berkshire Hathaway annual meeting in Omaha.

More details

You’ll Walk Away with

  • An understanding of the investment techniques of Warren Buffett, the world’s most legendary investor
  • The opportunity to present a publicly traded company you believe Warren Buffett would buy

Ideal for

  • Students with little to no knowledge of investing
  • Professionals across the experience spectrum in regard to investing

READ:

CSInvesting Editor: Let me know if you attend.  Several readers took the class last year and enjoyed it.

I received this email:

Dear Mr. Chew,

You were very kind last year to post a notice about our Buffett investing class on your website.  We had several students from your site, all of whom were excellent and dedicated. According to end-of-semester student surveys, the students enjoyed the class quite a bit. You clearly attract a high caliber of investor to your online community. We would be very grateful if you would consider posting a notice of this year’s class, which starts April 1st.
See below:
New York University’s School of Professional Studies is offering an online class focused on the time-honored techniques of value investing, as practiced by the world’s most legendary investor, Warren Buffett.
By examining case studies of Buffett’s acquisitions, students will explore the real-world principles that Buffett uses to pick companies. The class starts online April 1st and is open to the public for registration.
CONTACT INFO:

The instructor, James Berman, is available to answer questions. He can be reached at 212.388.9873 or jgb4@nyu.edu.

The INSTRUCTOR

If it’s about value investing, I’m interested. I run a global equities fund that invests in the United States, Europe and Asia. As the president and founder of JBGlobal.com LLC, a registered investment advisory firm, I manage separate accounts for high-net-worth individuals and trusts. As a faculty member in the Finance Department of the NYU School of Professional Studies, I teach Corporate Finance and the Fundamentals of Buffett-Style Investing. My book, Lessons from the Lemonade Stand: a Common Sense Primer on Investing, winner of the 2013 Next Generation Indie Award for Best Non-Fiction eBook, is a guide for the first-time investor of any age. I received a B.A. from Harvard University and a J.D. from Harvard Law School. My wife, daughter and I live in Greenwich Village where I find the lessons of value investing as useful with life as with money.

An article from the Instructor on Buffett

The One Word Missing from Buffett’s Annual Letter

 These days, can anyone tweet, converse or goose-step–let alone write 28 pages–without using the five letter word: Trump?

Warren Buffett just did.

As a value investing aficionado and Berkshire shareholder, I anticipate the annual missive from the Oracle of Omaha with bated breath. When it popped online today, I knew enough not to expect much commentary on the economic or the political. A secret to Buffett’s success has been an agnostic view on the too-many moving pieces of the macro scene. By avoiding the human obsession with the short-term and fortune telling, Buffett has always concentrated on the only thing that matters: buying wonderful businesses at fair prices. As Peter Lynch says: “If you spend more than 13 minutes analyzing economic and market forecasts, you’ve wasted 10 minutes.” I myself have found no other investing mantra more important.

But really? No mention of the greatest threat to the democratic process and the rule of law since Nixon–or beyond?

Geico is mentioned 22 times, Charlie Munger 17 times, hedge funds 12 times, table tennis once. Trump zero.

In April of 2016, Buffett went on record saying that Berkshire would do fine even with a Trump presidency. But that was at last year’s meeting–well before the election, and well before anyone thought it was a serious concern. And Buffett made some further post-election comments in December about still buying stocks, but this letter was his first major written opportunity to hold forth.

He even mentions the worthwhile contributions of immigrants but somehow never calls out Trump by name. Perhaps the silence is deafening. Buffett was an ardent supporter of Hillary Clinton in the election and his failure to mention Trump may be the most damning maneuver of all.

Or not.

Because if there’s one thing I wanted as a Buffett follower, it was a reasoned and sober commentary–refracted through the prism of his extraordinary, eminently sensible brain–on what this erratic, errant president means for our country, our markets and our lives.

James Berman teaches The Fundamentals of Buffett-Style Investing, an online class starting April 1 offered by NYU’s School of Professional Studies.

Buffett Warning

Where is he now? http://ericcinnamond.com/buffett-1999-vs-buffett-2017/

Buffett 1999 vs. Buffett 2017

This may sound awful coming from a value investor, but I don’t read Berkshire Hathaway’s annual reports cover to cover. I did earlier in my career. In fact, I’d eagerly await its release, just as many investors do today. However, over the years I’ve gravitated more to what makes sense to me and have relied less on the guidance from investment oracles such as Warren Buffett (see post What’s Important to You?).

While I know significantly less about Warren Buffett than most dedicated value investors, it seems to me that he has changed over the years. I suppose this shouldn’t be surprising as we all have our seasons. And maybe I’m the one who has changed, I really don’t know. But I remember a different tone from Buffett almost twenty years ago when stocks were also breaking record highs. It was during the tech bubble when he went out of his way to warn investors of market risk and overvaluation.

I found an old article from BBC News with several Buffett quotes during that period (link). The article discusses Warren Buffett’s response to a Paine Webber-Gallup survey conducted in December 1999. The survey showed that investors expected stocks to rise 19% annually over the next decade. Clearly investors were extrapolating recent returns far into the future. Fortunately, Warren Buffett was there to save the day and help euphoric investors return to their senses.

The article states, “Mr Buffett warned that the outsized returns experienced by technology investors during 1998 and 1999 had dulled them into complacency.”

“After a heady experience of that kind,” he said, “normally sensible people drift into behaviour akin to that of Cinderella at the ball.

“They know that overstaying the festivities…will eventually bring on pumpkins and mice.”

I really like and can relate to the Warren Buffett of nearly twenty years ago. If I could go back in time and show the 1999 Buffett today’s market, I wonder what he would say. I’d ask him if investor psychology and the current market cycle appears much different than the late 90s.

Similar to 1999, have investors experienced outsized returns this cycle? From its lows in 2009, the S&P 500 has increased 270%, or 17.9% annually. This is very close to the annual returns investors were expecting in the 1999 survey, when Buffett was warning investors.

Have investors been dulled into complacency? Volatility remains near record lows, with every small decline being saved by central banks and dip buyers. Investors show little fear of losing money.

Are today’s investors not Cinderella at the ball overstaying the festivities? It’s the second longest and one of the most expensive bull markets in history!

There are of course differences between 1999 and today’s cycle. While valuation measures are elevated, today’s asset inflation is much broader than in 1999. The tech bubble was extremely overvalued, but narrow. A disciplined investor could not only avoid losses in the 1999 bubble, but due to value in other areas of the market, could make money when it burst. Given the broadness of overvaluation in 2017, I don’t believe that will be possible this cycle. In my opinion, it will be much more challenging to navigate through the current cycle’s ultimate conclusion than the 1999 cycle.

The broadness in overvaluation this cycle makes Buffett’s recommendation to buy a broadly diversified index fund even more difficult for me to understand. Furthermore, given the nosebleed valuations of many high quality businesses, I’m not as confident as Buffett in buying and holding quality stocks at current prices. It again reminds me of the late 90s. At that time, there were many high quality companies that were so overvalued it took years and years for their Es catch up to their Ps. But these are important (and long) topics for another day.

Let’s get back to Buffett 1999. I find it interesting to compare him to Buffett 2017. Surprisingly, Buffett 2017 doesn’t seem nearly as concerned about valuations this cycle. Buffett writes, “American business — and consequently a basket of stocks — is virtually certain to be worth far more in the years ahead [emphasis mine]. Innovation, productivity gains, entrepreneurial spirit and an abundance of capital will see to that. Ever-present naysayers may prosper by marketing their gloomy forecasts. But heaven help them if they act on the nonsense they peddle.”

You can include me as a naysayer of current prices and valuations of most risk assets I analyze. Based on the valuations of my opportunity set, I’ll take the advice from another naysayer – the Warren Buffett of 1999. As he recommended, I plan to avoid extrapolating outsized returns and will not ignore signs of investor complacency. I plan to remain committed to my process and discipline. By doing so, when the current market cycle concludes, I hope to achieve two of my favorite Warren Buffett rules of successful investing – avoid losing money and profit from folly.

The World of Inefficient Stock Markets

“Let us not, in the pride of our superior knowledge, turn with contempt from the follies of our predecessors. The study of errors into which great minds have fallen in the pursuit of truth can never be uninstructive… Men, it has been well said, think in herds; it will be seen that they go mad in herds, while they only recover their senses slowly, one by one… Truth, when discovered, comes upon most of us like an intruder, and meets the intruder’s welcome… Nations, like individuals, cannot become desperate gamblers with impunity. Punishment is sure to overtake them sooner or later.”

Charles MacKay, Extraordinary Popular Delusions and The Madness of Crowds, 1841

My prior post on Charts and Technical Analysis is here: http://csinvesting.org/2017/01/04/chartists-and-technical-analysis/

The point is to realize that charts are a tool but using them to predict is a fools’ game.   You can try to find disconfirming evidence,but make sure the sample size is a large one.   More on market inefficiency from Bob Haugen.