Tag Archives: Technical Analysis

Charts: Every Picture Tells a Story Don’t It? –Rolling Stones

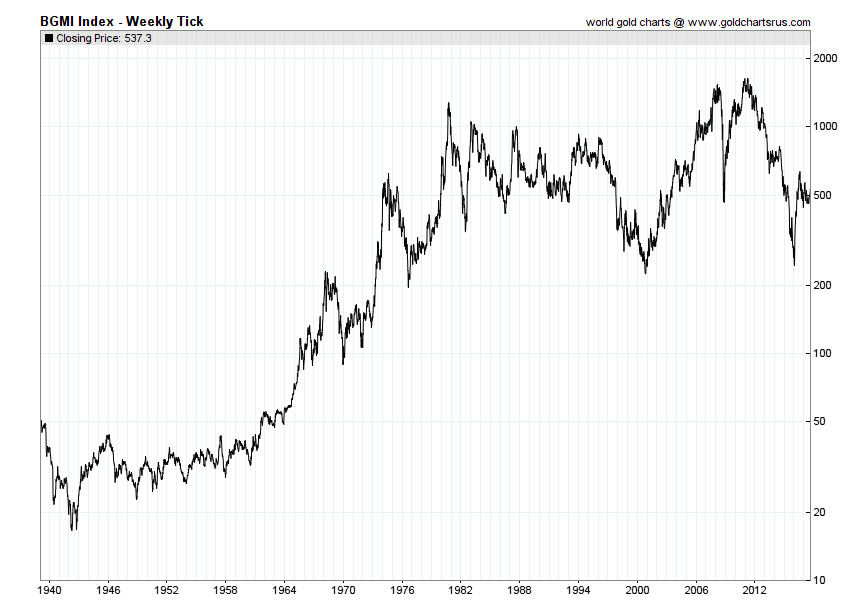
Above is a chart of the Barrons Gold Mining Index, the oldest mining index available.

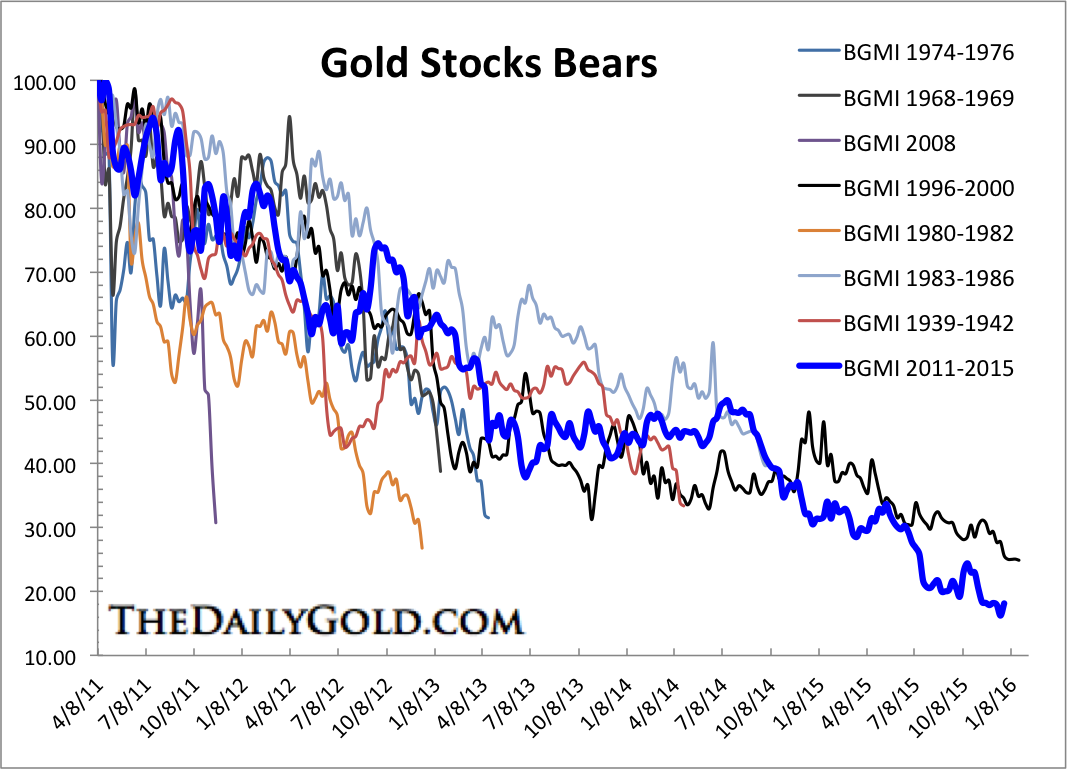
Above are chart analogs of past bear markets in gold-mining stocks. Rather than using charts to PREDICT the next “Head and Shoulders Bottom” or the next ROUNDING BOTTOM (How about I show you MY bottom?) what can charts tell you about this PARTICULAR industry?   How is that information useful? Or is it?

Note the hedged comments of the publisher of the above charts. https://www.bullionvault.com/gold-news/gold-bear-010420161

Charts have never shown (based on my research) to have any statistical predictive value because of the subjective nature of interpretation–there are always two sides to a chart. Buffett stopped charting when he could flip the chart over and get the same answer.   Note this article https://seekingalpha.com/article/82372-adventures-in-technical-analysis-jim-cramer-edition

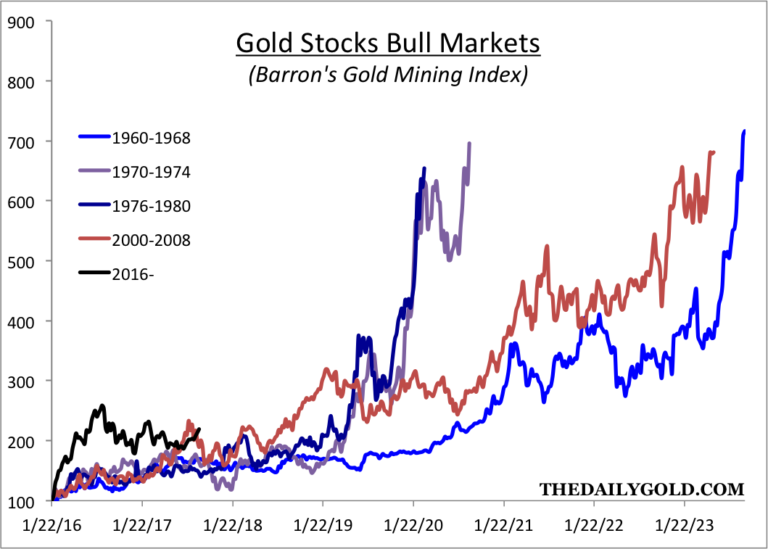
Now onto the bull market analogs.

Bull Market Analogs Article

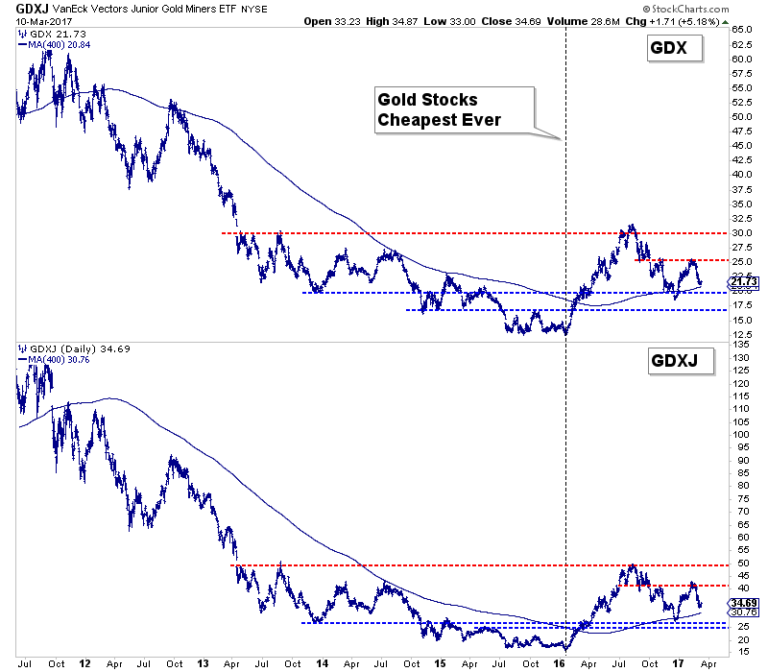
Notice the difference with these charts of housing and banks.

What might account for the difference in the chart patterns?  What do the charts tell you about the mining industry?  IF–god forbid–you did wish to invest in precious metals miners, how might you adapt your strategy?  What explains (mostly) the shape of the above charts?  It is perfectly rational to avoid the industry but what do the charts tell you about the structure of the industry? Whip out your competitive analysis books or http://mskousen.com/economics-books/the-structure-of-production/ and post your thoughts.


Chartists and Technical Analysis

Why Value Investing?  (from the Brooklyn Investor)

I don’t intend to tell you here which investment approach is correct. And here, I don’t distinguish between growth and value investing. This just describes my own evolution as a trader/investor over time, moving from charts to fundamentals-based investing. You may have observed different things and may have come to a different conclusion. That’s cool. And yes, there are credible people who swear by charts, and I’ve known some of those people too. This is just how I evolved.

Technical Years

When I first started out in the business, I was in a department that managed portfolios and set investment strategy. I read a lot of investment books and I really got into technical analysis (even though Intelligent Investor was one of early books I read). The idea was appealing to me; that all information is already reflected in stock prices so all we need to do is to study price action. No need to go digging into financial filings and read annual reports; everything is already reflected in the stock price!

The idea that you can draw lines on a chart with a ruler and predict what will happen was highly appealing to me as a young analyst starting out. I also did a lot of quantitative work too, but mostly screening and ranking stocks according to standard deviations off of this or that average, creating multi-factor valuation models for the whole market etc. I went around visiting the largest institutional investors making presentations based on technical analysis, saying things like, “if this sector breaks this trendline, it’s all over…” etc. It was incredibly fun to do. When I say “technical analysis” here, I mean things like trend lines, moving averages, RSI and other oscillators, formations like head-and-shoulder tops, descending triangles and things like that.

I also worked at one of the large hedge funds that was heavily into technical analysis. I was still big into charts at the time as were most people there. While I was there, I got to read just about every newletter that was published, many of them technical analysis related. It was interesting that nobody was ever really right often enough to be useful. Some of the prominent newsletter writers started their own funds; most of them blew up relatively quickly. Of all of the prominent technicans, nobody that I know of had a real, audited track record of actually making any money with what they preach. This was the beginning of my doubt about technical analysis. There is an old adage that on Wall Street, you never meet rich technical analysts. Or that the rich ones have made most of their money from selling books and/or newsletters.

Superinvestors of Edwards-and-Mageeville?

When you go to the bookstore and look at all the books about technical analysis, you will notice that none of them are written by people who have successful, long-term track records. The bible of technical analysis, for example, is Technical Analysis of Stock Trends by Edwards and Magee. Who are these guys? Do they have a track record of performing over a long period of time? Check out the value investing equivalent: Securities Analysis by Benjamin Graham. Benjamin Graham has a long term track record of high performance, and he has disciples that have continued to perform well using his ideas.

Other more recent books are Margin of Safety by Seth Klarman and of course, You Can Be a Stock Market Geniusby Joel Greenblatt. They both have impressive long term track records. Where are the equivalent people in the world of technical analysis? Borrowing Warren Buffett’s concept, “Where is the Edwards-and-Mageeville of technical analysis?” (Warren Buffett wrote an essay about the Superinvestors saying that they all come from the same village, the village of Graham-and-Doddsville, meaning that they all share the same investment concept as taught in the Graham and Dodd Securities Analysis book).

The more I thought about this, the more I observed, and the more I read, the iffier technical analysis got. As I watched professional traders, it seemed to me that the ones that relied a lot on technical analysis actually didn’t make money. I have never been an FX or bond trader, so I don’t know about them, but most people I observed trading off of charts didn’t seem to make money. The big boss trader who loved charts, though, did make money. But he seemed to make decisions based on a lot more than just charts. He would call 10 or 20 different people every day, get their input in the morning, see how people are positioned etc. So he had a lot more information to make decisions than just lines on a chart. If you locked him in a room by himself and made him trade just off the charts with no other information or input, I doubt he would have made the returns that he had.

Also, at the time, people who had impressive long term returns were funds like Tiger, Steinhardt, Soros etc. Those were the funds that put up big figures for decades. Technical-based CTA’s existed too, but they seemed to come and go; there really was no equivalent of Soros or Steinhardt in that area. Soros is a macro trader, but he is very fundamentals based; not really a technician.

Superinvestors of Graham-and-Doddsville

Of course, then there is Warren Buffett and his “Superinvestors of Graham-and-Doddsville”. If you’ve never read this essay before, please read it. It’s free; just click the link. It may be the most important essay ever written in the world of investing. Again, where are the superinvestors of Edwards-and-Mageeville?

But the Fundamental Guys are Wrong Too!

And all of this inevitably leads to the argument that the fundamentals based investors are frequently wrong too. Most mutual funds underperform. Economists are often wrong. Wall Street analyst estimates are no better than random. Well, yes, this is all true. First let me just give some excuses. Most mutual funds underperform, I think, because most mutual funds are asset gatherers, not asset managers. There is more money to be made by gathering assets and getting too large to outperform than by staying small enough to outperform. Having said that, asset managers in aggregate, can’t all outperform. This is not Lake Wobegan. We can’t all be above average. All investors are the market, and less fees, they will underperform.

Wall Street Analysts are Often Wrong!

This is also true, I suppose. I have seen studies that show how worthless analysts estimates are. The problem here, though, is that Wall Street has to always have an opinion on all stocks at all times. If you are a stock analyst, you have to have a buy, hold or sell recommendation. You can’t say, “I don’t know”. Investors have the luxury of saying, “I have no idea” and can move on to the next idea. Too, analysts have to come up with earnings estimates on a quarterly basis, and they are evaluated on their accuracy. Again, most long-term investors don’t really care about earnings on a quarter-to-quarter basis, which can be really noisy and random. But Wall Street analysts must have an estimate no matter how random it is.

Think of it this way. Let’s say you are a baseball analyst in charge of predicting batters’ performances. Your job is, every time a batter steps up to the plate, to guess if he will hit a single, double, triple, walk or strikeout (or whatever). What are the chances that you will guess these things correctly over time? That is like the Wall Street analyst’s job of predicting earnings every quarter. All a long term investor needs to do is to figure out what the current batter’s average will be over the next few seasons. Will this 0.300 hitter be a 0.300 hitter next year and the year after that? That is much easier to predict than what a batter will do on each at bat.

So Anyway

I know people who swear by charts, especially people in FX, bonds and commodities. Locals/floor traders and day traders too often seem to love charts. For people who make money off of chart reading, that’s great (Steve Cohen of SAC/Point72 was known to be a ‘tape reader’ in the early days and probably still does a lot of technical stuff). But for me, I just haven’t really seen any good evidence of the usefulness of technical analysis. I spent many hours trying to find it. And keep in mind that I used to love charts and was an active, professional chartist/technician working for a major investment bank early in my career. This is just how my thinking has evolved over the years.

From http://brklninvestor.com/notes/whyValue.html

http://www.followingthetrend.com/2014/05/why-technical-analysis-is-shunned-by-professionals/

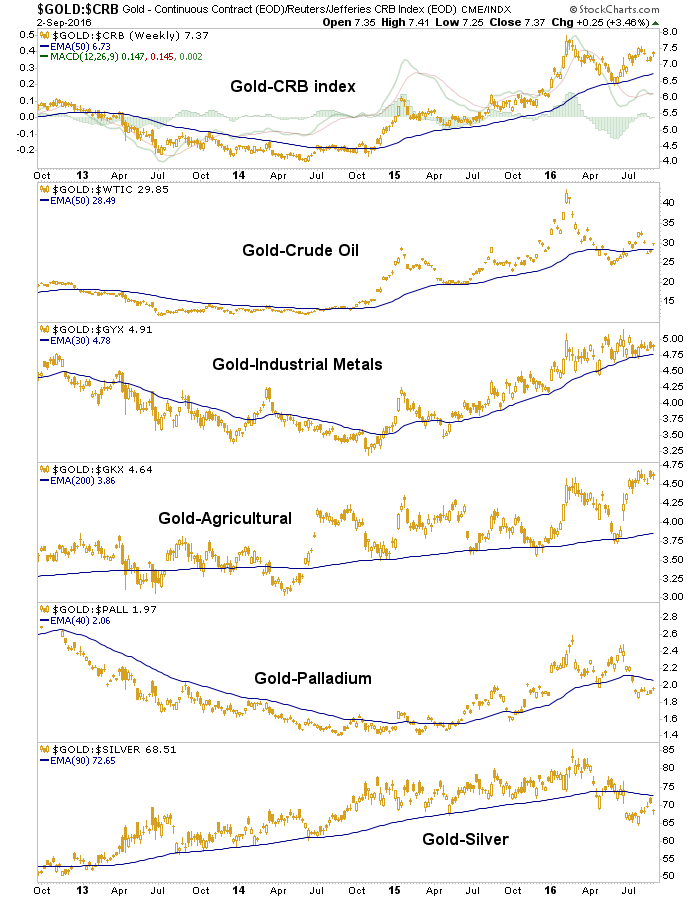
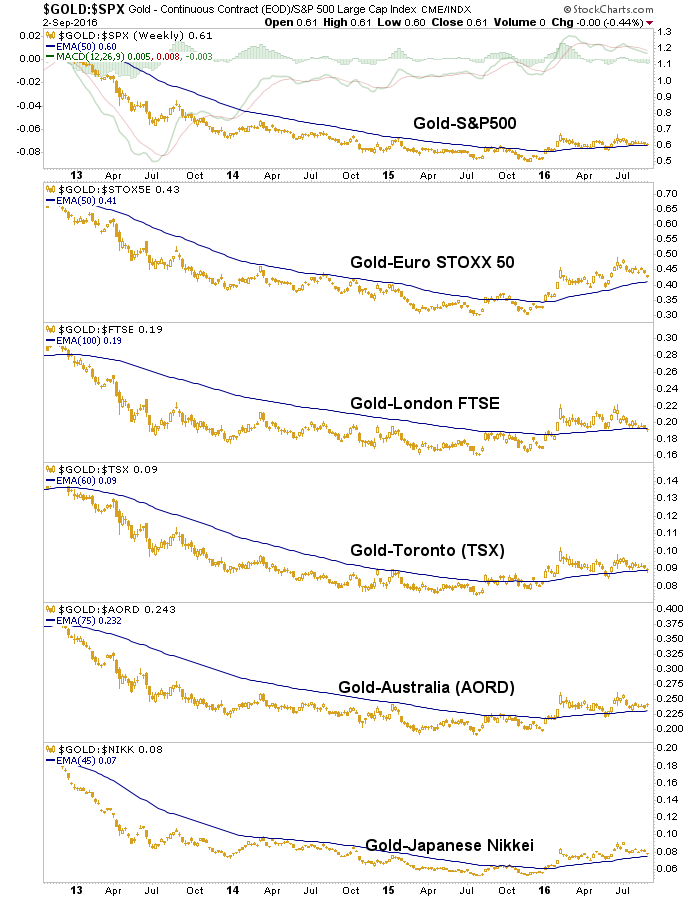
Using Technical Analysis Fundamentally; Mea Culpa

au-commod

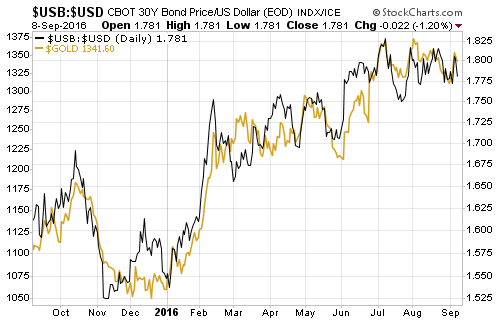
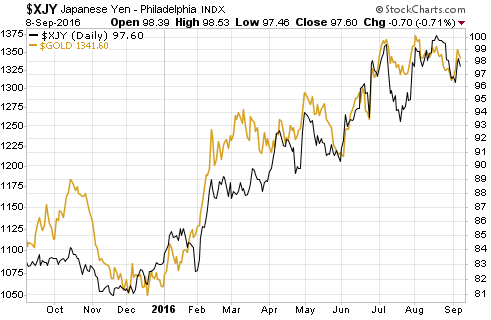
au-stocksUsing Technical Analysis for a Fundamental View:  https://nftrh.com/2016/09/03/gold-the-good-and-the-not-yet-good/

gold_usbusd_090916

gold_yen_090916

The Trend is not your friend

There’s an old saying in the financial markets that the trend is your friend, meaning that you will do well as long as you position your trades in line with the current price trend. This sounds good. The only problem is that you can never know what the current trend is; you can only know what the trend was during some prior period. How is it possible for something you can never know to be your friend?

Market ‘technicians’ often make comments such as “the trend for Market X is up” and “Market Y is in a downward trend” as if they were stating facts. They are not stating facts, they are stating assumptions that have as much chance of being wrong as being right.

A statement such as “Market X’s trend is up” would more correctly be worded as “I’m going to assume that Market X’s trend is up unless proven otherwise”. The proving otherwise will generally involve the price moving above or below a certain level, but the selection of this level is yet another assumption and the price moving above/below any particular level will provide no factual information about the current trend.

More http://tsi-blog.com/2016/09/sorry-the-trend-is-not-your-friend/

Mea Culpa: sequoia-may-2016-transcript  Not much to glean.

However, a question for you:  Is it better to buy franchises or net/nets?

If you could choose between a fair coin that was gold or a rusty tin coin that each paid off 4 to 1 on choosing heads or tails, which one would you prefer?

In October those near Philly Microcap Conference  http://microcapconf.com/conferences/philadelphia-2016/

HAVE A GOOD WEEKEND!


Technical Analysis in Action

bopo_Report-card.1

Now pretend you did not view the above annotated chart and view this:

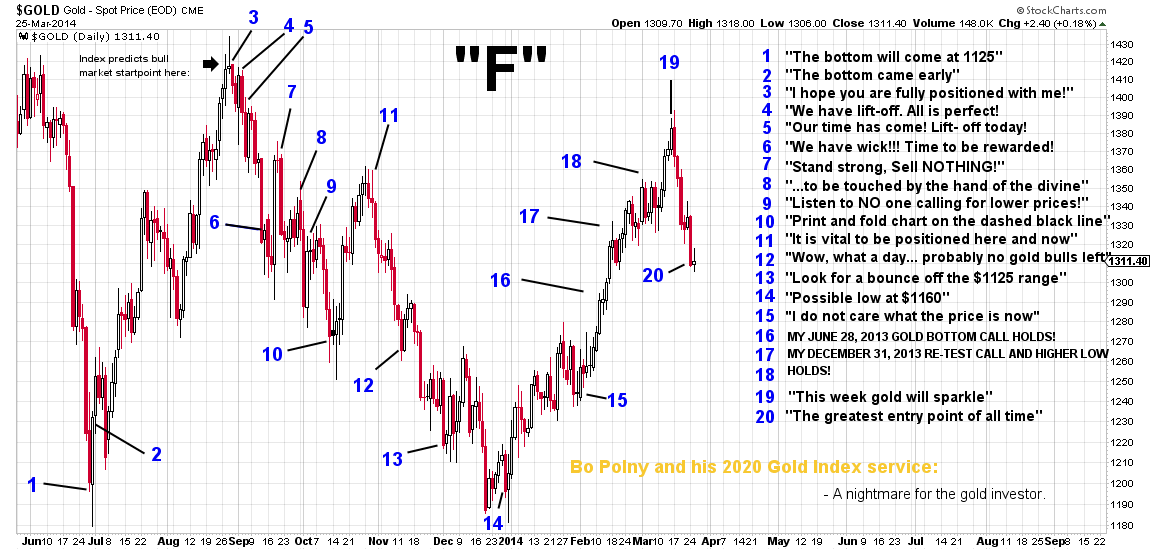
http://www.gold2020forecast.com/

Psst: NO ONE KNOWS.   Better to make your own mistakes rather than following “gurus.”

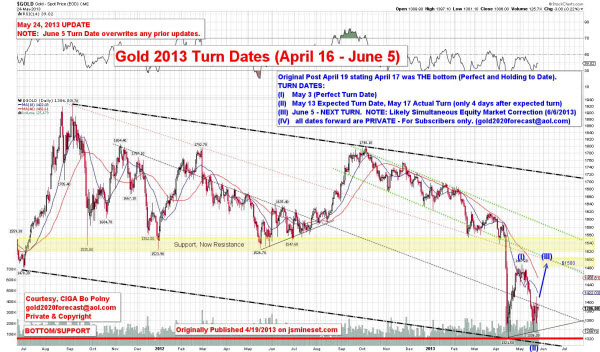
BO POLNY: GOLD HAS BOTTOMED AT $1321, TO RISE INTO JUNE 5TH TURN DATE

MAY 31, 2013 BY THE DOC 64 COMMENTS

Bottom in bopo

Gold has bottomed at $1321.
I know not one person that has been willing to go on the record and post what I have posted. No individual has yet called the bottom for gold, and I have already gone on the record announcing the bottom only two days after gold hit $1321. The recent drop (just a re-test, in my view) was just four trading days and only $100 off—and folks seem to have forgotten that my Bottom call of April 18 has (so far) held beautifully! I sold my gold at $1900, as you are aware, and the $1321 bottom has not failed me.

For those of you who simply buy and hold Gold and Silver: sleep well, my friends, and know that your decision is a wise one into the year 2020, when they will top!

I have received numerous requests for an Update to the prior dates and charts posted on jsmineset.com.  I have waited this week as I have been closely watching the gold market, and I wanted to be certain of the next date I post.

Whoops………………… big

The market continued to plunge another $200. The bottom is in?

Read the fantasy here: http://www.silverdoctors.com/bo-polny-gold-has-bottomed-at-1321-to-rise-into-june-5th-turn-date/

We all want a someone to lead us to the promised land.

Meanwhile….check out an interesting deep value blog: http://www.netnethunter.com/buy-cheap-stocks/

More on TA. Does It Work?

09NUTRITION-master675

Readers’ Replies to prior post on Technical Analysis (“TA”) found here: http://wp.me/p2OaYY-2ib

#1 Here is one rich technician. Paul Tudor Jones. Nuff said. Lowery research has been in business a long time doing TA. Tom Demark. Look him up.

#2 Personally I think people should use Fundamentals for investing in anything for the Long Term. Technical Analysis has a purpose but usually only for the immediate future. That’s why most Day Traders use Technical Analysis.

For instance, if you watch the Moving Averages and say that the 200-day Moving Average (200MA) falls below a 50-day moving average (50MA), this is known as a death cross and 9 times out of 10 that I have seen that kind of action, the price on that chart will start to go down.

Technical Analysis is mostly used for short-term movement in a stock, commodity, currency, etc., etc. It is virtually impossible to base a long-term investment on Technical Analysis.

My response: Thanks, but those opinions don’t improve our knowledge about whether TA is a usable tool.  Take #1, Paul Tudor Jones is a big, successful hedgie who uses TA–enough said.  Let’s substitute TA for dresses in drag and flips coins. The meaning would be the same.  I don’t want to pick on anyone, I read the same in many articles on Tudor Jones. I bet you Tudor Jones couldn’t even tell you EXACTLY how he uses charts.  He probably blends many factors into his “sixth-sense” based on thousands of hours of intensive interaction with the markets.See page one: 04_Jul_-_Tudor_Inv_Corp where Tudor loves the dollar and then the next day he is short the dollar. Did a chart give him a signal? If so, what is the STATISTICAL EVIDENCE?

The point is, there is and can never be any statistical evidence since charts just reflect PAST human choices of buying and selling. Future human action can’t be mathematically proscribed.

Paul Tudor Jones II Interview

Also, technical analysis has both passionate critics and ardent adherents. For example, an October 2009 study by New Zealand’s Massey University found that of more than 5,000 strategies that employ technical analysis, none produced returns in the 49 countries where researchers tested the strategies beyond what you’d expect by chance. However, scores of traders, including billionaire Paul Tudor Jones, say the discipline helped them amass great fortunes. So I tried to keep an open mind. (If Paul Tudor Jones is a billionaire, then TA must work! Flawed logic!) Read more at http://www.kiplinger.com/article/investing/T052-C000-S002-our-man-goes-undercover-and-tells-all.html#YYaXPGbZyfPmbyFp.99

#2 If you have evidence that 9 out of 10 times the “Death Cross” moves prices enough for you to take advantage of them–then great for you. But again, if this “signal” did work, why wouldn’t the market DISCOUNT it in the future especially if you could precisely define what a Death Cross is?

There are some money managers who use TA in creative ways for the long-term but I call them market mystics. 

Capital Mkt Update 2008 Montgomery and Capital Mkt Update 2009 Montgomery

http://www.montgomerycap.com/universal_economics.html

http://www.montgomerycap.com/philosophy.html

What I AM saying is to use TA if it works for you however you define “works for you” be it in confidence, money management and setting risk parameters, finding opportunities, etc. but don’t fool yourself. THERE IS NO SCIENTIFIC EVIDENCE THAT TA HAS ANY EFFICACY.

I will make a $1,000 bet. Show me any statistical proof or long-term (fifiteen years or more) of market beating returns solely using TA. Ask these guys: http://www.tradingacademy.com/about-us/.  I guess SELLING TA is more profitable than USING it. I smell a legal high-pressure selling scam: http://www.ripoffreport.com/r/online-trading-academy-boston/norwood-massachusetts-/online-trading-academy-boston-ota-watch-out-for-this-high-pressure-tactical-manipulatio-888094

Why the strange picture at the top of this post?   This NY Times’ article by Gary Taubes shows how difficult it is to obtain scientific proof for even life threatening health issues. 

http://www.nytimes.com/2014/02/09/opinion/sunday/why-nutrition-is-so-confusing.html?

NEARLY six weeks into the 2014 diet season, it’s a good bet that many of us who made New Year’s resolutions to lose weight have already peaked. If clinical trials are any indication, we’ve lost much of the weight we can expect to lose. In a year or two we’ll be back within half a dozen pounds of where we are today.
The question is why. Is this a failure of willpower or of technique? Was our chosen dietary intervention — whether from the latest best-selling diet book or merely a concerted attempt to eat less and exercise more — doomed to failure? Considering that obesity and its related diseases — most notably,Type 2 diabetes — now cost the health care system more than $1 billion per day, it’s not hyperbolic to suggest that the health of the nation may depend on which is the correct answer.
Since the 1960s, nutrition science has been dominated by two conflicting observations. One is that we know how to eat healthy and maintain a healthy weight. The other is that the rapidly increasing rates of obesity and diabetes suggest that something about the conventional thinking is simply wrong.
In 1960, fewer than 13 percent of Americans were obese, and diabetes had been diagnosed in 1 percent. Today, the percentage of obese Americans has almost tripled; the percentage of Americans with diabetes has increased seven-fold.
Meanwhile, the research literature on obesity has also ballooned. In 1960, fewer than 1,100 articles were published on obesity or diabetes in the indexed medical literature. Last year it was more than 44,000. In total, over 600,000 articles have been published purporting to convey some meaningful information on these conditions.
It would be nice to think that this deluge of research has brought clarity to the issue. The trend data argue otherwise. If we understand these disorders so well, why have we failed so miserably to prevent them? The conventional explanation is that this is the manifestation of an unfortunate reality: Type 2 diabetes is caused or exacerbated by obesity, and obesity is a complex, intractable disorder. The more we learn, the more we need to know.
Here’s another possibility: The 600,000 articles — along with several tens of thousands of diet books — are the noise generated by a dysfunctional research establishment. Because the nutrition research community has failed to establish reliable, unambiguous knowledge about the environmental triggers of obesity and diabetes, it has opened the door to a diversity of opinions on the subject, of hypotheses about cause, cure and prevention, many of which cannot be refuted by the existing evidence. Everyone has a theory. The evidence doesn’t exist to say unequivocally who’s wrong.
The situation is understandable; it’s a learning experience in the limits of science. The protocol of science is the process of hypothesis and test. This three-word phrase, though, does not do it justice. The philosopher Karl Popper did when he described “the method of science as the method of bold conjectures and ingenious and severe attempts to refute them.”
In nutrition, the hypotheses are speculations about what foods or dietary patterns help or hinder our pursuit of a long and healthy life. The ingenious and severe attempts to refute the hypotheses are the experimental tests — the clinical trials and, to be specific, randomized controlled trials. Because the hypotheses are ultimately about what happens to us over decades, meaningful trials are prohibitively expensive and exceedingly difficult. It means convincing thousands of people to change what they eat for years to decades. Eventually enough heart attacks, cancers and deaths have to happen among the subjects so it can be established whether the dietary intervention was beneficial or detrimental.
And before any of this can even be attempted, someone’s got to pay for it. Since no pharmaceutical company stands to benefit, prospective sources are limited, particularly when we insist the answers are already known. Without such trials, though, we’re only guessing whether we know the truth.
Back in the 1960s, when researchers first took seriously the idea thatdietary fat caused heart disease, they acknowledged that such trials were necessary and studied the feasibility for years. Eventually the leadership at the National Institutes of Health concluded that the trials would be too expensive — perhaps a billion dollars — and might get the wrong answer anyway. They might botch the study and never know it. They certainly couldn’t afford to do two such studies, even though replication is a core principle of the scientific method. Since then, advice to restrict fat or avoid saturated fat has been based on suppositions about what would have happened had such trials been done, not on the studies themselves.
Nutritionists have adjusted to this reality by accepting a lower standard of evidence on what they’ll believe to be true. They do experiments with laboratory animals, for instance, following them for the better part of the animal’s lifetime — a year or two in rodents, say — and assume or at least hope that the results apply to humans. And maybe they do, but we can’t know for sure without doing the human experiments.
They do experiments on humans — the species of interest — for days or weeks or even a year or two and then assume that the results apply to decades. And maybe they do, but we can’t know for sure. That’s a hypothesis, and it must be tested.
And they do what are called observational studies, observing populations for decades, documenting what people eat and what illnesses beset them, and then assume that the associations they observe between diet and disease are indeed causal — that if people who eat copious vegetables, for instance, live longer than those who don’t, it’s the vegetables that cause the effect of a longer life. And maybe they do, but there’s no way to know without experimental trials to test that hypothesis.
The associations that emerge from these studies used to be known as “hypothesis-generating data,” based on the fact that an association tells us only that two things changed together in time, not that one caused the other. So associations generate hypotheses of causality that then have to be tested. But this hypothesis-generating caveat has been dropped over the years as researchers studying nutrition have decided that this is the best they can do.
One lesson of science, though, is that if the best you can do isn’t good enough to establish reliable knowledge, first acknowledge it — relentless honesty about what can and cannot be extrapolated from data is another core principle of science — and then do more, or do something else. As it is, we have a field of sort-of-science in which hypotheses are treated as facts because they’re too hard or expensive to test, and there are so many hypotheses that what journalists like to call “leading authorities” disagree with one another daily.

It’s an unacceptable situation. Obesity and diabetes are epidemic, and yet the only relevant fact on which relatively unambiguous data exist to support a consensus is that most of us are surely eating too much of something. (My vote is sugars and refined grains; we all have our biases.) Making meaningful inroads against obesity and diabetes on a population level requires that we know how to treat and prevent it on an individual level. We’re going to have to stop believing we know the answer, and challenge ourselves to come up with trials that do a better job of testing our beliefs.

Before I, for one, make another dietary resolution, I’d like to know that what I believe I know about a healthy diet is really so. Is that too much to ask?
Gary Taubes is a health and science journalist and co-founder of the Nutrition Science Initiative.

Does Technical Analysis Help?

Lightening

Note the Head & Shoulder Pattern Above and the negative divergence.

http://macromon.wordpress.com/2012/08/29/picture-of-the-day-technical-analysis/

A Reader Asks: I was wondering, you seem to use a little bit of technical analysis in your work, like in the annual letter you recently sent out.  I’m a buy-at-a-cheap-price purist at this point, and I don’t pay much attention to price/volume movement.  However, maybe I should.  I’d love to persuaded as to why learning about technical analysis is worth the effort.  That is, of course, if you think it is.

Would you mind briefly explaining the basics of it, or maybe just making a brief book or article recommendation for it in one of your posts?  I’d really like to hear about your experience with it.

My Reply:  Warren Buffett explained, “I realized that technical analysis (“TA”) didn’t work when I turned the chart upside down and didn’t get a different answer.”After eight years of trying, he concluded that it was the wrong way to invest. Then he focused on the teachings of Ben Graham, which stressed business fundamentals, finding a strategy that both made sense and, more importantly, worked.  See more:  http://www.fool.com/investing/value/avoid-the-mistake-that-cost-buffett-8-years-of-bet.aspx

I don’t believe technical analysis has any predictive value or if it does, the rules are so fuzzy that nailing Jello to the wall would be easier than determining the efficacy of TA.  All a chart tells you is the price and volume history of a company’s stock.  What has happened in the PAST.  The chart may provide confirmation of your theory of who is on the OTHER SIDE OF THE TRADE from you if COMBINED with strong company specific fundamental knowledge plus industry knowledge.  Knowing if there are smart people or “dumb/emotional” investors on your side of the trade may be helpful ON THE MARGIN.

Why are there no rich technicians?

And if someone did actually HAVE A SECRET why would they reveal themselves?  Those that know, don’t say and those who don’t know  have the floor to themselves, like CNBC. Most technicians wiffle, waffle and sound like this:
http://www.kereport.com/2014/02/06/interesting-idea-gary-savage/ .  Nothing factual or evidence-based here.  “Well I think this or if that does this then this does that!  Gimme a break!  Be warned! If you listen more than four minutes of the podcast, your brain will turn to slush.

Trade the trader:http://youtu.be/GNEF1Iszy6c   Actually, seems more in line with my thinking, “Who is on the other side of the trade from you?”

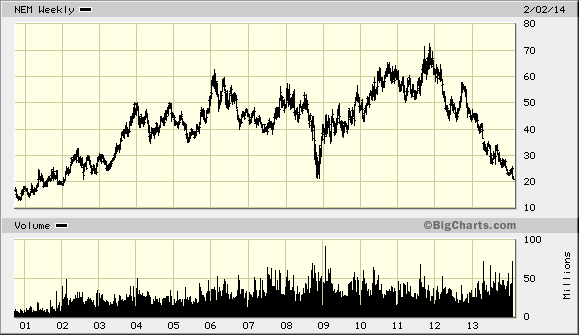
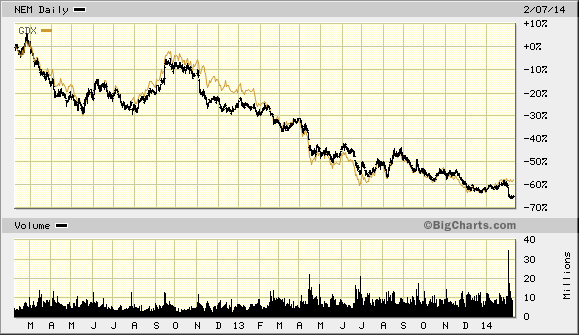
I use charts to describe price history and my hypothesis about buyers and sellers. Let’s take a recent example where I sold out of the money puts ($18) and bot ($15 puts) for a bullish put spread on NEM. I am certainly not recommending NEM because there are “better” companies in terms of returns out there in the mining sector like Agnico (AEM), Royal Gold (RGLD), Detour, Kirkland, etc. but the sizing and diversity of your portfolio is critical. These companies are BURNING MATCHES!  You gotta sell when the birds chirp. See NEM NEM_VL

Big NEM

Note the 75% decline–one of the worst for the major gold producers and back to twelve-year lows.  Horrific! A lot of carnage, but there has been a change in management, a focus on slimming down and improving operations.  NEM made the fateful mistake of growing for growth’s sake five years ago.

NEM GDX

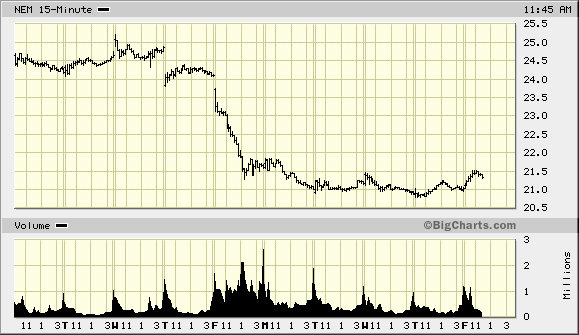
Nem is a major component of GDX. Note the recent large (5%) under-performance. NEM announced earnings on the 31st and the stock lost about 10% of its value in one day. Volume traded at almost four (4x) times normal. Who sold; who bought?   Track here: http://whalewisdom.com/stock/nem

If you note the large percentage of portfolio holders, you are seeing deep value investors move in (Van de Berg of www.Centman.com or Century Management, Inc.) while closet indexers are probably selling after news that should not have been unexpected for anyone following this company.

nem hourly

So on the 31st of Jan. on the 10.5% decline, I sold a put spread for a net credit. I am laying out X to make about 2X but I can lose 2.5X if NEM goes below $15 after six months. This is a speculation, not an “investment.”

The point is that the huge volume of 4xs normal AFTER a 70% drop over the past two years to a price at or below its hard asset value (assuming gold doesn’t go below $900/$1,000 over the next twelve months) tells me that “WEAK” hands are giving up to more committed, longer-term holders (deep value).  If gold goes below $1,200, you will see mine shut-ins.  Fundamentally, the news seems absurdly overdiscounted–a showdown with the Indonesian government over a new smelting law  http://finance.yahoo.com/news/indonesia-miners-must-pay-smelter-103242512.html.

While the company does have hefty debt–a problem, no doubt, if gold declines another 20%–but the debt’s repayment schedule is not front-end loaded. There is time on NEM’s side. That said, this is a lumbering giant with limited upside compared to other companies in the mining sector (IMHO).

I structured this as a defined risk with little capital tied up. It is more of a cheap asset coupled with taking advantage of the market’s emotional over-reaction. I also had the benefit of HIGH volatility that day. When volatility spikes it seems as if traders think NEM will go down 5% to 10% a day. Actually, after a 10% drop, the market figures an equal probability of the price of NEM to go up or down, but I don’t think each day is independent of the prior day. Market’s DO DISCOUNT–overly in this case.

So, that is how I use charts. Charts and sudden price movement alert me to potential opportunity like an over-reaction to news versus intrinsic value. But price and volume alone won’t predict where the price will then go. I need to combine the chart with my basic understanding of the company’s value along with WHO IS ON MY SIDE? and WHO IS ON the OTHER SIDE FROM ME?

I don’t have a guarantee, but I do think the huge volume of selling on the 31st was not well-reasoned based on what the facts are.

If you leave with anything, leave with this: WHO IS ON THE OTHER SIDE OF THE TRADE?  As Seth Klarman says, “I want to be on the other side from uneconomic selling like deletions from the S&P.”

Hope that helps………..

A Market Fable: The Fishing Boat

The Fable of the Fishing Boat

Then there was the time in 1978 when the bear market was taking its toll on Putnam’s holdings. Walt (The technical analyst of the firm) just couldn’t make the portfolio managers understand that bear markets trump even the best fundamentals.

So he circulated the following memorandum to Putnam’s investment department, which he considers the best thing he ever wrote:

Once upon a time, there was a big fishing boat in the North Atlantic. One day the crew members noticed that the barometer had fallen sharply, but since it was a warm, sunny and peaceful day, they decided to pay it no attention and went on with their fishing.

The next day dawned stormy and the barometer had fallen further, so the crew decided to have a meeting and discuss what to do.

“I think we should keep in mind that we are fishermen,” said the first to speak. “Our job is to catch as many fish as we can; that is what everyone on shore expects of us. Let us concentrate on this and leave the worrying about storms to the weathermen.”

“Not only that,” said the next, “but I understand that the weathermen are ALL predicting a storm. Using contrary opinion, we should expect a sunny day and, therefore, should not worry about the weather.”

“Yes,” said a third crew member. “And keep in mind that since this storm got so bad so quickly, it is likely to expand itself soon. It has already become overblown.”

The crew thus decided to continue with their business as usual.

The next morning saw frightful wind and rain following steadily deteriorating conditions all the previous day. The barometer continued to fall. The crew held another meeting.

“Things are about as bad as they can get,” said one. “The only time they were worse was in 1974, and we all know that was due to the unusual pressure systems that were centered over the Middle East that won’t be repeated. We should, therefore, expect things to get better.”

So the crew continued to cast their nets as usual. But a strange thing happened: the storm was carrying unusually large and fine fish into their nets, yet at the same time the violence was ripping the nets loose and washing them away. And the barometer continued to fall.

The crew gathered together once more.

“This storm is distracting us way too much from our regular tasks,” complained one person, struggling to keep his feet. “We are letting too many fish get away.”

“Yes,” agreed another as everything slid off the table. “And furthermore, we are wasting entirely too much time in meetings lately. We are missing too much valuable fishing time.”

“There’s only one thing to do,” said a crew member. “That’s right!”

“Aye!” they all shouted.

So they threw the barometer overboard.

(Editor’s Note: The above manuscript, now preserved in a museum, was originally discovered washed up on a desolate island above the north coast of Norway, about halfway to Spitsbergen. That island is called Bear Island and is located on the huge black and white world map on the wall in Putnam’s “Trustees Room” where weekly investment division meetings took place.)

What differentiates Walt’s book http://www.amazon.com/Walter-Deemer/e/B005Y5NBNE/ref=ntt_athr_dp_pel_1 and sage advice is that he was on the front line — he walked the walk in leading Putnam Management’s technical analysis effort when Putnam was one of the premier money management firms extant.

I want to close by repeating what I view as my buddy/friend/pal Walt Deemer’s most famous words of wisdom — these words are always relevant, perhaps even more so in today’s markets.

“When the time comes to buy, you won’t want to.”

— Walt Deemer