 Sir John Templeton Quotes
“Bull markets are born on pessimism, grown on scepticism, mature on optimism and die on euphoria.
- The time of maximum pessimism is the best time to buy, and the time of maximum optimism is the best time to sell.”
- “An investor who has all the answers doesn’t even understand the questions.”
- “Diversify. In stocks and bonds, as in much else, there is safety in numbers.”
- “…success is a process of continually seeking answers to new questions.”
- “People are always asking me where is the outlook good, but that’s the wrong question…. The right question is: Where is the outlook the most miserable?”
- “Focus on value because most investors focus on outlooks and trends.”
- “Sell when you find a much better bargain to replace what you are selling.”
Sixteen Rules: Sixteen Rules for Investment Success_Templeton
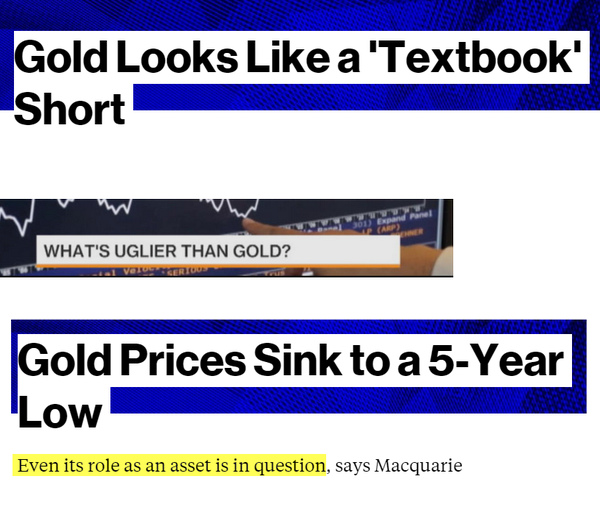
Where is the outlook the most miserable?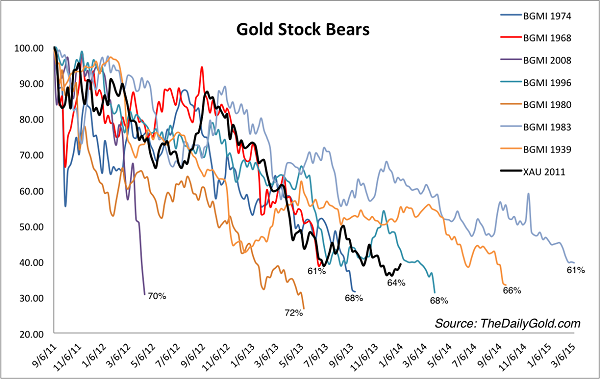
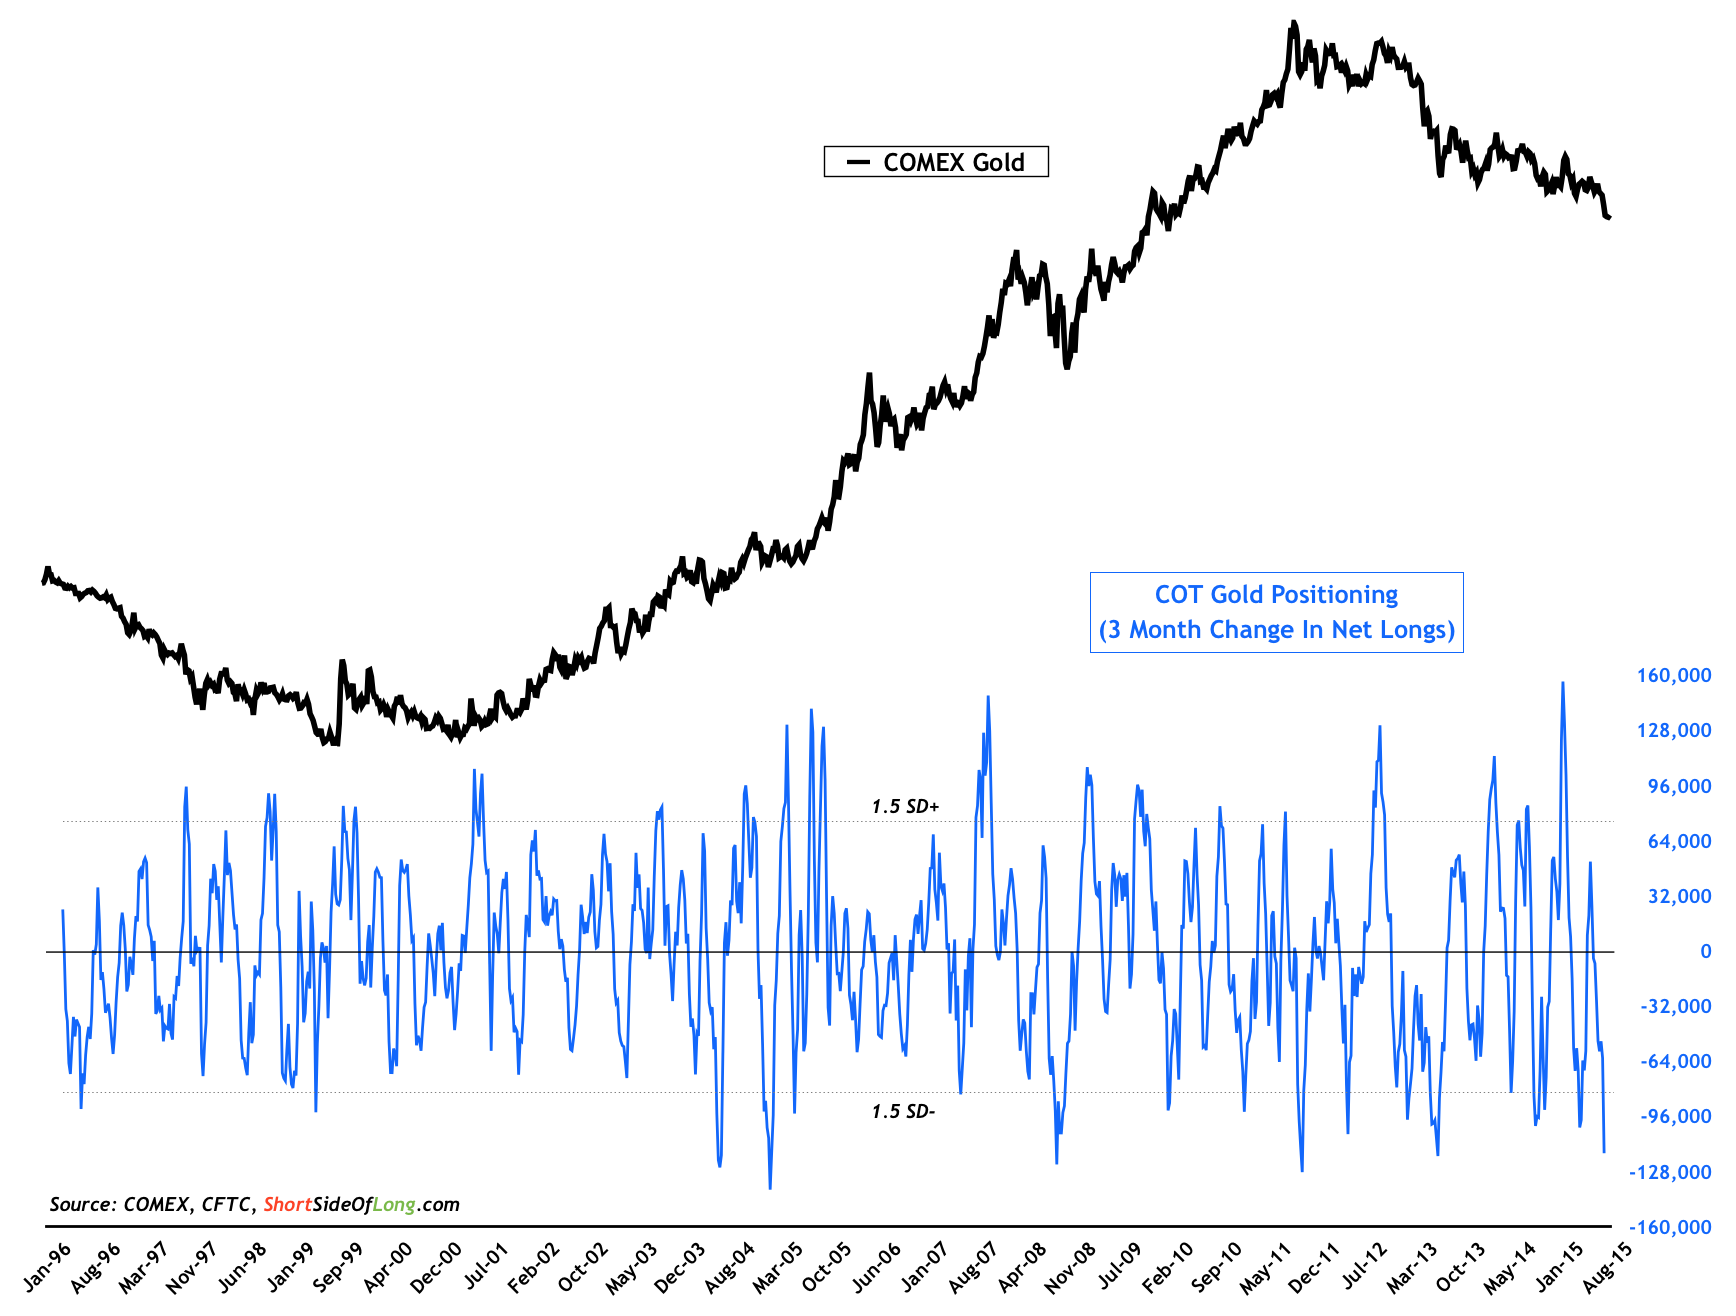
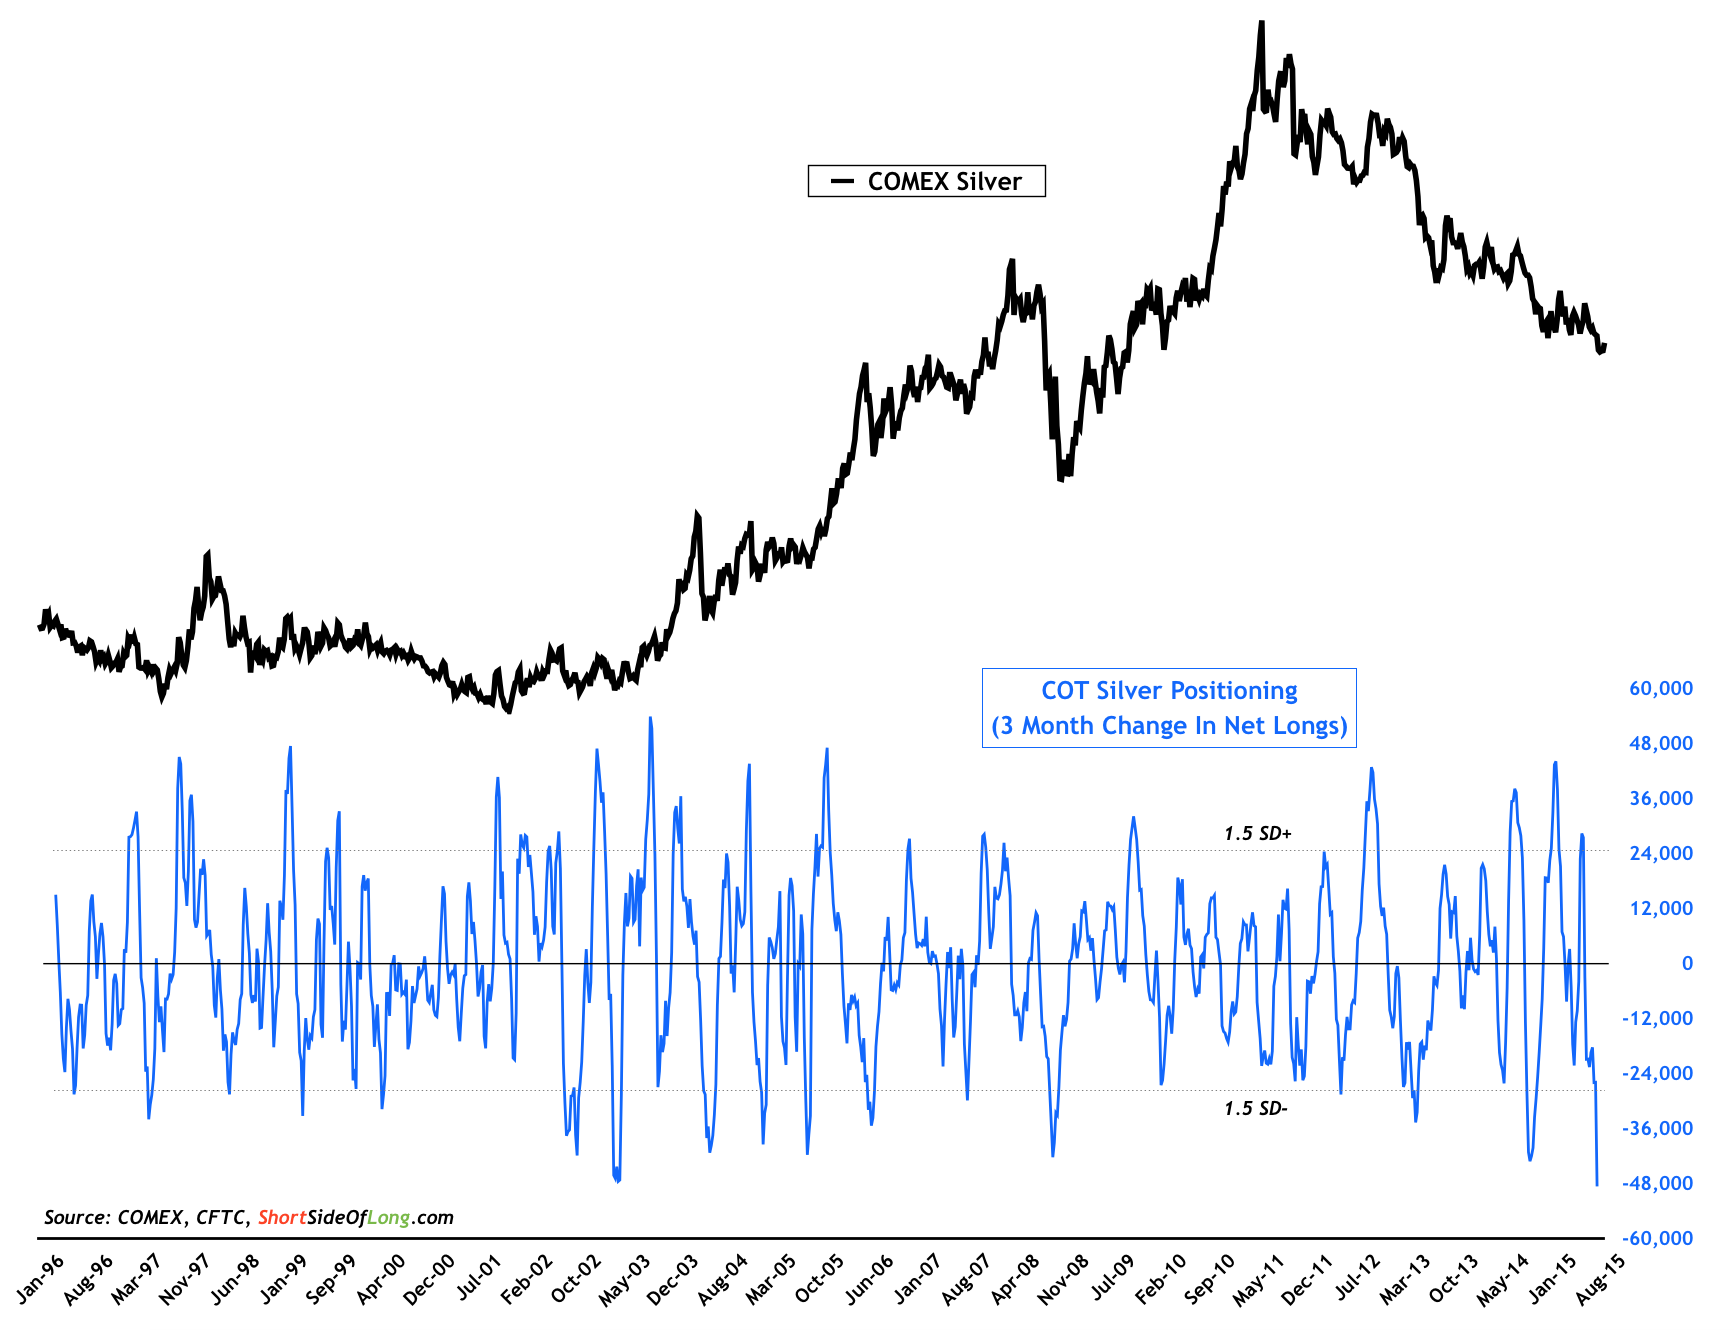
Gold and silver stocks (as well as gold/silver) certainly fit John M. Templeton’s criteria of a hated asset class. The current 2011 to 2014 bear is near the average in duration and price decline. The worst decline in gold stock history was the 1980 bear market with a 72% decline. So, one sign post is the past. (Gold index used: Barrons’ Gold Mining Index or BGMI)
But charts like the the gold index only tell you the past.
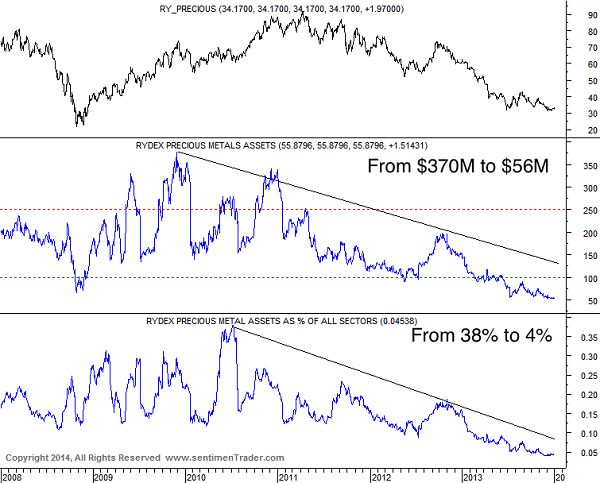
As you would expect, sentiment follows price. Note the huge decline in Rydex precious metals assets compared to all other financial asset sectors of the market–5%. Even the 2008/09 crisis period had triple the percentage. Of course, public opinion is at near all-time lows.
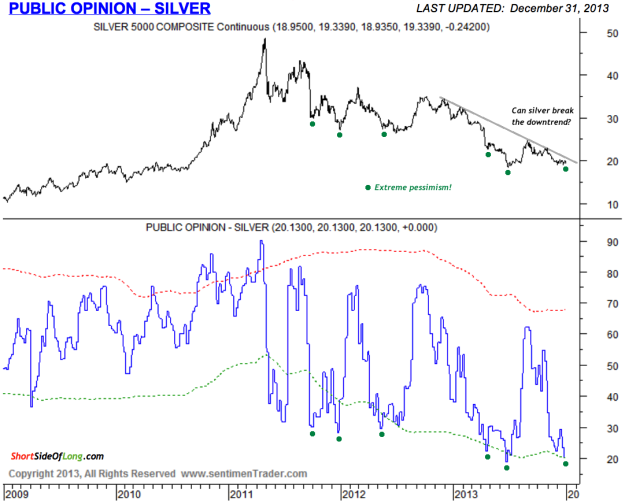
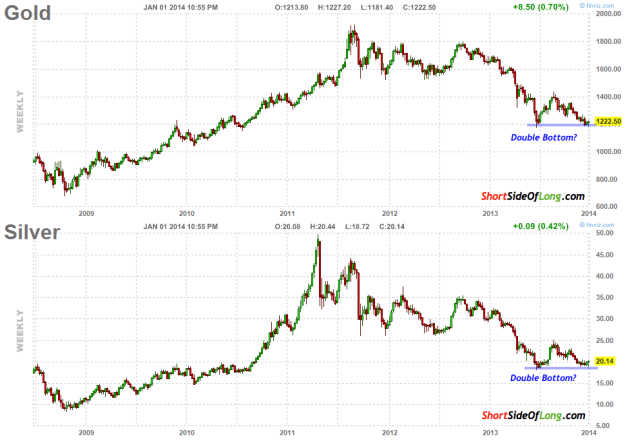
As price quietly stops declining (for now?)
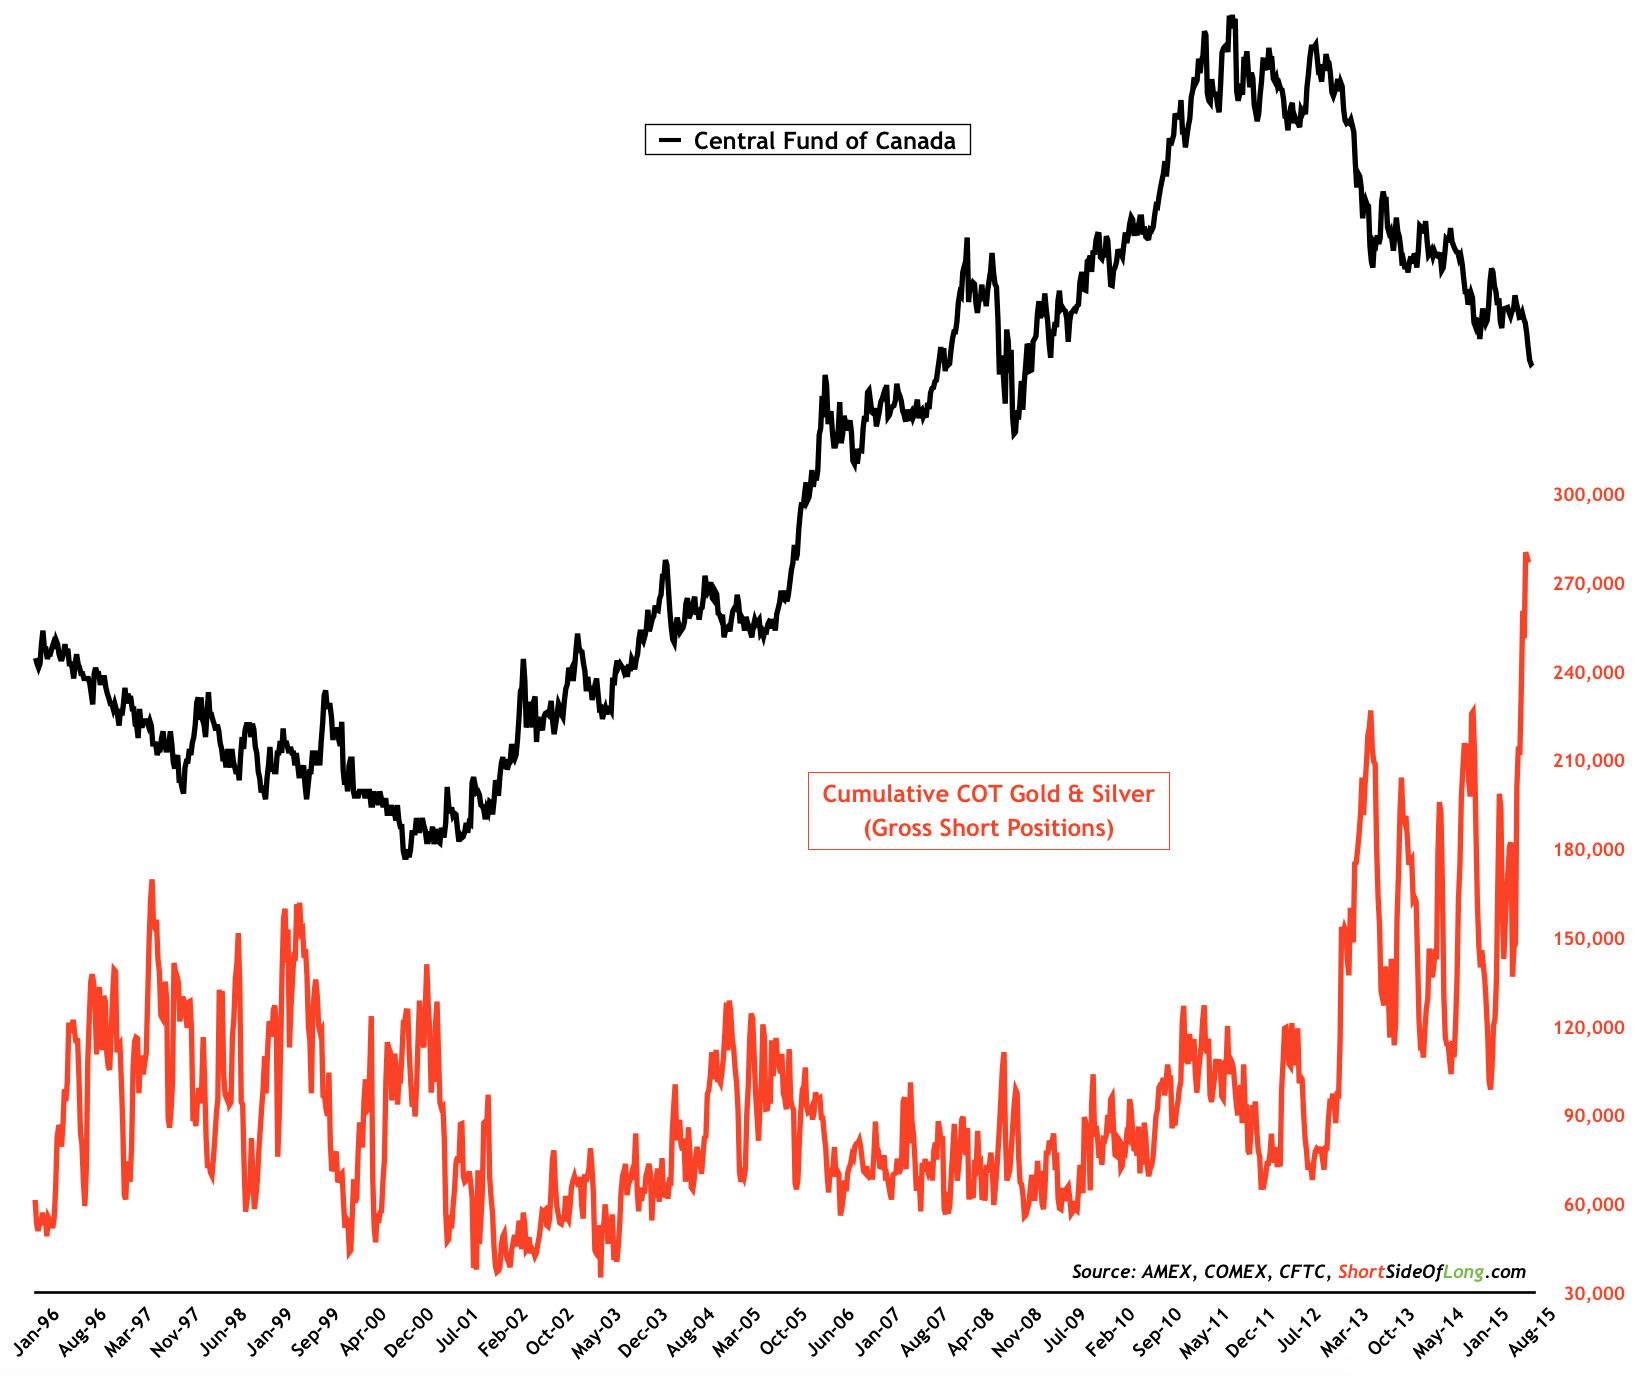
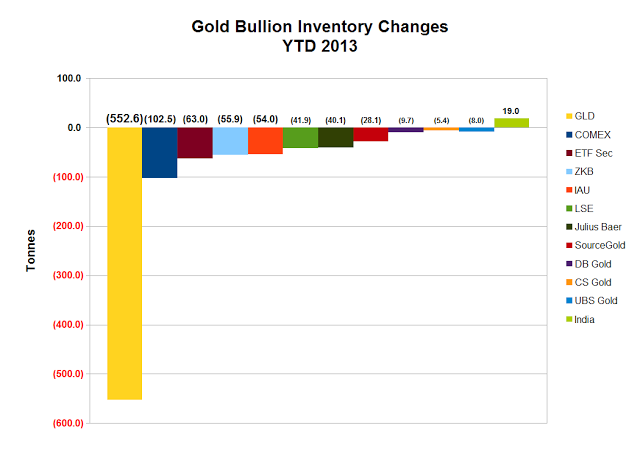
Another sign of bearish Western investor sentiment was the draining of gold from ETFs. Also, there were discounts of up to 8% to 10% in closed end funds such as CEF and GTU that hold gold and silver bullion–an asset with no credit liability! The gold mostly went to Asia. Physical demand is high at these prices. I simply view gold as money that can’t be debased in a world of fiat currency wars. That doesn’t mean the price of gold in US dollars can’t go lower in the near term–three to eighteen months. 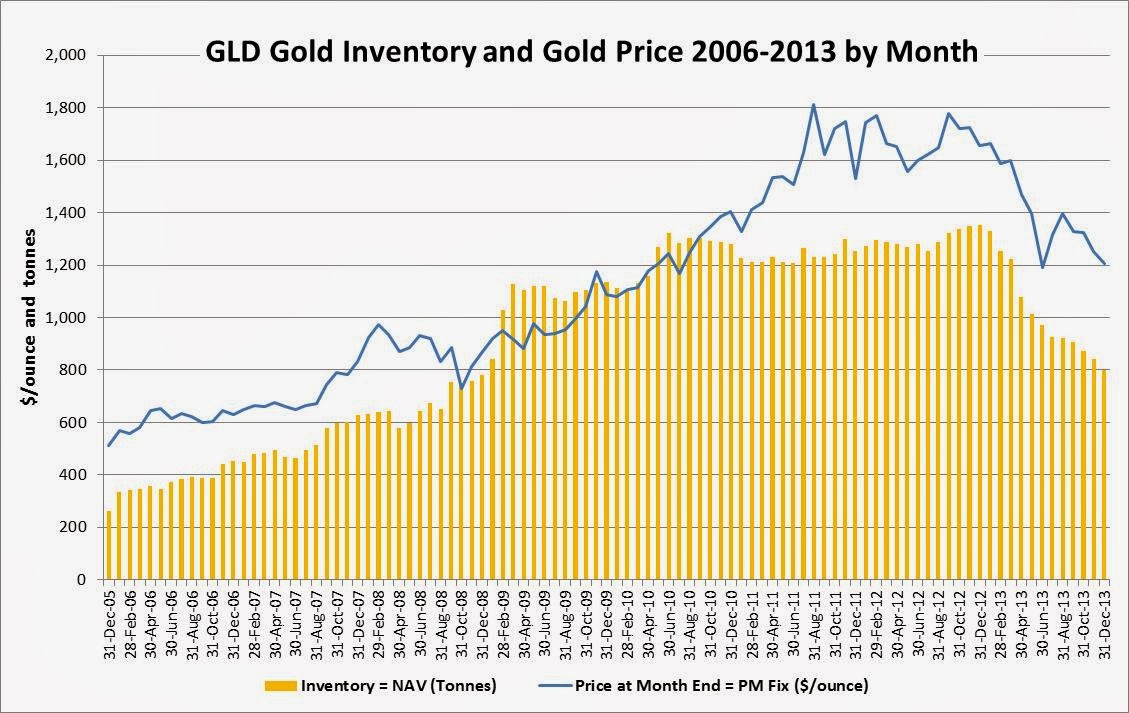
Rising demand for physical gold but declining price, video:
http://news.goldseek.com/GoldSeek/1388758285.php
http://www.bloomberg.com/news/2013-12-31/gold-with-silver-heading-for-worst-decline-in-three-decades.html
http://jimrickards.blogspot.com/
SEARCH STRATEGY
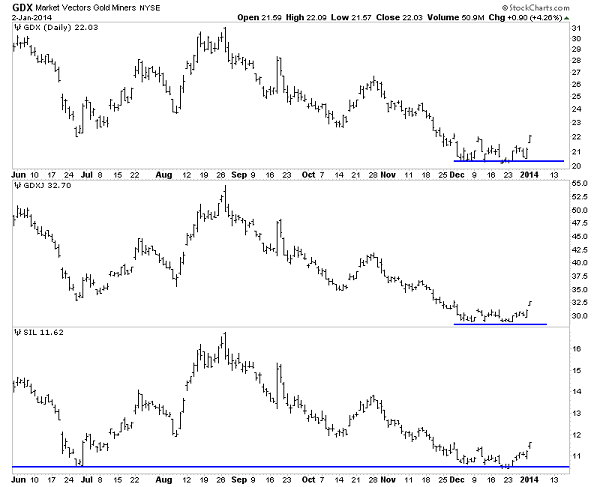
All of the above, is one part of a search strategy–look for the biggest price declines with the highest negative (or lowest positive) sentiment. Study the past hundred or so years of the industry (Google: Mark J. Lundeen and gold shares). If you are going to buy precious metals equities or gold/silver 5% to 20% as part of a portfolio, I suggest a high-quality mutual fund like Tocqueville Gold fund (TGLDX) or an ETF like GDX, GDXJ. You are nicked 1% or more in annual fees with a mutual fund but you get the diversification. GDX and GDXJ include companies that may be financially over leveraged or of poorer quality, but you have a lower cost and wide diversification. If gold and silver rise significantly, then highly leveraged–operationally and financially–leveraged companies will vastly outperform higher quality large cap miners like Agnico-Eagle (AEM) for example. I prefer a basket of 15 or so hand-picked gold and silver miners with 1. management with skin in the game, 2. decent balance sheets, and 3. well-defined projects with low cash and capex costs (no explorers unless a prospect generator). My goal is to hold through the beginning of the NEXT bear market–perhaps two-to-five years away?
Finding a hated asset class and then finding financially strong companies is relatively easy with some diligence. The HARD PART is holding on through the wild gyrations of price and sentiment. Stomach and character over brains.
Teaching the Young About Investing
http://sprottglobal.com/thoughts/articles/who-is-teaching-the-young-about-investing/
John Del Vecchio and Tom Jacobs, the authors of What’s Behind the Numbers?,
are giving a presentation at the New York Society of Analysts. Attendees will learn:
How companies hide poor earnings quality
Repeatable methods for uncovering what companies don’t tell you about their numbers
Reliable formulas for determining when a stock will get hit
Whether you’re a number cruncher or just curious, you’ll greatly benefit from this seminar, given by two people who combine investment chops with crowd-pleasing stories. So what are you waiting for?
Date: January 13, 2014
Time: 6:30 – 8 pm
Place: NYSSA Conference Center
1540 Broadway, Suite 1010
(entrance on 45th Street)
New York, NY 10036
Price: Nonmember $55
($10 surcharge for walk-ins)
Advance registration is encouraged in order to avoid the additional charge for walk-ins. Also, space is limited by the size of the room.
You may not be able to keep your resolutions about losing weight or going to the gym, but with a successful portfolio, no one will really care. So start the new year right by attending the above seminar.
Thank you for your interest in What’s Behind the Numbers?. Please feel free to share this with your networks!