Sentiment falls to two-year lows for gold miners as shown by $BPDGM
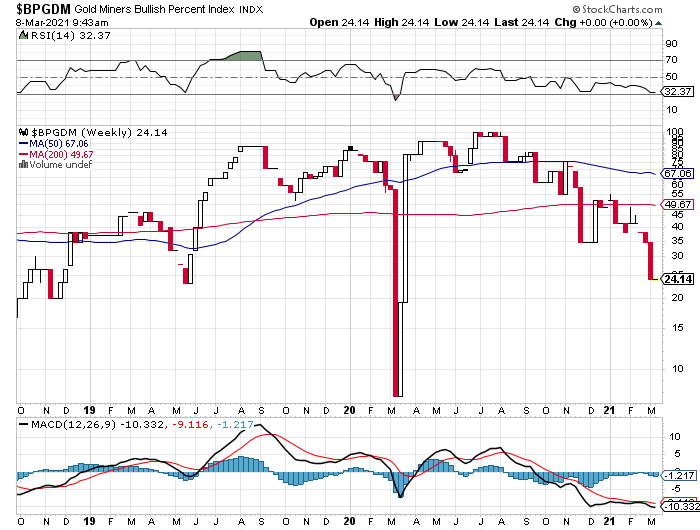
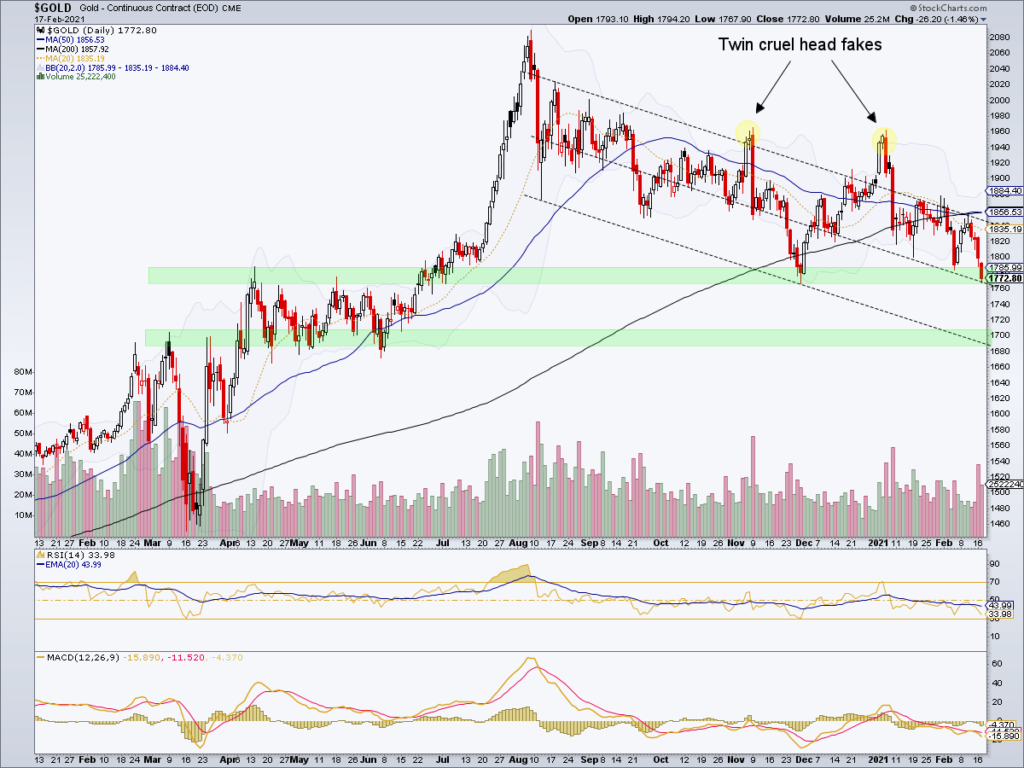
When searching for opportunity, mispriced companies, and “value” (getting more than what you pay risk-adjusted as defined by me), a good place to look is where the marginal seller has sold. Below, gold has fallen for seven months from almost $2,100 to $1,670 recently or about a 20% decline. Now there are fewer calls for $2,500 gold. Pervasive bearishness abounds.
Notables such as Mark Cuban, owner of the Dallas Mavericks said, “I hate gold. Gold is a religion. I do not see it as an alternative to currency.”.

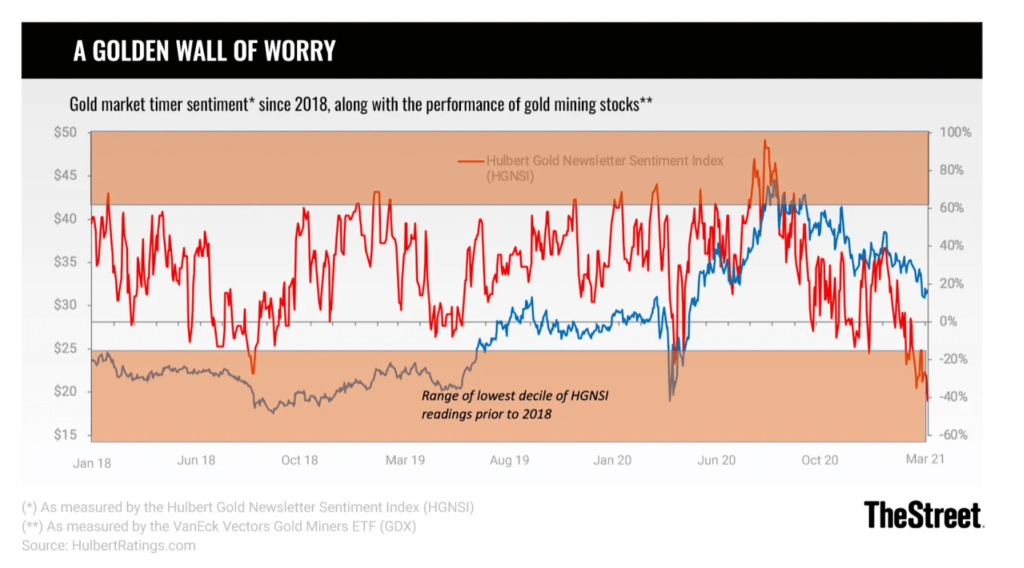
Other sentiment indicators register new lows:
Albert Edwards@albertedwards99·#gold I was asked if there was an update to the Hulbert Gold Newsletter Sentiment Index (HGNSI). This recent post from @LawrenceLepard highlights HGNSI has slumped to MINUS 41.7%. “Only time lower since 2000 is 2013 collapse when it was -50 or so.” Wow!
Below is the Gold Optix sentiment index plumbing new lows.

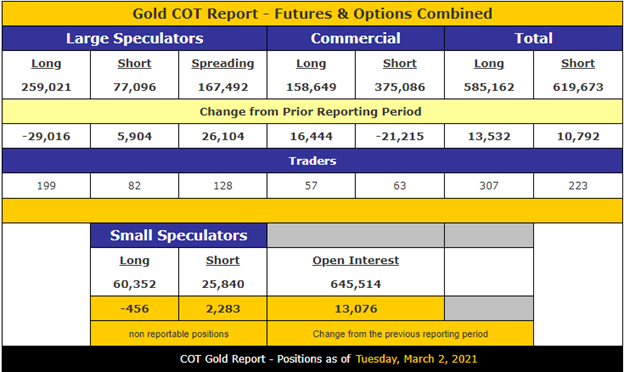
The Gold Commitment of Traders report below shows a big swing between speculators selling their long positions and adding to shorts while commercials do the reverse. An investor or trader needs to track these figures over time to place them into context. I view the figures as contrarily bullish–my opinion.
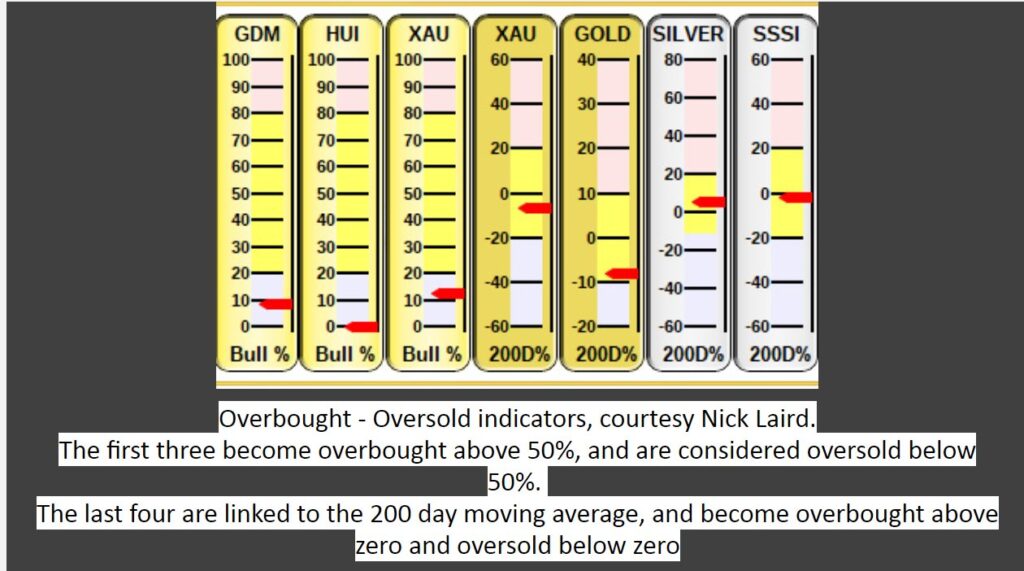
Finally, despite gold declining and bearish sentiment rising, gold miners have steadied relative to precious metals.
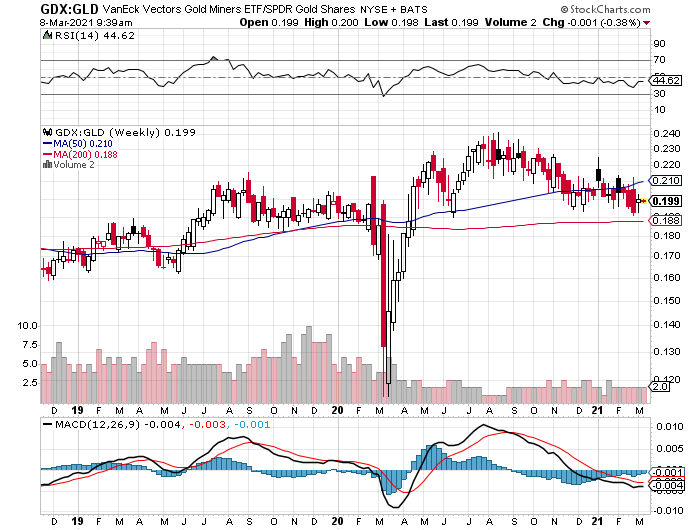
All the sentiment indicators and price action of miners relative to gold seem to indicate that the market may be absorbing the most marginal seller. This is the seller who either by panic or strategy is willing to sell at the lowest price. There is no certainty that the market for gold or miners has bottomed but an investor can begin to look in this area.
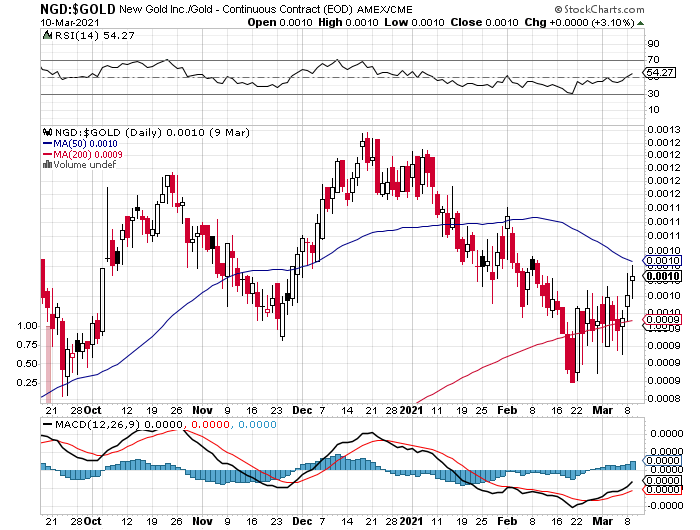
New Gold (NGD) Trading at 6 times Enterprise Value to operating cash flow.
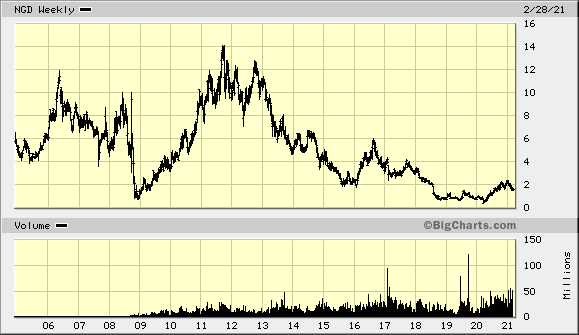
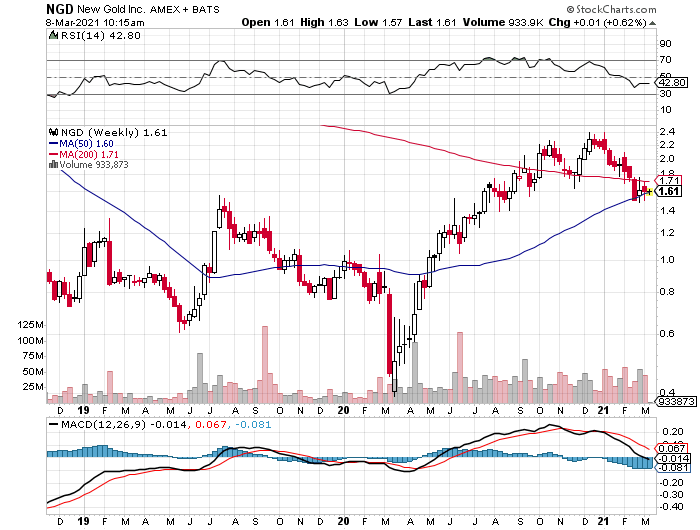
Six times operating cash flow of $295 mil. divided into 676 mil. shares times $1.70 per share (NGD) plus $665 mil. in net debt or $1.15 bil. market cap plus net debt of $665 mil. or $1.815 bil. in enterprise value / by 295 of operating cash flow. Management estimates the company will generate $1.5 billion in free cash flow over 2021 to 2025–almost enough to cover the current market cap and repayment of total debt. The company has $490 mil. in liquidity. New Gold had gold hedges that capped their selling price at an average $1,623 per ounce. Those hedges are closed now so higher gold prices will benefit. New Gold is also leveraged to the price of Copper.
New Gold has mines in Canada or in safer jurisdictions. This seems like a bargain–and I believe it is–but there are risks. This is not a recommendation but an example of what appears in depressed markets. Also, NGD trades below $5 per share so some money managers are precluded from owning the shares. An investor should start with the presentation below (see link) and then study the financials. Look at management. Do your own work so as to learn and gain confidence because when or if NGD falls 30%, you will not know whether to add, sell, or buy? There is one obvious risk with one of the mines owned by New Gold–so know about that particular risk! And know the other risks too.
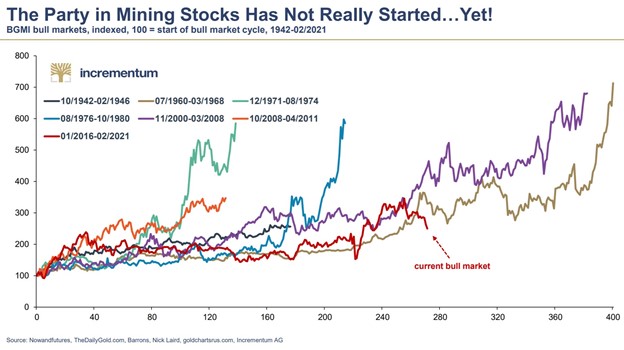
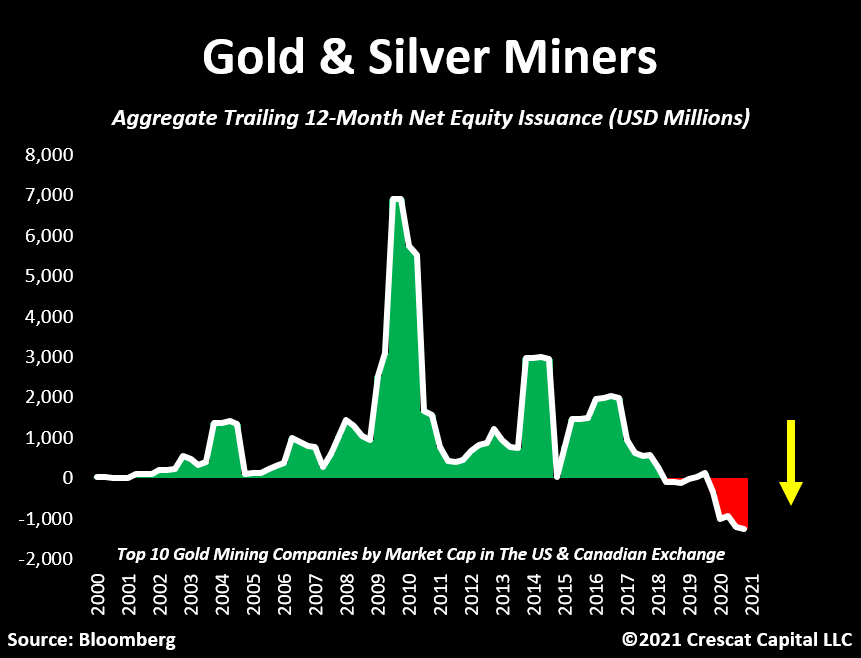
There are no certainties, of course. One simply seeks to place the odds of finding bargains in one’s favor. Good luck and good hunting!
P.S. March 12, 2021 Expect bearish headlines on gold: Don’t Expect Gold to Bounce Back Anytime Soon | Barron’s
Update on March 31st, 2021
fred hickey@htsfhickey A normal multi-mo. correction following August gold record highs ($2065) has created many doubters. Best time to buy is at darkest sentiment moment(HGNSI -45, Ned Davis Research Gold Sentiment Composite 0% bulls) Doubts with deficit spending &money printing thru the roof? Buck up

2 responses to “Searching for the marginal seller”