Category Archives: Uncategorized

How Much Cryptocurrency Should Be in Your Portfolio?


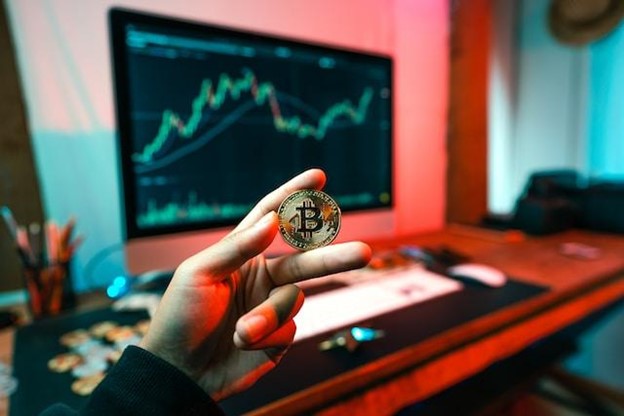
The rapid rise of cryptocurrency in investor adoption is truly astounding. An April survey by GoBankingRates involving 1,037 investors revealed that more than 40% of those who invest in cryptocurrency have dedicated 11% or beyond of their investments to it. Around 12% of the participants expressed their aspiration to hold cryptocurrency for retirement. Meanwhile, 22% seek to incorporate cryptocurrency into their investment portfolio as a diversification strategy.

It’s wise to determine the optimal proportion of cryptocurrency in your portfolio for existing cryptocurrency owners or those considering an investment in this sphere. Given cryptocurrency’s inherent volatility, achieving a balanced investment mix is crucial. Here we delve into the perspectives of some industry specialists on maintaining equilibrium in your investments amidst the unpredictability of cryptocurrencies.

How Much Crypto Should You Own?
A study conducted by Yale in 2019 suggests that dedicating between 4% and 6% of your portfolio to cryptocurrencies could be a suitable strategy. This research encompassed various cryptocurrencies, highlighting bitcoin, XRP and ether specifically.


More and more financial advisors, certified financial planners, and other finance professionals endorse a 1% and 5% crypto allocation. Notably, Rio de Janeiro in Brazil has recently invested 1% of its treasury reserves in cryptocurrency, providing a significant case study at the governmental level.

An allocation of 1% is often seen as an ideal balance. While it’s a small enough percentage to minimize the impact of a market downturn, it also allows investors to double their returns compared to portfolios without any crypto allocation. While the growing institutional investment in cryptocurrencies appears to be reducing the likelihood of a total market crash, it’s understandable that both consumers and advisors remain cautious.

Is Crypto a Risky Investment?

Most financial strategists and investment specialists concur that cryptocurrencies, including Bitcoin, pose a greater risk than conventional investment avenues. Unlike the securities available in the stock market, Bitcoin and other cryptocurrencies tend to be more hazardous investments. The inherent volatility of crypto is one reason for this. Given its relatively short existence compared to the stock market, there’s less historical data available for investors to leverage for smart portfolio building. Regulatory policies concerning crypto also remain a topic of ongoing discussion and uncertainty.

Certain cryptocurrencies can be considered a “highly unpredictable and greatly risky investment.” This characterization largely stems from the common occurrence of sharp spikes in crypto prices, often followed by abrupt depreciation in value. While these swift price movements can provide opportunities for substantial gains, they require perfect timing and can equally result in significant losses for investors.

What Makes a Good Crypto Portfolio?

An effective cryptocurrency portfolio should mirror the fundamental principles of your broader investment strategy. It ought to be diverse and align with your comfort level for risk. Invest in cryptocurrencies that you’ve thoroughly analyzed and feel confident about. It’s crucial to peruse the whitepapers of these digital currencies to gain a deeper understanding of their functionality and goals.

A well-constructed crypto portfolio allows you to weather bearish and bullish market cycles without causing undue stress or sleepless nights. Beware of overexposure or speculative bets on altcoins, as this could lead to “paper hands”, a phrase that describes investors who panic and sell at the first hint of a market downturn. You should also consider using exchange platforms that will ensure seamless currency conversion such as BTC to USD

Managing Your Crypto Portfolio

Maintaining your cryptocurrency portfolio requires a long-term outlook spanning years or even decades. Given the inherent volatility of this nascent asset class, it’s crucial to prioritize potential profits over an extended period rather than short-term gains over weeks or months.
Cryptocurrency investments are typically profitable, particularly those held for four years or more. These investments should be viewed as a commitment to a burgeoning technology rather than a quick way to amass wealth.

Frequently checking your portfolio or attempting to impeccably time the market often leads to undue stress and poor decision-making. Instead, periodic reviews and adjustments of your assets, based on your changing perspective of the market, are recommended. This approach is quite similar to managing a stock portfolio.

Endnote

If you’re considering jumping on the cryptocurrency bandwagon to profit from its popularity or seize a “once-in-a-lifetime” chance, it’s crucial not to rush. Given its unpredictable nature, most financial experts and advisors suggest allocating only a modest portion of your overall portfolio to crypto. However, some people are more at ease with the associated risk, so it all boils down to your personal risk tolerance.

The Coming Energy Abundance!?

As a new analyst you are the first to see the reports hit your desk. The executive summary says:

Our analysis shows that 100% clean electricity from the combination of solar, wind, and batteries (SWB) is both physically possible and economically affordable across the entire continental United States as well as the overwhelming majority of other populated regions of the world by 2030.

Adoption of SWB is growing exponentially worldwide and disruption is now inevitable because by 2030 they will offer the cheapest electricity option for most regions.

Coal, gas, and nuclear power assets will become stranded during the 2020s, and no new investment in these technologies is rational from this point forward.

https://www.rethinkx.com/energy-reports

Quick! Time to sell all coal, oil and gas equities and uranium.

Or is it. Critique these reports.

Next week, I will post my thoughts.

Searching for the marginal seller

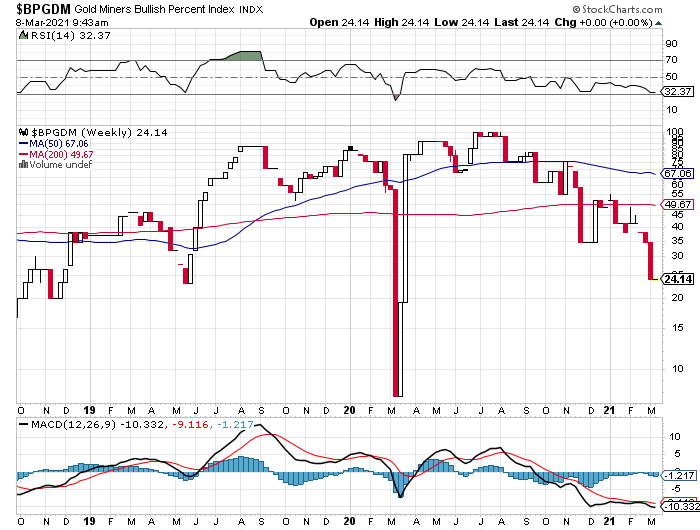
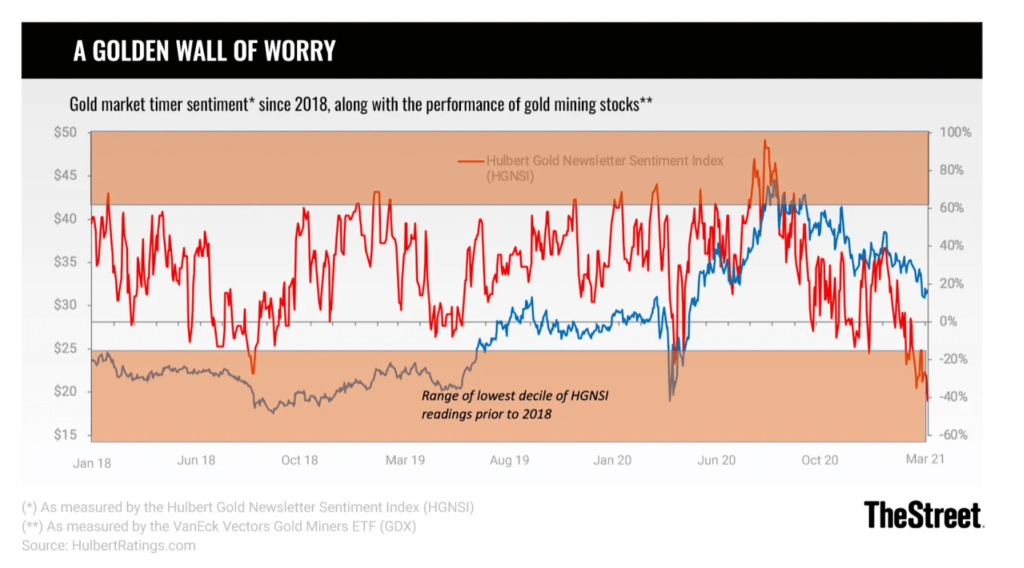
Sentiment falls to two-year lows for gold miners as shown by $BPDGM

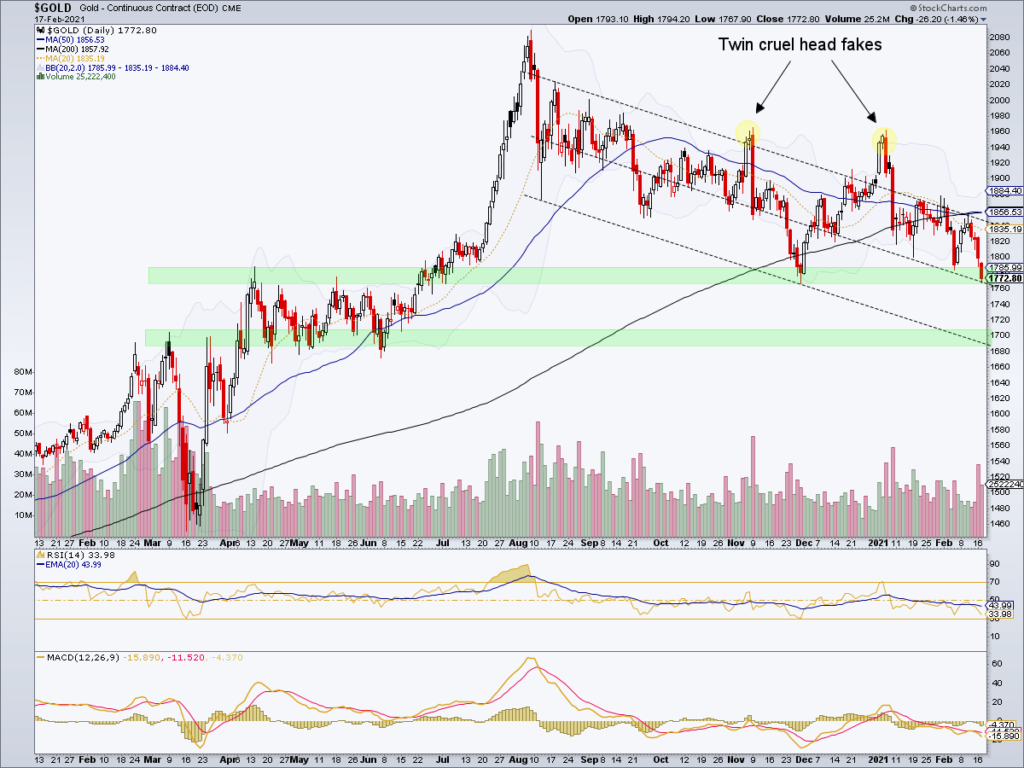
When searching for opportunity, mispriced companies, and “value” (getting more than what you pay risk-adjusted as defined by me), a good place to look is where the marginal seller has sold. Below, gold has fallen for seven months from almost $2,100 to $1,670 recently or about a 20% decline. Now there are fewer calls for $2,500 gold. Pervasive bearishness abounds.

Notables such as Mark Cuban, owner of the Dallas Mavericks said, “I hate gold. Gold is a religion. I do not see it as an alternative to currency.”. 

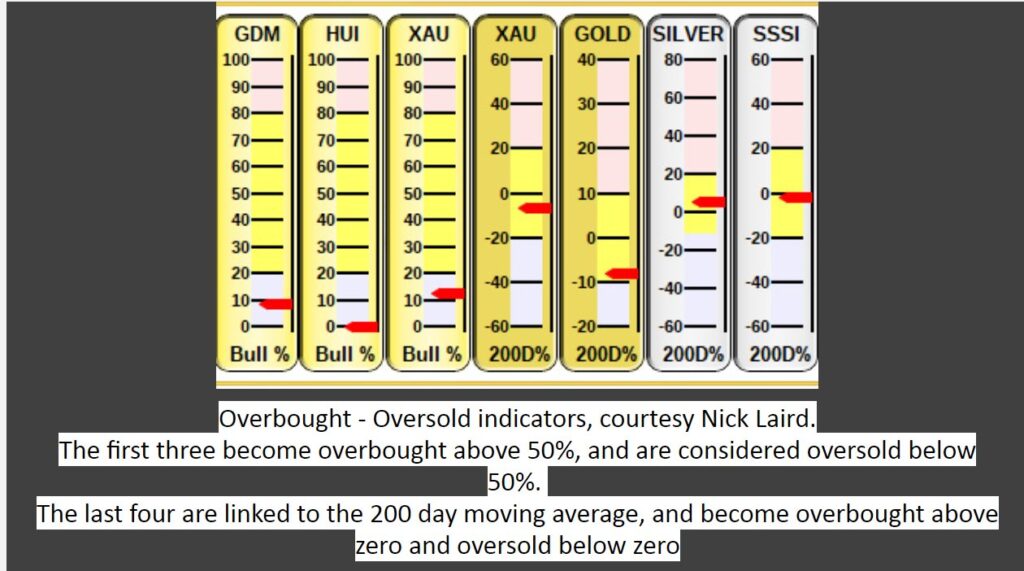
Other sentiment indicators register new lows:
Albert Edwards@albertedwards99
·#gold I was asked if there was an update to the Hulbert Gold Newsletter Sentiment Index (HGNSI). This recent post from @LawrenceLepard highlights HGNSI has slumped to MINUS 41.7%. “Only time lower since 2000 is 2013 collapse when it was -50 or so.” Wow!

Below is the Gold Optix sentiment index plumbing new lows.

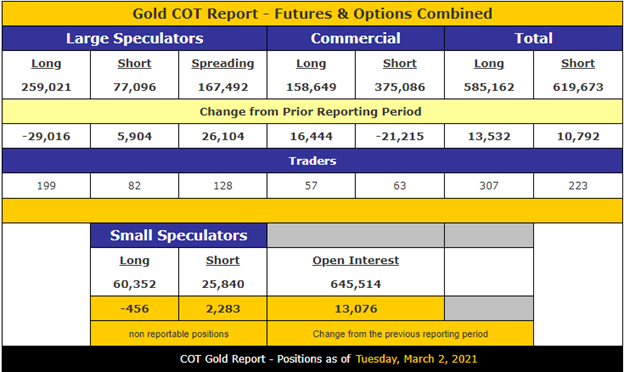
The Gold Commitment of Traders report below shows a big swing between speculators selling their long positions and adding to shorts while commercials do the reverse. An investor or trader needs to track these figures over time to place them into context. I view the figures as contrarily bullish–my opinion.

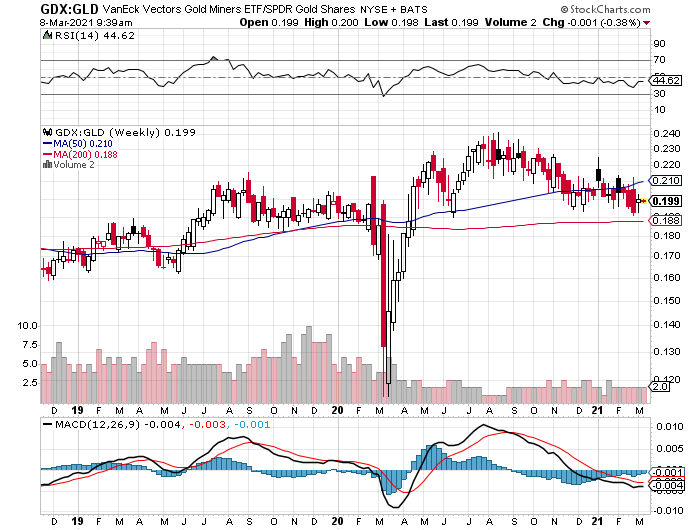
Finally, despite gold declining and bearish sentiment rising, gold miners have steadied relative to precious metals.

Gold miners (GDX) relative to gold (GLD)

All the sentiment indicators and price action of miners relative to gold seem to indicate that the market may be absorbing the most marginal seller. This is the seller who either by panic or strategy is willing to sell at the lowest price. There is no certainty that the market for gold or miners has bottomed but an investor can begin to look in this area.

March 16: added sentiment indicators. Never a timing device but shows the tilt in odds to payoff for owning gold and/or miners.

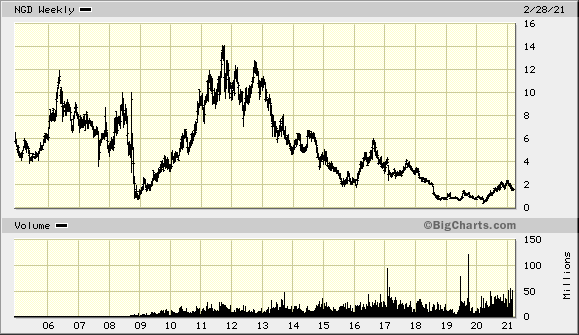
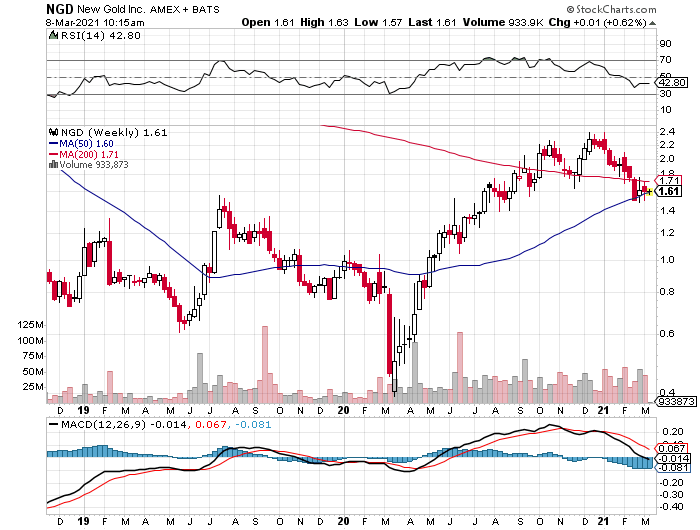
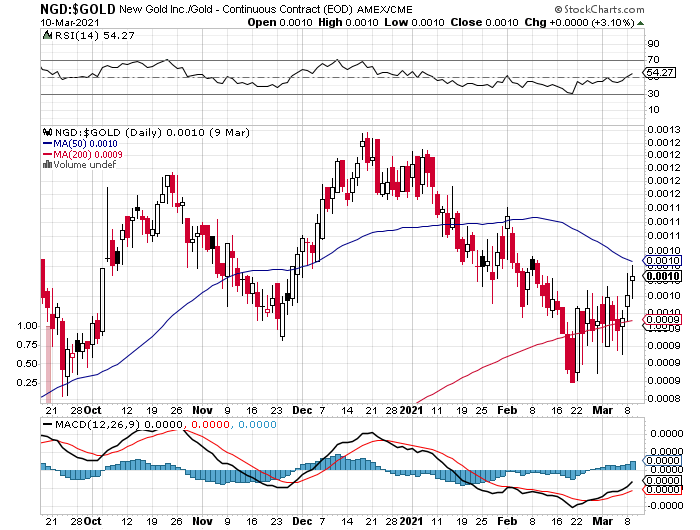
New Gold (NGD) Trading at 6 times Enterprise Value to operating cash flow.

Six times operating cash flow of $295 mil. divided into 676 mil. shares times $1.70 per share (NGD) plus $665 mil. in net debt or $1.15 bil. market cap plus net debt of $665 mil. or $1.815 bil. in enterprise value / by 295 of operating cash flow. Management estimates the company will generate $1.5 billion in free cash flow over 2021 to 2025–almost enough to cover the current market cap and repayment of total debt. The company has $490 mil. in liquidity. New Gold had gold hedges that capped their selling price at an average $1,623 per ounce. Those hedges are closed now so higher gold prices will benefit. New Gold is also leveraged to the price of Copper.

New Gold has mines in Canada or in safer jurisdictions. This seems like a bargain–and I believe it is–but there are risks. This is not a recommendation but an example of what appears in depressed markets. Also, NGD trades below $5 per share so some money managers are precluded from owning the shares. An investor should start with the presentation below (see link) and then study the financials. Look at management. Do your own work so as to learn and gain confidence because when or if NGD falls 30%, you will not know whether to add, sell, or buy? There is one obvious risk with one of the mines owned by New Gold–so know about that particular risk! And know the other risks too.

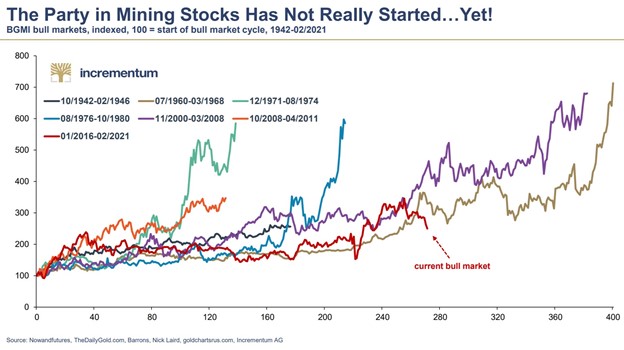
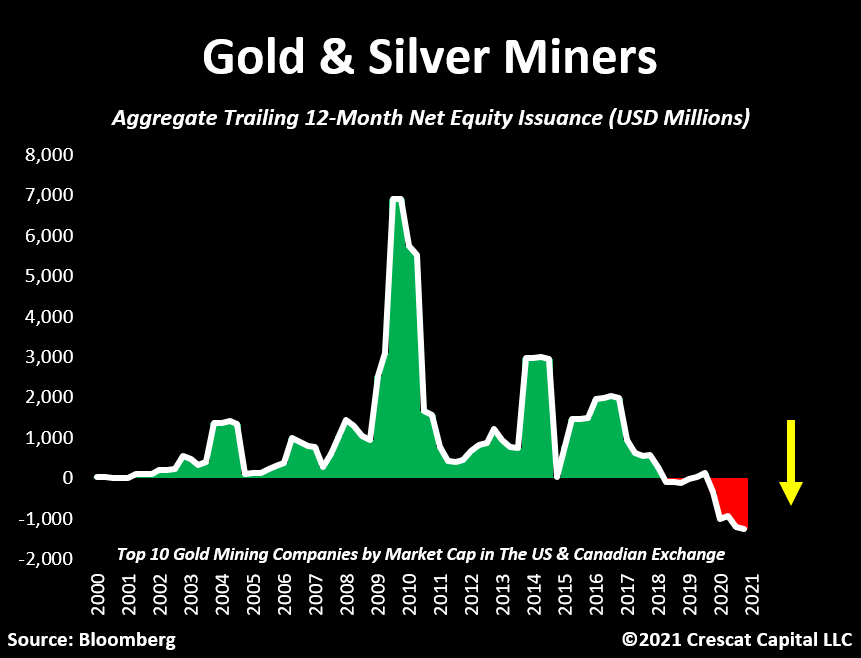
Gold miners may be in the middle of a long-term bull market. Another sign of continuation perhaps is that precious metals mining companies have become more prudent in their capital allocation as managers use growing free cash flows to retire stock as shown below

There are no certainties, of course. One simply seeks to place the odds of finding bargains in one’s favor. Good luck and good hunting!

P.S. March 12, 2021 Expect bearish headlines on gold: Don’t Expect Gold to Bounce Back Anytime Soon | Barron’s

Update on March 31st, 2021


fred hickey@htsfhickey
A normal multi-mo. correction following August gold record highs ($2065) has created many doubters. Best time to buy is at darkest sentiment moment(HGNSI -45, Ned Davis Research Gold Sentiment Composite 0% bulls) Doubts with deficit spending &money printing thru the roof? Buck up

Would you have become a millionaire in the last bull market?

Would You Have Made a Fortune in Uranium? (Part 1) – The Tide of Fortune

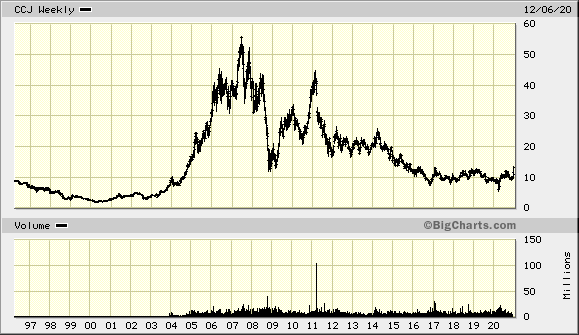
The above post is an excellent tutorial and case study on riding a volatile, cyclical bull market in Uranium Company, Cameco (and others) from 2000 when CCJ traded about $7 to $8 until mid-2007 or about $40 to $45 (you never get the exact high). That is about a 27% compounded return over seven years. Buying near the low and selling near the high–isn’t that a fantasy. Not if you were following the fundamentals and the sentiment. The hardest part is holding on until it is clearly time to sell.

The article was written by https://www.uraniuminsider.com/ who did a great job on this article. I don’t know him or his newsletter, but I collated his articles in a case study below. I highly recommend you study the case below even if you avoid investing in cyclical, commodity companies.

The case also gives you a condensed application of the capital cycle.

Thomas Kaplan, an Investor in Novagold

Mr. Kaplan is the perfect investor to study to improve your investing in deeply cyclical resource investments and to understand gold. As Mr. Kaplan explains in an interview (2017): “Gold is not someone’s liability…. Economically, we are in unchartered waters.”

His philosophy is to start with a macro theme (A long-term bull market in gold) and then locate the best asset (Novagold) to leverage that theme. He considers gold the best risk reward of any asset class. Setting aside that gold is the best asset to own during financial crises, gold will be facing a severe supply crunch since no new large deposits over 5 million ounces are being discovered much less developed. Development from discovery to production requires over 20 years.

In addition, more and more foreign jurisdictions like the Philippines or Papua New Guinea are becoming too risky to mine. Mr. Kaplan estimates the equilibrium price to incentivize new discoveries is probably $3,000 to $5,000 per ounce. I think that is too low of a price.

The patience and conviction to be successful in this type of investing are extraordinarily high. Most professional investors cannot even pretend to be as patient. Mr. Kaplan became involved in Novagold during the crisis of 2009–imagine the fear and financial stress swirling amongst investors then.

Recognizing the obvious: Intrinsic value rising well before price

From 2009 to 2019 the intrinsic value was rising as Novagold became de-risked.  The decade ticked by as Novagold obtained all the required permits, it strengthened relationships with native communities, it spun off non-core assets like Galore (copper) to Trilogy, Novagold treasury increased its cash balance to $250 million with an annual cash burn of less than $10 million, and NG’s relationship with Barrick strengthened. Few cared or paid attention. Meanwhile, many jurisdictions have become even higher risk like the Philippines, Papua New Guinea, etc.

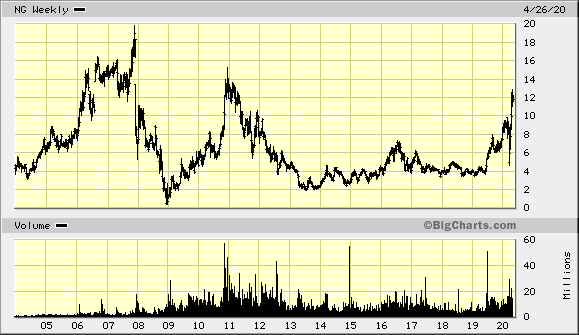
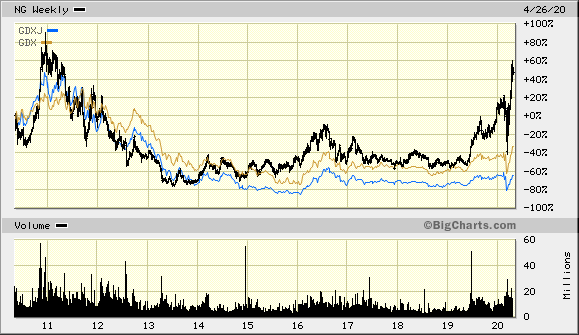
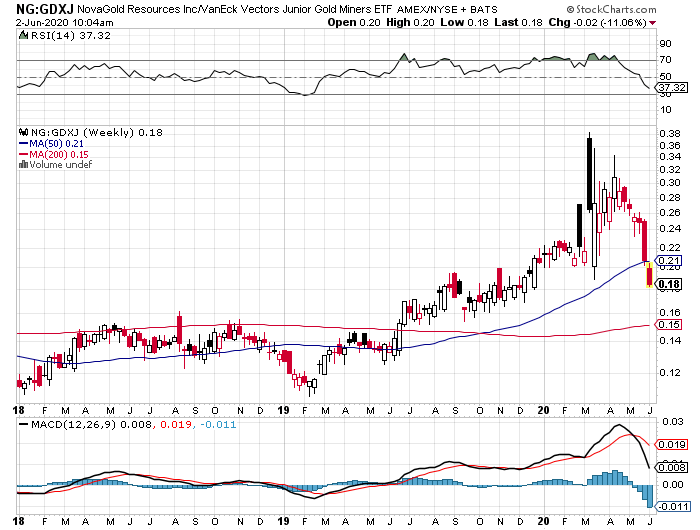
Price goes sideways while intrinsic value rises quietly.   These are the best situations to hold onto.  You just need VAST patience and to pay attention. Value accretion was occurring away from the financial statements. You would see expenses each quarter, but you would need to be aware of the permits won and the relationships strengthened. No algorithm or computer screening model will do that for you. But NG just traded as part of an index until decoupling in mid-2019.  Everything related to Novagold was increasing except the share price until one day……. Meanwhile, Mr. Kaplan held fast because of his knowledge and conviction.

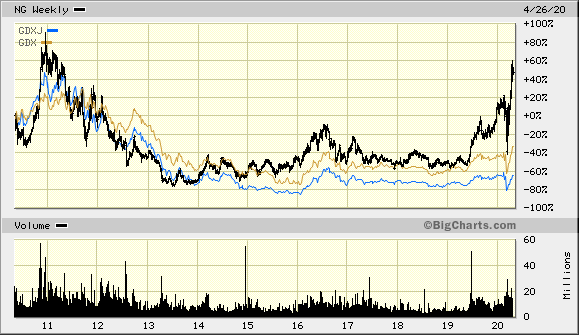
NG trades with the indexes, GDX and GDXJ, then decouples upward as price catches up with intrinsic value.

As a word of caution, this post is not a recommendation to buy Novagold even though I have been a shareholder since 2015. You should understand that Mr. Kaplan has been an investor for over 11 years through declines of 85% in NG’s share price. As an investor you might check on the statements and claims made in the annual reports listed below. If Novagold’s grade is considered outstanding, then look at the annual reports of five major miners and verify/check whether that fact checks out. Take nothing on faith so you can learn conviction.

How would you be willing to hold a investment without a huge payoff for over a decade while waiting for the market to turn to your analysis?

If you study those letters and annual reports, you will have a course in patient investing in a deeply cyclical industry and in understanding gold.

  • UPDATE 5/1/2020: 2008 Annual Report marks the entry of Electrum during the Great Financial Crisis.
  • 2012 Annual Report began the time when management change had begun in earnest with CEO Greg Lang arriving from Barrick Gold as well as divesting of assets to focus on Donlin Gold. Those actions made the company into a perpetual option on the value of gold.
  • The Tortoise and The Hare Chairman’s Letter of 2015 explains why Thomas Kaplan was (and remains) bullish towards gold.
  • Please note how consistent Mr. Kaplan’s and Novagold’s message has been over the past twelve years. The Donlin project attributes remain consistent even while the resource base increases.

Remember that Novagold (NG) as a perpetual option is highly leveraged to the price of gold and to sentiment so expect prices swings of 25% to 50% or more. Such is the requirement to being a long-term investor. My secret is not to look at the share price but once a quarter.

Short attacks are ultimately noise. Eventually, value will out.

Wall Street Never Changes

Case Study on Capital Cycle: Tidewater

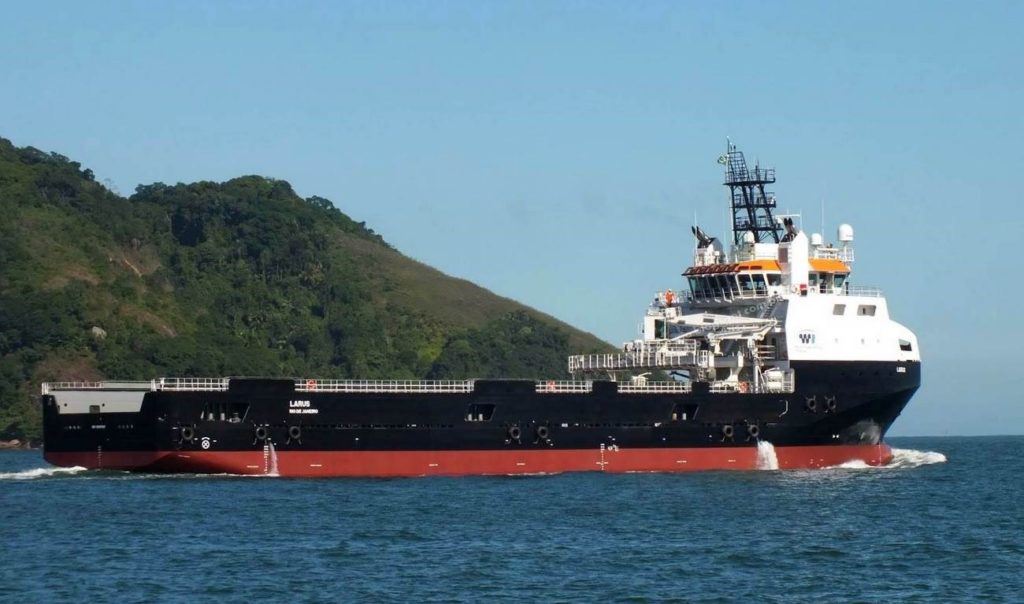
Below is a case study of the capital cycle using Tidewater as an example. This page will be updated over time. This is not an investment recommendation but an ongoing case study.

Capital Cycle Case Study: http://csinvesting.org/wp-content/uploads/2020/04/JAC-Case-Study-Capital-Cycle-and-Tidewater-1.pdf

Since Tidewater has been in business since 1955, its service is needed, but this is–at best–no more than an average business with no long-term competitive advantage. Currently, there is a trade-off between a decline in intrinsic value as time progresses without economic charter rates versus Tidewater’s competitive advantage over financially distressed competitors.

Update: 4/17/20

Tidewater filed to protect its $300 million in NOLs and $388 million in foreign tax credits. As an investor, you know that the NOLs can be worth more than $0 to worth a whole lot.

Meanwhile, Hornbeck (HOSS), a competitor filed for bankruptcy.

Update: 4/21/2020 US Crude oil near-term futures trade at a negative price for the first time in history. Natural gas is rising in price as shut-in oil wells reduce natural gas supply. What we are witnessing is a massive destruction of capital and productive capacity thanks to covid-19 and negative global interest rates. The future might require far higher oil prices. Near-term one would expect more pressure on TDW’s price because of the fear in hydrocarbon markets.

Update: 4/22/2020 TDW does not seem to be declining with oil prices–a divergence that may be signaling some change–perhaps investors are looking out at the supply destruction in oil.

http://siemoffshore.com/Default.aspx?ID=9

4/25/20: Siem Management in their 2019 Shareholder letter move from hopeful to despair. (A good sign for Tidewater). These are dark days for the OSV industry and what you typically hear about in the depths of a downcycle.

The Siem Offshore is exposed to a number of risks. One of the most important risk factors is the demand for its services. The OSV market is now in its 7th year of depressed conditions and it has taken longer to recover than earlier expected. It is highly uncertain as to when charter rates will offer sufficient earnings for full debt servicing. The Company has been able to reduce its debt substantially over the last five years. Principal payment of debt instalments in 2019 was USD99 million (2018: 195 million). The significant debt reduction has been possible due to good cooperation between the Company and its financing banks, significant shareholder support, good ship operations and disposal of non-strategic and older assets. However, the significant excess capacity in the worldwide offshore service vessel fleet has increased the competition amongst owners for any vessel requirements, thereby depressing charter rates. The imbalance of supply and demand for offshore vessels is expected to remain for some years and will continue to put pressure on the charter rates and our cash flows. Five vessels were in lay-up at year-end 2019.

4/22/2020 OUTLOOK from Siem Offshore’s Annual Report. Despair!

The collapse in the oil price and the effect of the COVID-19 on the world’s economies have created a very different operating environment for our fleet. Field developments offshore are being cancelled or postponed by our clients and there will be much less work offshore during the coming several years. The demand for our services will therefore reduce rather than increase. At the end of last year, we looked forward to a gradual recovery in offshore activities and the nearing of balance in supply and demand in the OSV sector. That hope is now gone and we brace ourselves for a downturn probably worse than we have experienced during the past few years.

The actions required to achieve the best possible outcome when
confronted with the market difficulties include consolidations between and among debt-burdened owners, such as practically all OSV owners in Norway. This is the time when owners should work together to embrace the opportunities to survive until the end of a long, dark tunnel of slow activity in the market for all of our vessels. Only by working together can the right scheduling and layup of vessels be achieved. The cost saving would be an added benefit. Most of our lending banks are lenders to several if not all of the competing OSV owners and are in the position to influence this required development. Disappointedly, the banks do not appear willing or prepared to assume this vital role.

The financial problems are currently solved independently within each company giving the owners more time to compete fiercely with each other, all to the benefit of the clients. Owners are seen to take higher risks as the clients take advantage of the desperate situations to shift operating risks from the clients to the OSV owners. The latter accepts the risks because they have nothing more to lose. Ironically, it is the banks who are exposed to the contractual downside in this new reality. This has created an artificial, unhealthy and unsustainable competitive situation in our industry.

May 17, 2020 Update. Tidewater currently trades at $4.13 or about 24% below its scrap liquidation value if we take Hornbeck’s bankruptcy filing as a guide.

Tidewater had 157 vessels operating at the end of the year. It took 4 of its active fleet to sell. So let’s take 150 vessels times $2 million per vessel (See last page on Hornbeck Bankruptcy filing below) for 300 million sales/scrap value then minus $85 million net debt for $215 liquidation value divided by 42 million shares or $5.11 per share. At $4.13, TDW trades 24% below this value.

I realize that the next twelve to eighteen months will be extremely difficult for TDW as it races to scrap excess vessels and conserve cash, but I don’t think it is a certainty that TDW will have to restructure it debt or declare bankruptcy again, but the market is pricing for extreme events ALREADY. The issue is whether to add on weakness.

The biggest risk is if financiers continue to throw good money after bad in this OSV industry. We shall see.

Update on June 3, 2020. Robotti Letter to Tidewater Board on Poison Pill https://advisors.robotti.com/blog-items/carpe-diem-read-robottis-letter-to-the-tdw-board-re-consolidation/

Capt. Sully has Lessons for Investors

These two videos give investors an overview of how important preparation is for success under extreme pressure.

Relative Values

Most investors are not aware of the improvements that miners in general have made. 1. Managements have lowered costs. 2. They have been careful on capex and acquisitions. 3. oil prices,a big input cost, have lagged the rise in gold. 4. And finally, free cash flows are increasing.
Video

Learning from other Industries