Tag Archives: Case Study

Case Study on Capital Cycle: Tidewater

Below is a case study of the capital cycle using Tidewater as an example. This page will be updated over time. This is not an investment recommendation but an ongoing case study.

Capital Cycle Case Study: http://csinvesting.org/wp-content/uploads/2020/04/JAC-Case-Study-Capital-Cycle-and-Tidewater-1.pdf

Since Tidewater has been in business since 1955, its service is needed, but this is–at best–no more than an average business with no long-term competitive advantage. Currently, there is a trade-off between a decline in intrinsic value as time progresses without economic charter rates versus Tidewater’s competitive advantage over financially distressed competitors.

Update: 4/17/20

Tidewater filed to protect its $300 million in NOLs and $388 million in foreign tax credits. As an investor, you know that the NOLs can be worth more than $0 to worth a whole lot.

Meanwhile, Hornbeck (HOSS), a competitor filed for bankruptcy.

Update: 4/21/2020 US Crude oil near-term futures trade at a negative price for the first time in history. Natural gas is rising in price as shut-in oil wells reduce natural gas supply. What we are witnessing is a massive destruction of capital and productive capacity thanks to covid-19 and negative global interest rates. The future might require far higher oil prices. Near-term one would expect more pressure on TDW’s price because of the fear in hydrocarbon markets.

Update: 4/22/2020 TDW does not seem to be declining with oil prices–a divergence that may be signaling some change–perhaps investors are looking out at the supply destruction in oil.

http://siemoffshore.com/Default.aspx?ID=9

4/25/20: Siem Management in their 2019 Shareholder letter move from hopeful to despair. (A good sign for Tidewater). These are dark days for the OSV industry and what you typically hear about in the depths of a downcycle.

The Siem Offshore is exposed to a number of risks. One of the most important risk factors is the demand for its services. The OSV market is now in its 7th year of depressed conditions and it has taken longer to recover than earlier expected. It is highly uncertain as to when charter rates will offer sufficient earnings for full debt servicing. The Company has been able to reduce its debt substantially over the last five years. Principal payment of debt instalments in 2019 was USD99 million (2018: 195 million). The significant debt reduction has been possible due to good cooperation between the Company and its financing banks, significant shareholder support, good ship operations and disposal of non-strategic and older assets. However, the significant excess capacity in the worldwide offshore service vessel fleet has increased the competition amongst owners for any vessel requirements, thereby depressing charter rates. The imbalance of supply and demand for offshore vessels is expected to remain for some years and will continue to put pressure on the charter rates and our cash flows. Five vessels were in lay-up at year-end 2019.

4/22/2020 OUTLOOK from Siem Offshore’s Annual Report. Despair!

The collapse in the oil price and the effect of the COVID-19 on the world’s economies have created a very different operating environment for our fleet. Field developments offshore are being cancelled or postponed by our clients and there will be much less work offshore during the coming several years. The demand for our services will therefore reduce rather than increase. At the end of last year, we looked forward to a gradual recovery in offshore activities and the nearing of balance in supply and demand in the OSV sector. That hope is now gone and we brace ourselves for a downturn probably worse than we have experienced during the past few years.

The actions required to achieve the best possible outcome when
confronted with the market difficulties include consolidations between and among debt-burdened owners, such as practically all OSV owners in Norway. This is the time when owners should work together to embrace the opportunities to survive until the end of a long, dark tunnel of slow activity in the market for all of our vessels. Only by working together can the right scheduling and layup of vessels be achieved. The cost saving would be an added benefit. Most of our lending banks are lenders to several if not all of the competing OSV owners and are in the position to influence this required development. Disappointedly, the banks do not appear willing or prepared to assume this vital role.

The financial problems are currently solved independently within each company giving the owners more time to compete fiercely with each other, all to the benefit of the clients. Owners are seen to take higher risks as the clients take advantage of the desperate situations to shift operating risks from the clients to the OSV owners. The latter accepts the risks because they have nothing more to lose. Ironically, it is the banks who are exposed to the contractual downside in this new reality. This has created an artificial, unhealthy and unsustainable competitive situation in our industry.

May 17, 2020 Update. Tidewater currently trades at $4.13 or about 24% below its scrap liquidation value if we take Hornbeck’s bankruptcy filing as a guide.

Tidewater had 157 vessels operating at the end of the year. It took 4 of its active fleet to sell. So let’s take 150 vessels times $2 million per vessel (See last page on Hornbeck Bankruptcy filing below) for 300 million sales/scrap value then minus $85 million net debt for $215 liquidation value divided by 42 million shares or $5.11 per share. At $4.13, TDW trades 24% below this value.

I realize that the next twelve to eighteen months will be extremely difficult for TDW as it races to scrap excess vessels and conserve cash, but I don’t think it is a certainty that TDW will have to restructure it debt or declare bankruptcy again, but the market is pricing for extreme events ALREADY. The issue is whether to add on weakness.

The biggest risk is if financiers continue to throw good money after bad in this OSV industry. We shall see.

Update on June 3, 2020. Robotti Letter to Tidewater Board on Poison Pill https://advisors.robotti.com/blog-items/carpe-diem-read-robottis-letter-to-the-tdw-board-re-consolidation/

Sandstorm Gold–So What’s it Worth?

If am able to provide an investing course, then once the fundamentals are covered, we could study cases.  Let me know your thoughts.

The Life of an Analyst

Your boss slaps these documents on your desk.  “Let me know what you think. I want a back-of-the-envelope valuation and a sixty-second summary of this business by this afternoon.”

What’s the essence of this business? Hannibal Lecter will guide you:  https://youtu.be/UhDZPYu8piQ?t=58s

Your analysis should be clear and simple:

How can the portfolio manager expect YOU to answer quickly with this deluge of info? That’s what we will learn here today.

I will post my “answer” by Tuesday of next week.   Email me at aldridge56@aol.com if you wish to share your thoughts or do so at the deep-value group at Google Groups (sign up here: http://csinvesting.org/2015/01/14/deep-value-group-at-google/) rather than post in the comments section, because readers shouldn’t be influenced by others.  No help!   This case illustrates the reality at investment firms.   Your boss dumps a 500-page prospectus and says get back to me in two hours–“What’s it worth?”

Have fun!

Valeant Case Study in Progress

wisdom

There is an ongoing battle over Valeant’s (VRX) valuation and business model between short-sellers and investors.   This opportunity allows us to improve our analysis skills and understanding of business models.  Also, how will Sequoia, an owner of over 20% of Valeant’s equity, handle their portfolio?

My first question is whether Valeant is a franchise with durable competitive advantages or a roll-up of commodity products dressed-up in a fancy industry (Pharma)?   We should use this case to learn how experienced analysts present their opposing views.

First: What’s not to like?  Valeant has rapid growth with huge profit margins? Of course, the PERFECT investment is a company that has high returns on capital and can constantly redeploy its capital at the same high returns.  The classic case would be the early (pre-2000) history of Wal-Mart (WMT) as the high returns generated from its stores could be redeployed into new stores on the borders of their regions which had economies of scale in administration, advertising, and management costs per unit of sales.  WMT did not have, for example, advantages in gross margins, but net profit margins. See WMT_50 Year SRC Chart.

What would be the source of Valeant’s high returns and competitive advantages?

Sequoia (a well-known value fund with an excellent long-term record) saw strong competitive advantages.  See their recent investor transcript:

Sequoia-Fund-Transcript-2015-August  Note the date of the transcript and the questions regarding Valeant concerning Philador and Sequoia’s 20% concentration.

Other investors (Charlie Munger, Citron) disagreed:

April 2, 2015 from www.fool.com

…..Recently, during a shareholders meeting for the Daily Journal Corporation, a newspaper where he serves as Chairman, Munger had this to say about Valeant Pharmaceuticals Intl Inc. (TSX:VRX)(NYSE:VRX): “Valeant is like ITT and Harold Geneen come back to life, only the guy is worse this time.”

What exactly does Munger mean by this?

A little history lesson

Who exactly was Harold Geneen? And what did he do at ITT that’s so infamous?

Geneen took over ITT Corp in 1959 when it was still mostly a telegraph and telephone company. After being blocked by the FCC in an attempt to buy the ABC television network in 1963, Geneen decided to diversify away from the company’s traditional business and completed more than 300 acquisitions during the decade in areas such as hotels, insurance, for-profit education, and the company that made Wonder Bread.

Geneen used cheap debt to finance these acquisitions, which later proved to be the company’s downfall. After Geneen’s retirement as CEO in 1977, subsequent CEOs spent much of the next two decades paying off the debt by selling most of Geneen’s acquisitions.

Is Valeant really comparable?

On the surface, Valeant looks like it could be pretty comparable to ITT. Since merging with Biovail in 2010, Valeant has made more than 30 different acquisitions, most of which were paid for with debt or by issuing shares.

Since the end of 2010, Valeant’s debt has skyrocketed from US$3.6 billion to US$15.3 billion. Shares outstanding have also gone up considerably from 196 million to 335 million. It’s obvious that Munger is onto something.

But on the other hand, I’m not sure Valeant is anywhere close to being as bad as ITT was. For one thing, all of the company’s acquisitions are at least in the same sector. ITT was buying up hotels and car dealerships, while Valeant is buying up pharmaceutical companies. Valeant’s efforts scale up a whole lot better than ITT’s ever did.

There’s also a bit of hypocrisy coming from Munger on this issue. Munger is actively involved in a company that does pretty much the same thing as ITT did back in the 1960s. Sure, Berkshire doesn’t use much debt or engage in hostile takeovers, but Berkshire and ITT have more in common than Munger is willing to admit. Both attempted to dominate the business world using a roll-up acquisition strategy; Buffett and Munger were just a little more patient with their plan.

But just because Munger exaggerates how bad Valeant’s acquisition spree has been doesn’t mean the stock is necessarily a buy at these levels. The company had earnings of just $2.67 per share in 2014, putting the stock at a P/E ratio of nearly 100 times. Yes, earnings are expected to grow substantially in 2015, but the outlook is simple. For the stock to continue performing, the company must continue to make acquisitions.

After making more than 30 acquisitions in just a few years, it’s hard to keep finding deals that will not only be big enough to make a difference, but will also prove to be good long-term buys. There’s so much pressure on management to keep buying that a serious misstep could be coming. If that happens, this hyped stock could head down in a hurry.

Although I don’t buy Munger’s alarmist concerns about Valeant, I agree with him on one thing. The stock just isn’t attractive at current levels.

A potential acquisition target, Allergan, Inc., points out its worries over Valeant’s business model. investor-presentation-may-27-2014-1 on VRX

Citron, a short-seller, attacks with a report: Valeant-Part-II-final-b. Valeant is another “Enron.”  Use the search box on this blog and type in Enron and follow links to review that case.  Enron never showed the profit margins that Valeant is currently showing.   NEVER take another person’s statement on faith.  Check it out for yourself. 

Valeant today (October 26th, 2015) counters Citron and answers investors’ concerns with 10-26-15-Investor-presentation-Final4 Valeant and video presentation:  http://ir.valeant.com/investor-relations/Presentations/default.aspxeep.

Ok, so what is Valeant worth?   Can you make such an assessment?  How do you think Mr. Market will weigh-in?   If you owned a 20% stake in Valeant, how would you manage the position?   What are the main issues to focus on?

This may be too difficult to analyze for many of us but we have  or will have many documents and reports to provide insights.  Remember that there are two sides to every narrative. Can we move closer to reality or the “truth”?

Note www.whalewisdom.com and type in VRX.   What type of investor owns Valeant?   Will momentum investors stick and stay?

Your comments welcome.

Sign up for Whitney Tilson’s emails on investing.  Worth a look: leilajt2+investing@gmail.com

POP QUIZ: What’s it worth? Good or bad business?

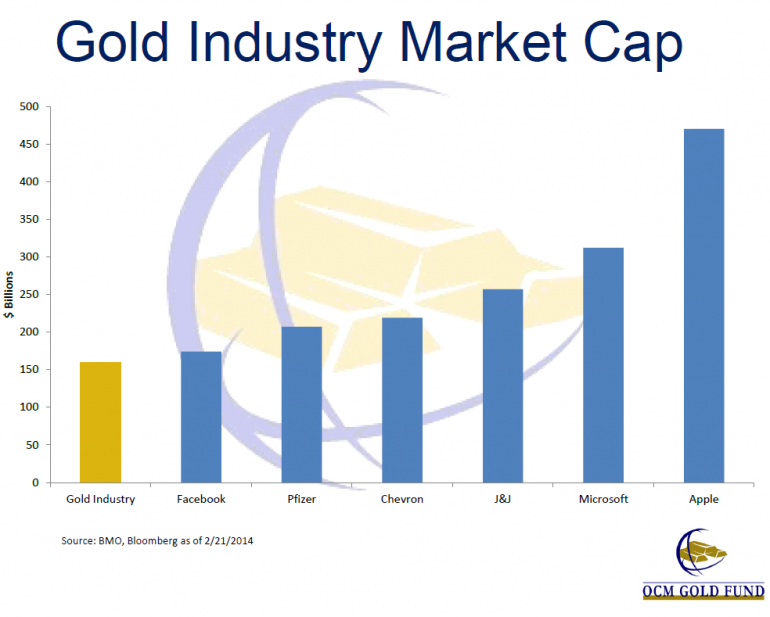
gold-industry-market-cap-relative-other-companies-ocm-gold-fund-feb-27-2014-presentation

 Case-Study-So-What-is-It-Worth  Buffett finally seeks an assistant to help him find and value companies.  You meet him at a diner in Omaha.   He slips you the above financials, then he asks you to comment.  Please take no more than 20 to 30 minutes.  Is this a good business? Why or why not? So what do YOU think it’s worth?  Should Buffett buy this Wall Street darling (at the time?). Show your back of napkin calculations and don’t spill any coffee.

The “Solution/Analysis” will be posted Friday-here.

Some people in the Deep Value course are nodding off.   Try the quiz to sharpen your thinking. If you don’t come close, you will have to meet:

Part 1: Analyzing a Gold Mining Company–Where to Start?

Idaho_Gold_Minegold mine 2

Gold mine 3gold mine


Assignment: Analyze and value a gold mining company

Mario Gabelli once suggested to a group of Columbia MBA students to become an expert in an industry. The process will take at least six months of intensive reading and research to get to a level of what you need to know and what you can ignore. Then in a year or so move on to another industry. After five or six years you will have competency in five to six different industries.   Since investing is all about context, we first need to learn about the gold (precious-metals) mining industry.

Whether you will analyze a gold mining company, a shipping firm, a title insurance business or a media company, you will need to develop an understanding of the industry within which your firm operates.

Since we do not have six months to study, we will move at an accelerated pace.

OK, so what do you need to start with and how would you begin?  Pretend that you wanted to build a mining company from scratch, how would you do it? If you were airdropped into Northern Pakistan, what would you first need after hitting the ground?

Friday, I will post my suggestions and information sources. Meanwhile, you can think and search for yourself. Eventually, we will move on to the particular company.   Don’t hesitate to post questions if you are unclear or my instructions are incomprehensible.

Good luck!

Buy, Sell or Hold? Schiller Free Finance Course

Truck Photo

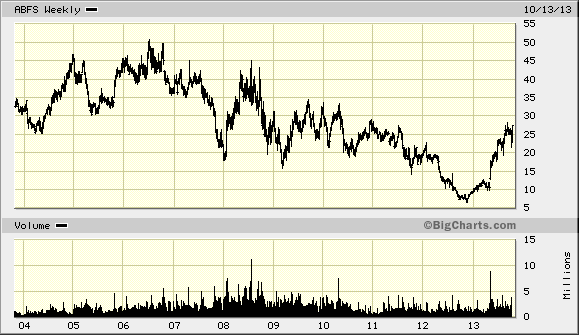
Arkansas Best Trucking

Annual 2012 Ark Best

Investor_Presentation_05-14-2013

2013_Proxy

big

Buy, Sell, or Hold?  Why? Is this a good business? Can costs be passed through to customers?  Is growth profitable?

Wrong answers will result in: http://youtu.be/6eXFxttxeaA

Free On-Line Finance Course from a Nobel Prize Winner:  http://oyc.yale.edu/economics/econ-252-11#sessions

Wmt vs. Cost Analysis; A History of Debt and Gold in Charts

Professor

Back to School!

The key is not to predict the future but to be prepared for it.–Pericles

Wal-Mart vs. Costco

Data         WMT      Cost Difference
Supercenters 3158 448
Discount Stores 561 0
Sam’s Clubs 620 0
Neighborhood Mkts 266 0
Foreign Stores 6,148 174
    10,753 622 17.3 times
Employees 2,200,000 147,000  14.97 times
Stock Keeping Units (SKUs) 70,000 3,600  19.4 times
Revs. ($bil.) 495 107       4.63 times
Return on Tot. Cap (VL) 15% 13% 2%
Ret. On Equity (VL) 22% 14.50% 7.50%
Gross Profit Margin 24% 10% 140%
Oper. Income/Margin 5.90% 2.85% 100%
Sales per square foot 437 976 110%
Book Value $25 $25 0%
Price Aug. 2 $78.55 $119.10
P/BV 3.1 4.8 55%
Debt 37000 4800
Equity 82,500 13,825
Debt to Equity 45% 35%
Est. Growth
     Sales 6.50% 8.50%
     Earnings 9% 11%

cost vs wmt

sm cost vs wmt

Comparing

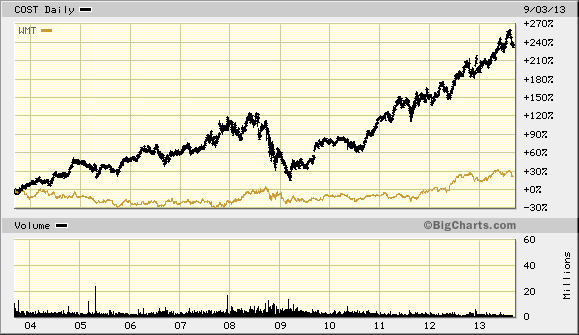
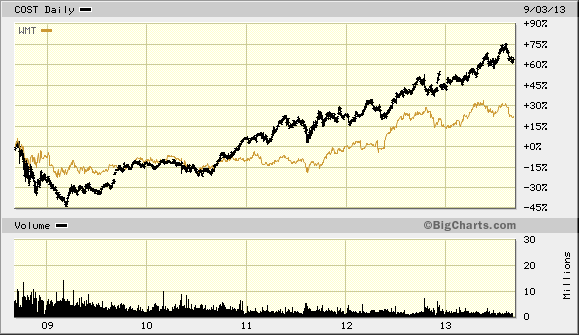
I think when you compare numbers, what strikes you is the difference in # of SKUs between retailers. WMT’s business model is much more labor intensive coupled with a lower-income customer. The squeeze on the middle class has crimped WMT.  You would think with WMT’s higher ROC and ROE compared to COST’s that WMT would not be lagging CostCo’s in share price performance but remember that COST is growing faster above its cost of capital and has more room to grow than behemoth, Wal-Mart. In other words, CostCo can redeploy more of its capital at higher rates than WMT can (grow its profits faster).

That said, the market knows this and has handicapped Costco with a higher price to book and P/E ratio than WMT’s. As an individual investor, your time might be better spent looking at smaller, more unknown companies to find mis-valuation. Also, when a company gets as big as WMT (1/2 TRILLION $ in sales), the law of large numbers sets in and the company becomes a magnet for social engineering and protest. But if you had to have me choose what company to own over the next ten years, I would choose COST because its moat is stronger (greater customer captivity) shown by its huge inventory turns/high sales per square foot plus greater PROFITABLE growth opportunities.  However, I do see WMT becoming more focused rather than expanding overseas where their local economies of scale are lessened.

My analysis is cursory, but for those that picked out the main differences, you have a better grasp of whether WMT can raise its employees’ wages to the level of Costco’s. It can not unless it reduces its SKUs and employees.

More analysis from others:

Why Wal-Mart Will Never Pay Like CostcoBloomberg writer Megan McArdle hits the nail on the head with her analysis of the situation in Why Wal-Mart Will Never Pay Like Costco.Wal-Mart is trying to move into Washington, a move that said local housing blog has not enthusiastically supported. Hence, we’ve been treated to a lot of impassioned reheatings of that old standby: “Costco shows it’s possible” for Wal-Mart to pay much higher wages. The addition of Trader Joe’s and QuikTrip is moderately novel, but basically it’s the same argument: Costco/Trader Joe’s/QuikTrip pays higher wages than Wal-Mart; C/TJ/QT have not gone out of business; ergo, Wal-Mart could pay the same wages that they do, and still prosper.Obviously at some level, this is a true but trivial insight: Wal-Mart could pay a cent more an hour without going out of business. But is it true in the way that it’s meant — that Wal-Mart could increase its wages by 50 percent and still prosper?Upper-middle-class people who live in urban areas — which is to say, the sort of people who tend to write about the wage differential between the two stores — tend to think of them as close substitutes, because they’re both giant stores where you occasionally go to buy something more cheaply than you can in a neighborhood grocery or hardware store. However, for most of Wal-Mart’s customer base, that’s where the resemblance ends. Costco really is a store where affluent, high-socioeconomic status households occasionally buy huge quantities of goods on the cheap: That’s Costco’s business strategy (which is why its stores are pretty much found in affluent near-in suburbs). Wal-Mart, however, is mostly a store where low-income people do their everyday shopping.

As it happens, that matters a lot.  Costco has a tiny number of SKUs in a huge store — and consequently, has half as many employees per square foot of store. Their model is less labor intensive, which is to say, it has higher labor productivity. Which makes it unsurprising that they pay their employees more.

But what about QuikTrip and Trader Joe’s? I’m going to leave QuikTrip out of it, for two reasons: first, because they’re a private company without that much data, and second, because I’m not so sure about that statistic. QuikTrip’s website indicates a starting salary for a part-time clerk in Atlanta of $8.50 an hour, which is not all that different from what Wal-Mart pays its workforce.

Trader Joe’s is also private, but we do know some stuff about it, like its revenue per-square foot (about $1,750, or 75 percent higher than Wal-Mart’s), the number of SKUs it carries (about 4,000, or the same as Costco, with 80 percent of its products being private label Trader Joe’s brand), and its demographics (college-educated, affluent, and older). “Within a 15–minute driving radius of a potential site,” one expert told a forlorn Savannah journalist, “there must be at least 36,000 people with four–year college degrees who have a median age of 44 and earn a combined household income of $64K a year.” Costco is similar, but with an even higher household income — the average Costco household makes more than $80,000 a year.

In other words, Trader Joe’s and Costco are the specialty grocer and warehouse club for an affluent, educated college demographic. They woo this crowd with a stripped-down array of high quality stock-keeping units, and high-quality customer service. The high wages produce the high levels of customer service, and the small number of products are what allow them to pay the high wages. Fewer products to handle (and restock) lowers the labor intensity of your operation. In the case of Trader Joe’s, it also dramatically decreases the amount of space you need for your supermarket … which in turn is why their revenue per square foot is so high. (Costco solves this problem by leaving the stuff on pallets, so that you can be your own stockboy).

Wal-Mart’s customers expect a very broad array of goods, because they’re a department store, not a specialty retailer; lots of people rely on Wal-Mart for their regular weekly shopping. The retailer has tried to cut the number of SKUs it carries, but ended up having to put them back, because it cost them in complaints, and sales. That means more labor, and lower profits per square foot. It also means that when you ask a clerk where something is, he’s likely to have no idea, because no person could master 108,000 SKUs. Even if Wal-Mart did pay a higher wage, you wouldn’t get the kind of easy, effortless service that you do at Trader Joe’s because the business models are just too different. If your business model inherently requires a lot of low-skill labor, efficiency wages don’t necessarily make financial sense.

If you want Wal-Mart to have a labor force like Trader Joe’s and Costco, you probably want them to have a business model like Trader Joe’s and Costco — which is to say that you want them to have a customer demographic like Trader Joe’s and Costco. Obviously if you belong to that demographic — which is to say, if you’re a policy analyst, or a magazine writer — then this sounds like a splendid idea. To Wal-Mart’s actual customer base, however, it might sound like “take your business somewhere else.”
Read more at http://globaleconomicanalysis.blogspot.com/2013/08/wal-mart-is-not-costco-so-why-should-it.html#s5mT9QlDRl4fqLdG.99


From www.Morningstar.com

Concentrating on fewer stock-keeping units generates buying power for Costco on par with, or perhaps even greater than, larger mass merchants. At first glance, excluding gasoline, at about $60 billion in U.S. sales Costco seems at a scale disadvantage against Wal-Mart’s WMT $265 billion domestic purchasing power. However, Costco concentrates its merchandise purchases on 3,300-3,800 active SKUs per warehouse, compared with the average 50,000-75,000 SKUs at a Wal-Mart superstore. As an illustration, if we assume a straight average, that calculates to more than $16 million in sales per SKU at Costco compared with just over $3.5 million-$5 million per SKU at Wal-Mart. Moreover, the company limits its buys to only specific, faster-selling items. Costco turns its inventories in less than 30 days. This variable cost parity with larger mass merchants, along with the little or zero mark-up requirement of its membership business model, produces price leadership for Costco on the products it chooses to sell.

Note sales per square foot: http://www.wikinvest.com/stock/Costco_Wholesale_(COST)/Data/Sales_per_sq._ft

Unlike its big-box peers, Costco’s international operations generate returns above its cost of capital. The company owns about 80% of its properties, operates its business at an EBIT margin below 3%, and is at the earlier stages of international expansion but still generates on average 12% returns on invested capital because of its low fixed asset base. In its fiscal 2012 year, just 439 domestic warehouses generated roughly $60 billion in revenue (excluding fuel). That calculates to $135 million in sales per unit, or $960 per square feet, which we estimate is about 2.3 times higher than Wal-Mart supercenters. That powerful unit model also works in international markets, where sales productivity levels remain high at $900 per square feet. As result, despite likely lacking logistical scale, returns on net assets for operations outside of North America are roughly 12%, above the company’s cost of capital. This is in contrast to the 6%-7% RONA range for Wal-Mart’s international operations over the past decade.
Economic Moat 05/09/13

We assign Costco a narrow economic moat. We base this on its business model’s loss-leader capabilities and ever-increasing buying power. Membership fees are the main driver of operating profits, so Costco has the ability to sell virtually any consumer product at wholesale rather than retail prices. This makes it very difficult for other retail concepts to compete with Costco on price. Moreover, its price leadership position is reinforced because the company concentrates its merchandise buys on much fewer and faster-turning SKUs, which generates disproportionate purchasing power for its size. Additionally, the company does not advertise and its austere warehouse format requires much lower maintenance capital expenditures. Therefore, the membership wholesale business model has a sustained cost advantage versus other retail operators that sell the same product categories.

Costco WalMart Case   The document to read

COSTCO_Why Good Jobs Are Good for Retailers_ZTon

WMT Annual Report 2013  and Costco 2012 Annual Report (7)


For those who feel they DESERVE a prize simply email me at aldridge56@aol.com with PRIZE in the subject heading.

Gold, Debt and History

Gold-Bull-Debt-Bear-in-50-Charts-by-Incrementum-Liechtenstein

Note page 10, the Stock to flow ratio for gold is 65 years compared to about a year for both oil and copper. Gold is money.

Pages 60 to 61, how Austrian Economics is applied.

Notes: I hope to post my rough draft of the CSInvesting Analysis Handbook by the end of the week.  I have a book recommendation coming…….


Case Study on Buffett’s Purchase of The Washington Post

The-Washington-Post-logo

Buffett began acquiring shares of the  Washington Post in early 1973, and by the end of the year held over 10 percent of the non-controlling “B” shares. After multiple meetings with Katherine Graham (the company’s Chairman and CEO), he joined the Post’s board in the fall of 1974.

According to Buffett’s 1984 speech The Superinvestors of Graham-and-Doddsville, in 1973, Mr. Market was offering to sell the Post for $80 million. Buffett also mentioned that you could have “…sold the (Post’s) assets to any one of ten buyers for not less than $400 million, probably appreciably more.” How did Buffett come to this value? What assumptions did he make when looking at the future of the company? Note: All numbers and details in this article are from the 1971 and 1972 annual reports and “Buffett: The Making of an American Capitalist” by Roger Lowenstein.

ANALYSIS

The purpose of this exercise is to reverse engineer Buffett’s analysis of the Washington Post Company—in other words, to construct a reasonable analysis given the facts as of 1973 that will lead us to the same conclusion Buffett arrived at.

READ more………..Washington_Post)Buffett Analysis (Thanks to a reader)

and 1972 Annual Report: Washington_Post)Buffett Analysis

Cisco (CSCO) Case Study; The Lord of Dark Matter

SLAP

Next the statesmen will invent cheap lies, putting the blame upon the nation that is attacked (Syria), and every man will be glad of those conscience-soothing falsities, and will diligently study them, and refuse to examine any refutation of them; and thus he will by and by convince himself that the war is just, and will thank God for the better sleep he enjoys after this process of grotesque self-deception.” –Mark Twain

“When the rich make war, it is the poor that die.”–Jean-Paul Sartre

Case Study of Cisco:

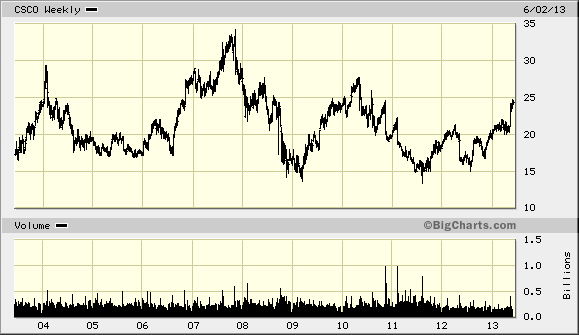
CSCO Chart

Case Study on Cisco Third Quarterly Earnings  (includes 2012 for comparison purposes).  Instructions and questions in the document.

CSCO_VL   (for reference) CSCO March 2013 Qtr Report

Please explain what you see.

The Lord of Dark Matter

Fleckenstein:  “Probably anyone who listens to your wonderful interviews already understands that money printing can’t solve anything … Most recently the housing bubble led to the collapse in 2008/2009, and now we’ve got QE of biblical proportions being foisted upon us by the Fed, BOJ (Bank of Japan), Swiss National Bank, and probably the BOE (Bank of England) soon, etc.

The irony of it all is that 5 years into zero rates, and America alone (with) $5 or $6 trillion of deficit spending, the economy is still crummy.  No one ever says, ‘Why is that?’  Well, the reason is because money printing doesn’t work.”

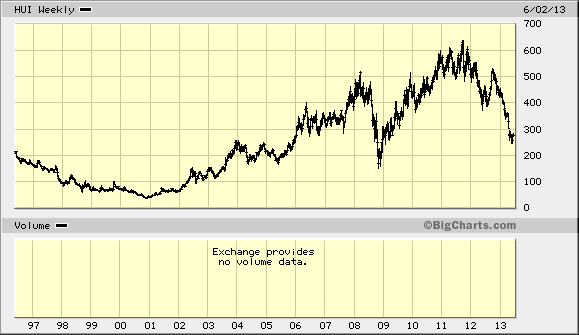
….Everybody and his brother is bearish.  I get sent two articles a day about some knucklehead who’s bearish on gold.  Well, you know what?  They are all bearish for the same two reasons:  The chart looks bad, and the price is wrong.  Like they know what the price (should be).  How do any of us know what the price is supposed to be?  It’s just a price.

Click the link below to hear the twelve-minute interview:

http://www.kingworldnews.com/kingworldnews/Broadcast/Entries/2013/6/6_Bill_Fleckenstein.html

HUI CHART

Serial Bubbles: 

http://www.zerohedge.com/news/2013-06-06/why-serial-asset-bubbles-are-now-new-normal


P.S. I have been a bit swamped with work, so I will post next week. Be well and BE CAREFUL!


Apple (AAPL) 100 to 1 in the Stock Market

Apple

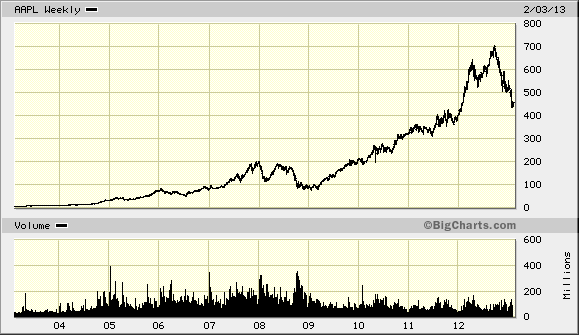
After buying Apple during the depths of the Tech Bubble Bust in 2003 around $6.94, I recently had to sell about ten years later around $700 for a compound annual return over 10 years of 58.5%. Eat your heart out Munger, Buffett, Soros, Graham, Tudor Jones, etc., etc.

And now what? 

Ok, Ok, I live in fantasy.  A friend recently said that he wished he had sold his Apple after buying it last year. Coulda, shoulda, woulda doesn’t advance your skills as an investor. What can we learn A Priori (before the fact) to help us as investors in finding and or managing our investments?  What lessons can be gleaned from Apple’s history? In Part 2: We will begin to prepare our case study file on Apple.