Tag Archives: Graham

The Stoics and Investing; Volatility and the Prisoner’s Dilemma

dionges

The Stoics

Stoics understood that if negative emotions such as anger, envy, greed, fear, and grief plague your life, then soundness and peace of mind will elude you. Serentiy in the midst of adversity–which is hardly the same thing as the modern, Western and secular notion of “happiness”–is a necessary condition of a well-lived life.

nov15_newsletter-1 How the Stoic Philosophers influenced Ben Graham

feb16_newsletter-2 Part 2

Volatility

Artemis-Q32015-Volatility-and-Prisoners-Dilemma

DEEP VALUE Videos on Net/Nets and Investing

Closing Arg

How is it possible that an issue with the splendid records of Tonopah Mining should sell at less than the company’s cash assets alone? Three explanations of this strange situation may be given. The company’s rich mines at Tonopah are known to be virtually exhausted. At the same time the strenuous efforts of the Exploration Department to develop new properties have met with but indifferent success. Finally, the drop in the price of silver last year has provided another bearish argument. It is this combination of unfavorable factors which has carried the price down from $7  1/8 in 1917 to its present low of $1  3/8 in 1923.

Granting that the operating outlook is uncertain, one must still marvel at the triumph of pessimism which refused to value the issue at even the amount of its cash and marketable investments; particularly since there is every reason to believe that the company’s holdings in the Tonopah and Goldfield railroad, are themselves intrinsically worth the present selling price. (Ben Graham on Investing)

VIDEOS

Marty Whitman criticizes Graham and Net Nets (3 minutes Must see!)

Marty Whitman: They Just Don’t Get it.  (23 minutes) Marty says many analysts on Wall Street do not understand credit analysis.   We will explore later in this course whether the quality of credit provides a better assessment of the true cost of capital for a firm rather than “beta.”

One investor’s experience investing in Net/Nets (3 minutes)

Net/nets as value traps (5 minutes)

Good advice on behavioral investing (3.5 minutes)

Prof. Greenwald on UGLY and Cheap or Graham’s Search Strategy (8 minutes)

Greenwald on the Balance Sheet (risk of financials) (10 minutes)

Benjamin Graham on Growth Stock Investing

utopia

Ben Graham on Growth Stock Investing

We last studied Ben Graham’s thoughts on growth stock investing here: http://wp.me/p2OaYY-1se . I suggest studying the best mind in finance past or present. Think about how he approached investing problems, especially the most difficult paradox of all–how to value growth.

The complete chapter (Chapter 39) on growth stock investing by Graham in the 4th Edition of Security Analysis: Newer Methods for Valuing Growth Stocks_1962_Security AnalysisDouble-click on the link to download the documents.

For additional thoughts on valuing growth go here:Growth in 2nd Edition and Ben_Graham_and_the_Growth_Investor_Bryant_College_041008

A Method of Valuing Growth Stocks

Growth Stocks and the Petersburg Paradox

Growth what is it good for and ROIC

What you didn’t know about Value Investing_Skagen

Let me know what you learned………….


Graham on Growth-Stock Investing Part II

Part 1 of Graham’s Chapter 39 Newer Methods for Valuing Growth Stocks (Security Analysis 4th Ed.: http://wp.me/p2OaYY-1qQ

Also, what Graham said prior to this chapter on growth-stock investing:Growth in 2nd Edition

We will have another valuation case study next post to break-up this fusty theory.   Read on.

Part 2: Valuation of DJIA in 1961 by this method.


In a 1961 article, Molodovsky selected 5 percent as the most plausible growth rate for DJIA in 1961- 1970. This would result in a ten-year increase of 63 percent, raise earnings from a 1960 “normal” of say, $35 to $57, and produce a 1970 expected price of 765, with a 1960 discounted value of 365. To this must be added 70 percent of the expected ten-year dividends aggregating about $300—or $210 net. The 1960 valuation of DJIA, calculated by this method, works out at some $575. (Molodovsky advanced it to $590 for 1961.)

Similarity with Calculation of Bond Yields

The student should recognize that the mathematical process employed above is identical with that used to determine the price of a bond corresponding to a given yield, and hence the yield indicated by a given price. The value, or proper price, of a bond is calculated by discounting each coupon payment and also the ultimate principal payment to their present worth, at a discount rate of required return equal to the designated yield. In growth-stock valuation the assumed market price in the target year corresponds to the repayment of the bond at par at maturity.

Mathematical Assumptions Made by Others

While the calculations used in the DJIA example may be viewed as fairly representative of the general method, a rather wide diversity must be noted in the specific assumptions , or “parameters,” used by various writers. The original tables of Clendenin and Van Cleave carry the growth-period calculations out as far as 60 years. The periods actually assumed in calculations by financial writers have included 5 years (Bing) , 10 years (Molodovsky and Buckley), 12 to 13 years (Bohmfalk), 20 years (Palmer and Burrell), and up to 30 years (Kennedy) . The discount rate has also varied widely –from 5 percent (Burrell) to 9 percent (Bohmfalk).

The Selection of Future Growth Rates

Most growth-stock valuers will use a uniform period for projecting future growth and a uniform discount or required-return rate, regardless of what issues they are considering (Bohmfalk, exceptionally divides his growth stocks into three quality classes, and varies the growth period between 12 and 13 years, and the discount rate between 8 and 9 percent, according to class.) But the expected rate of growth will of course vary from company to company. It is equally true that the rate assumed for a given company will vary from analyst to analyst.
It would appear that the growth rate for any company could be established objectively if it were based entirely on past performance for an accepted period. But all financial writers insist, entirely properly, that the past growth rate should be taken only as one factor in analyzing a company and cannot be followed mechanically in setting the growth rate for the future. Perhaps we should point out, as a cautionary observation, that even the past rate of growth appears to be calculated in different ways by different analysts.

Multiplier Applied to “Normal Earnings”

The methods discussed produce a multiplier for a dollar of present earnings. It is applied not necessarily to the actual current or recent earnings, but to a figure presumed to be “normal”—i.e., to the current earnings as they would appear on a smoothed-out earning curve. Thus the DJIA multipliers in 1960 and 1961 were generally applied to “trend-line” earnings which exceeded the actual figures for those years—assumed to be “subnormal.”

Dividends vs. Earnings in the Formulas. A Simplification

The “modern” methods of growth—stock valuations represent a considerable departure from the basic concept of J.B. Williams that the present value of a common stock is the sum of the present worths of all future dividends to be expected from it. True, there is now typically a ten-to-twenty – year dividend calculation, which forms part of the final value. But as the expected growth rate increased from company to company, the anticipated payout tends also to decrease, and the dividend component loses in importance against the target year’s earnings.

Possible variations in the expected payout will not have a great effect on the final multiplier. Consequently the calculation process may be simplified by assuming a uniform payout for all companies of 60 percent in the next ten years. If T is the tenth-year figure attained by $1 of present earnings growing at any assumed rate, the value of the ten-year dividends works out at about 2.1 + 2.1 T. The present value of the tenth-year market price works out at 48 percent of 13.5T, or about 6.5T. ? Hence the total value of $1 of present earnings –or the final multiplier for the shares—would equal 8.6T + 2.1.

Table 39-1 gives the value of T and the consequent multipliers for various assumed growth rates.

Growth Rate Tenth-year earnings (T) Multiplier of present earnings (8.6T + 2.1)
2.5%     $1.28      13.1x
4.0          1.48       14.8x
5.0          1.63       16.1x
6.0          1.79       17.5x
7.2          2.00      19.3x
8.0         2.16       20.8x
10.0       2.59       24.4x
12.0       3.11        28.8x
14.3       4.00       36.5x
17.5       5.00        45.1x
20.0      6.19         55.3x

These multipliers are a little low for the small growth rates, since they assume only a 60% payout. By this method the present value is calculated entirely from the current earnings and expected growth; the dividend disappears as a separately calculated factor. This anomaly may be accepted the more readily as one accepts also the rapidly decreasing importance of dividend payments in the growth-stock field.
To be continued……

An Apparent Paradox in Growth Stock Valuations

Graham on Growth Stock Investing Part 1; Readings on Hyperinflation

Graham said that investors should stay away from growth stocks when their normalized P/Es go above 25. On the other hand, when the product of a stock’s normalized P/E and its price-to book ratio is less than 22.5—Normalized P/E x (price/book) is less than 22.5—it is at least a good value. So, if a normalized P/E is below 14 and the price/book is below1.5, the stock should be attractive.

One of the common criticisms made of Graham is that all the formulas in the 1972 edition of The Intelligent Investor are antiquated.  The best response is to say, ”Of course they are!” Graham constantly retested his assumption and tinkered with his formulas, so anyone who tries to follow them in any sort of slavish manner is not doing what Graham himself would do, if he were alive today.  —Martin Zweig

We continue our discussion from the last post: http://wp.me/p2OaYY-1pv

Graham on Growth Stock Investing 

Graham displayed extraordinary skill in hypothesis testing. He observed the financial world through the eyes of a scientist and a classicist, someone who was trained in rhetoric and logic. Because of his training and intellect, Graham was profoundly skeptical of back-tested proofs. And methodologies that promote the belief that a certain investing approach is superior while another is inferior. His writing is full of warnings about time-period dependency….Graham argued for slicing data as many different ways as possible, across as many different periods as possible, to provide a picture that is likely to be more durable over time and out of sample.

Now we want to hear what Ben Graham has to say about valuing growth.  Graham later described his way of thinking as “searching, reflective, and critical.” He also had “a good instinct for what was important in a problem….the ability to avoid wasting time on inessentials….a drive towards the practical, towards getting things done, towards finding solutions, and especially towards devising new approaches and techniques.” (Source: The Memoirs of the Dean of Wall Street, 1996). His famous student, Warren Buffett, sums up Graham’s mind in two words: “terribly rational.”

Graham in the Preface to Security Analysis, 4th Edition

We believe that there are sound reasons for anticipating that the stock market will value corporate earnings and dividends more liberally in the future than it did before 1950. We also believe there are sound reasons for giving more weight than we have in the past to measuring current investment value in terms of the expectations of the future. But we recognize that both views lend themselves to dangerous abuses.  The latter has been a cause of excessively high stock prices in past bull market. However, the danger lies not so much in the emphasis on future earnings as on a lack of standards used in relating earnings growth to current values. Without standards no rational method of value measurement is possible.

Editor:  Note that when Graham wrote those words (1961/62) the bond yield/stock yield ratio was changing. In the early 1940s and 1950s for example, stock dividend yields were fully twice AAA bond yields, meaning that investors were only willing to pay half as much for one dollar of stock income as they were willing to pay for one dollar of bond income. In 1958, however, stock and bond yields were equal, meaning investors were at that time willing to pay just as much for a dollar of stock income as for a dollar of bond income.  And in recent years, investors have come to think so highly of equities, that they are now (March 1987) willing to pay three times as much for a dollar of stock income as they are for a dollar of bond income.   The main points you should extract from this and the following posts on Graham’s discussion of growth stock investing is his thinking process.  Graham was adaptable. Ironically, Graham was known for his net/net investing but he made most of his money owning GEICO.

Newer Methods for Valuing Growth Stocks (Chapter 39 of Security Analysis, 4th Ed.)

PART 1 of 4 (entire article to be posted as a pdf next week)

Historical Introduction

We have previously defined a growth stock as one which has increased its per-share for some time in the past at faster than the average rate and is expected to maintain this advantage for some time in the  future. (For our own convenience we have defined a true growth stock as one which is expected to grow at the annual rate of at least 7.2%–which would double earnings in ten years, if maintained—but others may set the minimum rate lower.) A good past record and an unusually promising future have, of course, always been a major attraction to investors as well as speculators.  In the stock markets prior to the 1920s, expected growth was subordinated in importance, as an investment factor, to financial strength and stability of dividends. In the late 1920s, growth possibilities became the leading consideration for common stock investors and speculators alike. These expectations were though to justify the extremely high multipliers reached for the most favored issues. However, no serious efforts were then made by financial analysts to work out mathematical valuations for growth stocks.

The first detailed basis for such calculations appeared in 1931—after the crash—in S.E. Guild’s book, Stock Growth and Discount Tables. This approach was developed into a full-blown theory and technique in J.B. William’s work, The Theory of Investment Value, published in 1938. The book presented in detail the basic thesis that a common stock is worth the sum of all its future dividends, each discounted to its present value. Estimates of the rates for future growth must be used to develop the schedule of future dividends, and from them to calculate total recent value.

In 1938 National Investor’s Corporation was the first mutual fund to dedicate itself formally to the policy of buying growth stocks, identifying them as those which had increased their earnings from the top of one business cycle to the next and which could be expected to continue to do so. During the next 15 years companies with good growth records won increasing popularity, but little effort at precise valuations of growth stocks was made.

At the end of 1954 the present approach to growth valuation was initiated in an article by Clendenin and Van Cleave, entitled “Growth and Common Stock Values.”[1] This supplied basic tables for finding the present value of future dividends, on varying assumptions as to rate and duration of growth, and also as to the discount factor. Since 1954 there has been a great outpouring of articles in the financial press—chiefly in the Financial Analysts Journal—on the subject of the mathematical valuation of growth stocks. The articles cover technical methods and formulas, applications to the Dow-Jones Industrial Average and to numerous individual issues, and also some critical appraisals of growth-stock theory and of market performance of growth stocks.

In this chapter we propose: (1) to discuss in as elementary form as possible the mathematical theory of growth-stock valuation as now practiced; (2) to present a few illustrations of the application of this theory, selected from the copious literature on the subject; (3) to state our views on the dependability of this approach, and even to offer a very simple substitute for its usually complicated mathematics.

The “Permanent – growth-rate” Method

An elementary-arithmetic formula for valuing future growth can easily be found if we assume that growth at a fixed rate will continue in the indefinite future. We need only subtract this fixed rate of growth from the investor’s required annual return; the remainder will give us the capitalization rate for the current dividend.

This method can be illustrated by a valuation of DJIA made in a fairly early article on the subject by a leading theoretician in the field.[2]  This study assumed a permanent growth rate of 4 percent for the DJIA and an over-all investor’s return (or discount rate”) of 7 percent. On this basis the investor would require a current dividend yield of 3 percent, and this figure would determine the value of the DJIA. For assume that the dividend will increase each year by 4 percent, and hence that the market price will increase also by 4 percent. Then in any year the investor will have a 3 percent dividend return and a 4 percent market appreciation—both below the starting value—or a total of 7 percent compounded annually. The required dividend return can be converted into an equivalent multiplier of earning by assuming a standard payout rate. In this article the payout was taken at about two-thirds; hence the multiplier of earnings becomes 2/3 of 33 or 22.[3]

It is important for the student to understand why this pleasingly simple method of valuing a common stock of group of stocks had to be replaced by more complicated methods, especially in the growth stock field. It would work fairly plausibly for assumed growth rates up to say, 5 percent. The latter figure produces a required dividend return of only 2 percent, or a multiplier of 33 for current earnings, if payout is two-thirds. But when the expected growth rate is set progressively higher, the resultant valuation of dividends or earnings increases very rapidly. A 6.5% growth rate produces a multiplier of 200 for the dividend, and a growth rate of 7 percent or more makes the issue worth infinity if it pays any dividend. In other words, on the basis of this theory and method, no price would be too much to pay for such common stock.[4]

A Different Method Needed.

Since an expected growth rate of 7 percent is almost the minimum required to qualify an issue as a true “growth stock” in the estimation of many security analysts, it should be obvious that the above simplified method of valuation cannot be used in that area. If it were, every such growth stock would have infinite value. Both mathematics and prudence require that the period of high growth rate be limited to a finite—actually a fairly short—period of time. After that, the growth must be assumed either to stop entirely or to proceed at so modest a rate as to permit a fairly low multiplier of the later earnings.

The standard method now employed for the valuation of growth stocks follows this prescription. Typically it assumes growth at a relatively high rate—varying greatly between companies –for a period of ten years, more or less. The growth rate thereafter is taken so low that the earnings in the tenth of other “target” year may be valued by the simple method previously described. The target-year valuation is then discounted to present worth, as are the dividends to be received during the earlier period. The two components are then added to give the desired value.

Application of this method may be illustrated in making the following rather representative assumptions: (1) a discount rate, or required annual return of 7.5%;[5] (2) an annual growth rate of about 7.2% for a ten-year period—i.e., a doubling of earnings and dividends in the decade; (3) a multiplier of 13.5% for the tenth year’s earnings. (This multiplier corresponds to an expected growth rate after the tenth year of 2.5%, requiring a dividend return of 5 percent. It is adopted by Molodovsky as a “level of ignorance” with respect to later growth. We should prefer to call it a “level of conservatism.” Our last assumption would be (4) an average payout of 60 percent. (This may well be high for a company with good growth.)

The valuation per dollar of present earnings, based on such assumptions, works out as follows:

  1. Present value of tenth year’s market price: The tenth year’s earnings will be $2, their market price 27, and its present value 48 percent of 27, or about $13.
  2. Present value of next ten years’ dividends: These will begin at 60 cents, increase to $1.20, average about 90 cents, aggregate about $9, and be subject to a present-worth factor of some 70 percent –for an average waiting period of five years. The dividend component is thus worth presently about $6.30.
  3. Total present value and multiplier: Components A and B add up to about $19.30, or a multiplier of 19.3 for the current earnings.


[1] Journal of Finance, December 1954

[2] See N. Molodovskiy, “An appraisal of the DJIA.” Commercial and Financial Chronical, Oct. 30, 1958

[3] Molodovsky here assume a “long-term earning level” of only $25 for the unit in 1959, against the actual figure of $34. His multiplier of 22 produced a valuation of 550. Later he was to change his method in significant ways, which we discuss below.

[4] David Durand has commented on the parallel between this aspect of growth stock valuation and the famous mathematical anomaly known as the “Petersburg Paradox.”

[5] Molodovsky’s later adopted this rate in place of his earlier 7 percent, having found that 7.5% per year was the average over-all realization by common-stock owners between 1871 and 1959. It was made up of a 5 percent average dividend return and a compounded annual growth rate of about 2.5% percent in earnings, dividends, and market price.

Part 2: Valuation of DJIA in 1961 by This Method…….stay tuned.


HYPERINFLATION

Audio Interview: http://www.econtalk.org/archives/2012/10/hanke_on_hyperi.html

A History of Hyperinflation Hanke on Hyperinflations

Great Hyperinflations in World History

October 26 2012 3 Trillions Reasons for Concern   (Conditions today)

Opportunities hard to find: http://www.gannonandhoangoninvesting.com/

Valuation: Valuing Growth and the Petersburg Paradox

Growth and value investing are joined at the hip. –Warren Buffett

The one and absolute truth I have learned about investing–and it is the only one–is that long-range success comes not from any simple rule or rules that can be followed by everyone but only from the most rigorous pursuit of disciplines designed to neutralize the emotional pressures that inevitably descent from time to time upon anyone who is responsible for investing other people’s money.

Those disciplines must be self-evolved because we all have different strengths and weaknesses. the things they have in common are (1) defining precisely what we are trying to do; (2) clearly understanding the reasons for the strategy; (3) recognizing in advance what problems will sooner or later accompany the strategy–for there will always be such problems’ and (4) developing the strength to “stay the course” given during troubled times. Successful investing requires constant inquisitiveness about the new and everlasting, open-minded re-examination of the old. The latter process is more difficult than the former. Not many of us are willing and able to accept the tough disciplines that are involved and not many achieve long-term investment success.  –Robert R. Barker, an investor who compounded capital at about a 25% annual rate during the 1950s and 1960s. (1979 Speech)

A Journey to Learn Valuation

I will first focus on how to value growth stocks. There is no promise that we will discover an answer, but we will study the investing greats and their original comments to find our way. Many “great” or famous investors have floundered on the shoals of growth investing. Like Bill Miller: http://executivesuite.blogs.nytimes.com/2008/09/08/bill-millers-really-bad-bet/. 

Humbly, we begin by studying the problem of using high and PERPETUAL growth rates when valuing a business.  When g is = to r, the result is an absurdity.

 The Dividend Discount Model

Where:

D1 (Estimate of next year’s dividend) = Current annual dividend * (1 + g)
r (Required Rate of Return for the Stock) = Real Risk Free Rate + (Market Return – Real Risk Free Rate) * Beta of Stock
Real Risk Free Rate = 52-Week T-Bill Yield**
Market Return = Estimate for the stock market’s return in the next year
g (Dividend Growth Rate) = Estimate for the stock’s dividend growth rate (you may calculate g by using the growth of the dividend in the past)

** 52-Week T-Bill Yield – You can find the yield by going to the U.S. Treasury Direct website, selecting the most recent year under auction date > 52-week bills > PDF of the latest auction results.

The Petersburg Complex

This paper by David Durand is a famous article that Ben Graham refers often to in his writings. Growth Stocks and the Petersburg Paradox  If you read only one article from this post, read that. To emphasize the importance of the above article, here is where others have analyzed the article St Petersburg Paradox and Tech Stocks 2000 and St Petersburg Paradox.

Then articles discussing how investors fool themselves: The_Importance_of_Expectations_–_August_2012 and Bubbles and Growth

Growth what is it good for and ROIC

The Dangers of Applying Discounted Cash Flow Models

Ben_Graham_and_the_Growth_Investor_Bryant_College_041008

Dangers of DCF_Mortier and CommonErrors

………….NEXT I will post Graham’s discussion on valuing growth stocks.


Just Show ME the Money

For those readers who lack the patience to study theory and who say, http://youtu.be/mBS0OWGUidc?t=37s There are other blogs for you to read: http://www.oldschoolvalue.com/blog/

52 Techniques for Accounting Fraud _ Jae Jun

One of my favorite blogs: www.greenbackd.com


Investor Optimism; Good News for Introverts; Men vs. Women

“The intelligent investor is a realist who sells to optimists and buys from pessimists.” ~ Benjamin Graham, Jason Zweig in The Intelligent Investor, Rev. Ed.

Editor: Great advice! Now, how do we act on it? See the articles below and view the short videos at the end of this post.

Look who bought Facebook:http://www.youtube.com/watch?v=wPvF97_q00s&feature=related  OUCH!  Please, no small children should see this video.

From www.marketpsych.com

As a psychiatrist I’ve born witness to many extremes of mood.  I’ve tried to steer manic venture capitalists away from spending their life savings on cocaine and sports cars.  And on the other extreme I’ve born witness to the deep pessimism and despair of suicidal clients, trying to help them choose life over oblivion.  My efforts are not always successful, and I’ve learned a lot about the limits of rationality when faced with extremes of mania and despair.  At both extremes many of the people I’ve worked with are highly intelligent and believe they are acting with perfect rationality.  Yet despite their innate intelligence, deeper emotions occasionally sweep away their anchor to reality.

In Ben Graham’s quote above, one could be mistaken for thinking of the “intelligent investor” as a robot or algorithm.  Human investors feel the extreme optimism and pessimism of the markets.  And the effect of this optimism and pessimism is, almost universally, to bias their interpretations of real events.  While the best investors feel the moods of the market (that is, they are empathic), they also have the almost super-human ability to act contrary to their emotional biases.  Graham’s vision of intelligence in the 1950s is what we today call emotional intelligence.

Warren Buffett called Graham’s book, The Intelligent Investor, “By far the best book on investing ever written.”  I think it’s worth looking for lessons in Graham’s thoughts on optimism.

Today’s letter will examine the nature of optimism in the financial markets:  How we experience it, how it distorts our investing, how it plays out in markets, and how we can succeed while being both optimistic AND realistic.  As we go through these themes, we will look at French and Dutch optimism in the Euro-zone, the delusional optimism at the launch of the Facebook IPO (see Dr. Murtha’s hilarious Part 2 video), how portfolio managers can use optimism to their advantage, and visit some tools and techniques for making ourselves better investors.

Facebook Face-plant
It has been a sport in the media to level snarky criticism at the Facebook IPO. But if you’re a long-term investor you might appreciate that not every stock goes up. The IPO went reasonably well given its huge dollar size, massive trading volumes, and the usual banker conflicts-of-interest.What is most concerning to me is why anyone wanted to buy into the IPO, much less overvalued Facebook stock, especially after the shares were sold publicly. Apparently the marketers did their job well, and some of the uninformed investing public took an optimistic gamble.While most Facebook IPO investors had a “rationale” based on some sort of personal logic for their investment, we offer the following – the brain will make up a good ationale to justify us doing what we really feel inclined to do for EMOTIONAL reasons (i.e., Graham’s optimism). Who bought Facebook shares? Probably those who were excited, optimistic, and caught up in the hype. Trouble was, there were a lot of those people (MorganStanley didn’t get so big by products alone – marketing is key). Dr. Murtha created a humorous   follow-up video to his popular first-take on the Facebook IPO. Part 1 showed what financial advisors are up   against when talking to optimistic (and under-informed) clients. Part 2demonstrates the mind-bending effects   of what we call “toxic optimism” or what the layman might call “sheer AWESOMENESS” as a client ponders Facebook stock.Please take a look   at Part 2 and let us know what you think.
Researcher’s Corner: Optimism in the Markets
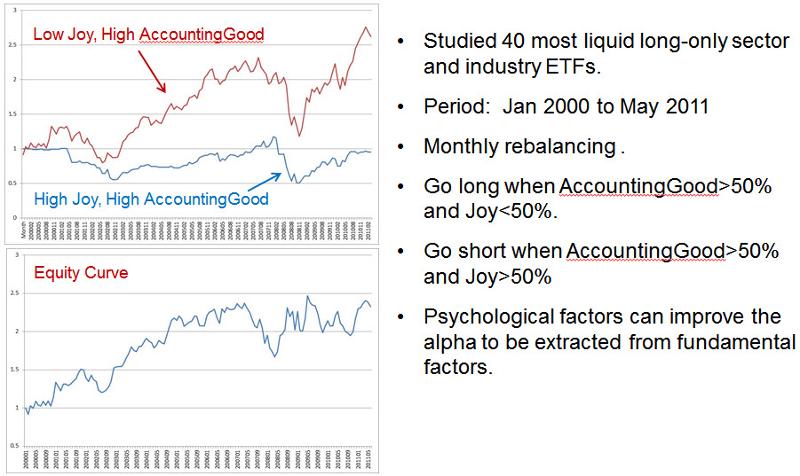
Given that Graham’s book has been available since the 1950’s, and he has many wealthy disciples such as Warren Buffett, we all know what to DO to make money investing – Buy low, sell high. Buy cheap, sell dear. Buy from pessimists, sell to optimists.But the reality is not so   simple because WE are not so simple. “Buy from pessimists,” Ben   Graham advises. But it’s fair for us to ask, “which pessimists?”  And, “pessimistic for what reasons and for how long and …?”Researchers have found that optimistic investors make a characteristic mistake – they act as if good times will last forever. In a 2009 study, Sentiment and Momentum, co-authors Doukas,   Antoniou, and Subramanyam found that small investors hold onto losing   positions too long during optimistic phases in the stock market: “An   analysis of net order flows from small and large trades indicates that small   (but not large) investors are slow to sell losers during optimistic   periods.” The researchers also found that during bull markets investors   betting on the current trends continuing suffer losses: “Momentum-based   hedge portfolios formed during optimistic periods experience long-run reversals.”   These findings bolster the evidence for the “Confirmation Bias” –   the tendency of optimistic people to believe information that supports their   sunny outlook and discount information that contradicts it.On the one hand, what are we to do if a country or investment has been optimistic for years (e.g., 2003-2007) and then a shock occurs that causes a brief dip on fear (e.g., the credit freeze of August 2007)? In such situations, you don’t want to immediately buy on pessimism. Turning the Titanic of public opinion takes time. Best to watch from the lifeboat. On the other hand, as we emerge from   the financial crisis, the brief periods of investor optimism (e.g., the   spring rallies of 2011 and 2012) have been quickly followed by selloffs   fueled by talk of imminent European financial apocalypse. In those instances,  we DO want to buy from pessimists.One interesting investment simulation, based on our older ETF sentiment data, was buying fundamentally strong and low Joy/pessimistic ETFs (buying a good value from pessimists) and shorting fundamentally strong but high Joy/optimistic ETFs (selling a good value to optimists). In both cases we were looking at Fundamentally strong sectors (good values) based on investors’ perceptions. The returns of such an arbitrage of the 40 most liquid ETFs, with monthly turn-over, are below. This   was only a quick study we did, there are likely much better variations   possible:

The above study implies that Graham was correct, the emotional component adds value to understanding   fundamental valuations. Value strategies can be improved by adding psychological data on optimism and pessimism.We seem the same delayed effect in places such as Burma. There are more horse-carts than cars in Burma. There are loads of natural resources. There is huge potential for growth there, so no wonder investors are optimistic. And they should be. Over   the long term the country will likely do very well and buying optimism may be short-term painful, but long-term rewarding in a place like Burma.
Overconfident?
The human problem with investing is that our perspective changes in reaction to the markets. Our moods shift as prices shift. Our time horizon lengthens or contracts based on   our blood levels of stress hormones. Monday the markets are up and we are   analytical long-term investors. On Tuesday Greece defaults, the S&P500 dives 7%, and we become traders.We’ve tested over 20,000 people in our free online personality testssince 2004. We’ve found some key indicators of overconfidence that correlate with lower reported investment and trading returns. Please take a personality test if you haven’t   already before reading these results. EXTROVERTSPeople who are more Extroverted (outgoing, gregarious,   and optimistic) are more likely to have lower overall investment and trading returns. This result is true in all three of our personality tests – businesspeople, investors, and traders – all report lower long-term returns   in their line of business if they are extraverted. In one studyextroverts were more likely to gravitate towards short-term investing, thus increasing their risk of loss.MEN VS. WOMENThe last question on our personality tests asks: Comparing myself to other investors, I think my abilities place me: (users   answer in ranges: “Among   the top 5 percent”, “Among the top 10 percent“, etc…). We found that this question   seems to speak to men’s pride, and women’s   sense of humility. On average men rate themselves as better investors   than women do. Yet men’s actual reported returns are significantly lower than those of women. This disconnect   between men’s returns and self-perceptions is most significant in relation to risk. Men suffer significantly greater lifetime drawdowns than women. Men have more trouble resisting the temptation of a “sure thing.” Yet sometimes men actually find a sure thing. In those cases, men are more likely to sell out too soon – they have a shorter attention span when it comes to investing, perhaps because they take too much risk due to testosterone effects on risk-taking, and they are more easily shaken out by volatility.Short of taking a personality test, how do we know if our own optimism is excessive?
– First of all, are you open to believing you are wrong? Excessively optimistic people cannot comprehend or objectively consider that they could be incorrect in their beliefs. “Of course Facebook stock will go up, it is AWESOME!”
Overoptimistic people do not look for contrary facts, due to the point above.
– Overoptimistic people have no plan. What if volatility increases? What if   the price drops 2% tomorrow? No contingencies are considered (again, see   point 1 above).

How do we get out of the   over-optimism habit?

– Use a system that requires you to check the potential downsides. Force yourself to look at objectively contrary information.

– Use only objective criteria   that are relevant. “Facebook is   the third largest country in the world.” Is an interesting “fact”, but it is not relevant (nor is it accurate, obviously).  To remain analytical, consider facts such as, Facebook has 955m users. Then   figure the revenue from each. Then look at the growth rate of revenue. Those   are facts. How many users does Facebook need to have, at the same servicing   cost, for its P/E ratio to be 15 (that of Apple)? About 5 billion? How many   people live on earth, again? Hmmm….

While most of this letter has been about the troubling effects of social and investor optimism, recall that individual optimism is a good thing – it stimulates resilience and can help us stay active and engaged. Furthermore, optimism can help us to see opoportunties when all around us are despairing and pessimistic. For investors, optimism is most critical to maintain when the world around appears to be falling apart.

Positive psychologists have found strong empirical evidence for several simple exercises to build our mental habits of optimism. Successful investors need to develop a placebo habit (seeing the opportunities) when others are pessimistic and a nocebo habit (seeing the dangers) when others are optimistic.

Just as our mouths emit an unpleasant if we don’t brush our teeth every day, so too will our attitudes become noxious without ritual cleansing. Some people use prayer, others use morning routines to get in the right headspace. Below are two exercises to help you quickly get your noggin screwed on straight. Practicing these once per day takes 2-3 minutes and improves quality of life dramatically, according to research.

1) Visualize your best possible self. Imagine yourself in your work in a state of peak performance. Next see yourself in at least one scenario involving achievement (e.g., executing an excellent investment) and one dealing with challenges (e.g., problems in an investment). Take on the peak performance attributes and imagine how you achieve. Then imagine how you work through the challenge. Close your eyes and visualize yourself with your peak performance characteristics for thirty seconds before reading on.

2) Create a gratitude list. Every day write three things you feel grateful for to a list. Each item should be unique. The simple act of thinking of three things you feel grateful for strengthens your sense of solidity and groundedness. Moving forward in your day, you are likely to think more creatively and proactively and with less vulnerability.

We have much more about these exercises in our books and training workbooks – please email if you’d like more information or to share experiences. Now let’s turn to one of our prior predictions, one we’re not happy about.

Video Part 1 of Facebook IPO http://youtu.be/-bXevO_gafg Funny but true

Video Part 2 of Facebook IPO http://youtu.be/KD2TBIKiJwM

VALUE VAULT (folder called VV_CS_Inv) UPDATE

The vault is under heavy construction. The folders that have been REORGANIZED are:

Grham, Price, Klarman and Buffett in the INVESTORS FOLDER

Greenblatt in the Investing Lectures Folder

Do not panic if you see folders change or disappear—when finished an email will go out to everyone that has sked for a key.

Buffett in his Early Years

Thanks to a reader: A link to Buffett’s Early Letters and his Portfolio
http://www.futureblind.com/ 2008/08/early-berkshire- hathaway-letters/ http://www.gurufocus.com/news/ 169950/how-warren-buffett- made-his-first-100000

How Buffett Got Started

A great story by Buffett in the latest issue of ForbesLife about how he got started (with some wonderful old pictures of him and his family from the 1950s):

Forbes, 3/26/2012    Warren Buffett’s $50 Billion Decision

This article, by Warren Buffett, as told to Randall Lane, appears in the upcoming April issue of ForbesLife magazine, as part of its “When I Was 25″ series. By Warren Buffett

Benjamin Graham had been my idol ever since I read his book The Intelligent Investor. I had wanted to go to Columbia Business School because he was a professor there, and after I got out of Columbia, returned to Omaha, and started selling securities, I didn’t forget about him. Between 1951 and 1954, I made a pest of myself, sending him frequent securities ideas. Then I got a letter back: “Next time you’re in New York, come and see me.”

So there I went, and he offered me a job at Graham-Newman Corp., which he ran with Jerry Newman. Everyone says that A.W. Jones started the hedge fund industry, but Graham-Newman’s sister partnership, Newman and Graham, was actually an earlier fund. I moved to White Plains, New York, with my wife, Susie, who was four months pregnant, and my daughter. Every morning, I got on a train to Grand Central and went to work.

It was a short-lived position: The next year, when I was 25, Mr. Graham—that’s what I called him then—gave me a heads-up that he was going to retire. Actually, he did more than that: He offered me the chance to replace him, with Jerry’s son Mickey as the new senior partner and me as the new junior partner. It was a very tiny fund—$6 million or $7 million—but it was a famous fund.

This was a traumatic decision. Here was my chance to step into the shoes of my hero—I even named my first son Howard Graham Buffett. (Howard was for my father.) But I also wanted to come back to Omaha. I probably went to work for a month thinking every morning that I would tell Mr. Graham I was going to leave. But it was hard to do.

The thing is, when I got out of college, I had $9,800, but by the end of 1955, I was up to $127,000. I thought, I’ll go back to Omaha, take some college classes, and read a lot—I was going to retire! I figured we could live on $12,000 a year, and off my $127,000 asset base, I could easily make that. I told my wife, “Compound interest guarantees I’m going to get rich.”

My wife and kids went back to Omaha just ahead of me. I got in the car, and on my way west checked out companies I was interested in investing in. It was due diligence. I stopped in Hazleton, Pennsylvania, to visit the Jeddo-Highland Coal Company. I visited the Kalamazoo Stove & Furnace Company in Michigan, which was being liquidated. I went to see what the building looked like, what they had for sale. I went to Delaware, Ohio, to check out Greif Bros. Cooperage. (Who knows anything about cooperage anymore?) Its chairman met with me. I didn’t have appointments; I would just drop in. I found that people always talked to me. All these people helped me.

In Omaha, I rented a house at 5202 Underwood for $175 a month. I told my wife, “I’d be glad to buy a house, but that’s like a carpenter selling his toolkit.” I didn’t want to use up my capital.

I had no plans to start a partnership, or even have a job. I had no worries as long as I could operate on my own. I certainly did not want to sell securities to other people again. But by pure accident, seven people, including a few of my relatives, said to me, “You used to sell stocks, and we want you to tell us what to do with our money.” I replied, “I’m not going to do that again, but I’ll form a partnership like Ben and Jerry had, and if you want to join me, you can.” My father-in-law, my college roommate, his mother, my aunt Alice, my sister, my brother-in-law, and my lawyer all signed on. I also had my hundred dollars. That was the beginning—totally accidental.

When I formed that partnership, we had dinner, the seven of them plus me—I’m 99 percent sure it was at the Omaha Club. I bought a ledger for 49 cents, and they brought their checks. Before I took their money, I gave them a half sheet of paper that I had made carbons of—something I called the ground rules. I said, “There are two or four pages of partnership legal documents. Don’t worry about that. I’ll tell you what’s in it, and you won’t get any surprises.

“But these ground rules are the philosophy. If you are in tune with me, then let’s go. If you aren’t, I understand. I’m not going to tell you what we own or anything like that. I want to get bouquets when I deserve bouquets, and I want to get soft fruit thrown at me when I deserve it. But I don’t want fruit thrown at me if I’m down 5 percent, and the market’s down 15 percent—I’m going to think I deserve a bouquet for that.” We made everything clear, and they gave me their checks.

I did no solicitation, but more checks began coming from people I didn’t know. Back in New York, Graham-Newman was being liquidated. There was a college president up in Vermont, Homer Dodge, who had been invested with Graham, and he asked, “Ben, what should I do with my money?” Ben said, “Well, there’s this kid who used to work for me.…” So Dodge drove out to Omaha, to this rented house I lived in. I was 25, looked about 17, and acted like 12. He said, “What are you doing?” I said, “Here’s what I’m doing with my family, and I’ll do it with you.”

Although I had no idea, age 25 was a turning point. I was changing my life, setting up something that would turn into a fairly good-size partnership called Berkshire Hathaway. I wasn’t scared. I was doing something I liked, and I’m still doing it.

Ben Graham’s Curse on Gold or the Counter-Argument to Buffett’s Attack on Gold

Our Goal as An Investor Is to Maintain THE Purchasing Power of our investments

Ben Graham’s Curse on Gold

By David Galland, Casey Research

It seems that the mainstream investment community only takes a break from ignoring gold to berate it: one of gold’s most outspoken critics, uber-investor Warren Buffett, did so recently in his latest shareholder letter. The indictments were familiar; gold is an inanimate object “incapable of producing anything,” so any investor holding it instead of stocks is acting out of irrational fear.

How can it be that Buffett, perhaps the most successful (and definitely the most well-known) investor of our time, believes that gold has no place in an intelligently allocated investment portfolio?

Perhaps it has something to do with his mentor, Benjamin Graham.

Graham, author of Security Analysis (1934) and The Intelligent Investor (1949), is correctly respected as one of history’s most knowledgeable investors. Over a career spanning 1915 to 1956, he refined his investment theories, in time becoming known as the father of value investing. Much of modern portfolio theory is based upon Graham’s work.

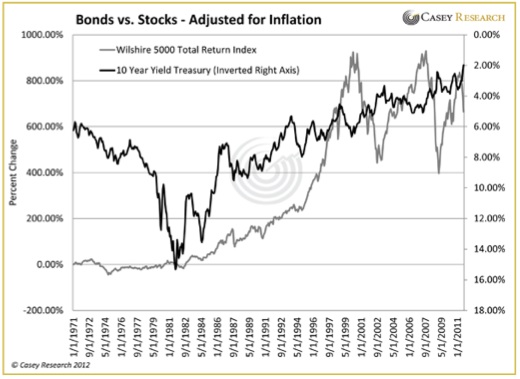
According to Graham, while no one can tell the future, there are periods when the valuations of stocks and bonds would deviate from fair value by becoming excessively over-or-undervalued. To enhance returns and reduce risk, investors should alter their portfolio allocations accordingly. A quick look at a long-term chart supports Graham’s theory clearly shows periods when one asset class offered a better value than the other:

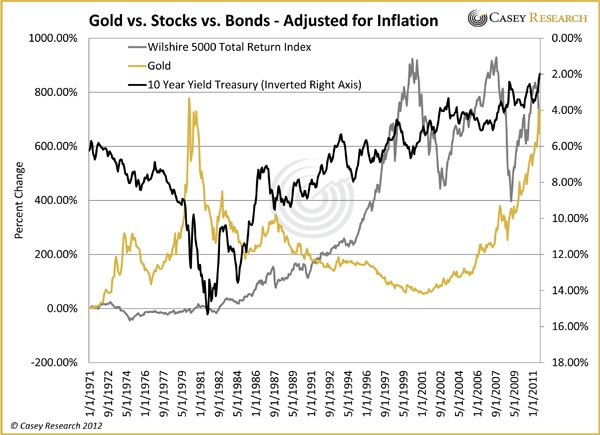
But what of the periods when both stocks and bonds stagnated or fell together? For much of the 1970s and again from 2001 through today, any portfolio allocated solely between stocks and bonds would have at best treaded water and at worst drowned in a sea of stagflation. To earn any real return, an investor would have needed to seek alternatives.

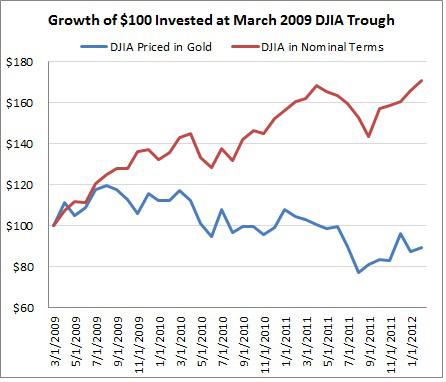
It’s clear from this next chart that gold was exactly that alternative, a powerful counter-trend investment for periods when both stocks and bonds were overvalued. Yet gold is conspicuously absent from Graham’s allocation model.

But this missing asset class is entirely understandable: for most of Graham’s adult life and the most important years of his career, ownership of more than a small amount of gold was outlawed. Banned for private ownership by FDR in 1933, it wasn’t re-legalized until late 1974. Graham passed away in 1976; he thus never lived through a period in which gold was unmistakably a better investment than either stocks or bonds.

All of which makes us wonder: if Graham had lived to witness the two great bull markets in precious metals during the last 40 years, would he have updated his allocation models to include gold?

We can never know.

We can know, however, that given Graham’s outsized influence on investment theory, there is little question that his lack of experience with gold, and therefore its absence from his observations, has had a profound effect on how most investment professionals view the yellow metal. This, in our opinion, goes a long way toward explaining the persistently low esteem in which gold is held by the mainstream investment community. And, as a consequence, its widespread failure to even be considered as an asset class.

A couple of takeaways: first, perhaps now you can stop wondering why your broker, the talking heads in the financial media, and Warren Buffett continue to misunderstand gold as a portfolio holding. More importantly, however, is that in order to have sustained, long-term investment success, one must accept that an intelligent portfolio allocation needs to include not two but three broad categories of investment – stocks, bonds and gold, with the amounts allocated to each guided by relative valuation.

Given the powerful influence of Ben Graham and his disciples, his curse on gold will not go quietly into the night. But it should.

My take: Gold is not an investment; it is simply non-fiat money or gold is the reciprocal of the market’s view of current and future debasement of fiat currencies.

Your thoughts?

Inflation, Hyperinflation and Investing with Klarman, Buffett and Graham

Investing and Inflation

Americans are getting stronger.  Twenty years ago, it took two people to carry ten dollars’ worth of groceries. Today a five year-old can do it. – Henry  Youngman.[1]

The best investing article on investing this editor has ever read:

http://www.scribd.com/doc/65198264/Inflation-Swindles-the-Equity-Investor

If you  grasp what Buffett is saying, your results will improve. Inflation is the major  concern of any investor. You should measure your investment success not just by  what you make in nominal terms but by how much you keep after inflation. Take out a dollar from your purse or wallet. You  are taking a dollar today to invest  in a claim in a capital good (stock or bond of a company) to be able to consume  the same or more goods and services in the future.

An  interesting blog discusses Buffett’s above article and comments further on
inflation here: http://www.valueinvestingworld.com/2009/06/warren-buffetts-comments-on-inflation.html  and click on the pdf file (100 pages) which
aggregates all of Buffett’s writings on inflation and investing. http://www.chanticleeradvisors.com/files/107293/Buffett%20inflation%20file.pdf.

After reading those  articles, take a minute to download the 50-year charts on

Proctor & Gamble (PG): http://www.scribd.com/doc/65206655/Proctor-Gamble-50-Year-Chart

Coke (KO): http://www.scribd.com/doc/65206606/Coke-50-Year-Chart-SRC

US Steel (X):  http://www.scribd.com/doc/65207037/US-Steel-50-Year-Chart-SRC

Goodyear Tire & Rubber: GT: http://www.scribd.com/doc/65207109/GT-50-Year-Chart-SRC

I recommend going to www.srcstockcharts.com and consider
subscribing to their 35-year or 50-year stock charts as a way to understand the
long-term cyclicality of businesses. You might be amazed at the differences in
performance and persistence between good and bad businesses. As the world
focuses more on the short-term, I urge you to develop more long-term analysis.
Stocks are theoretically perpetual ownership interests unlike bonds.  It’s silly to focus on next quarter’s earnings and think that will have a major impact on intrinsic values.

Four companies is not a statistical relevant example size. Also, one has to be careful of hindsight bias and fitting a theory to the facts, but how does Buffett’s
article tie into these empirical results? What can you use from your analysis
to become a better investor? Thoughts? Hint: I learned to go where the living is easy not to solve tough problems.

Understanding the dangers of inflation is critical now
because of the monetary and credit distortions building up in the world’s
monetary system as the links below will show. A true understanding will require
a huge effort, but you have no choice if you wish to understand the challenges
and conditions you face as an investor.

Many traditional value investors believe an investor should avoid macro forecasting and just do bottom-up company-specific analysis.  I don’t believe you need to forecast markets but one must understand the current dangers and risks confronting him or her when valuing businesses. Not to have been aware of the unusual credit conditions in the housing market during 2003 to 2007 would have meant attaching unusually high normalized earnings to homebuilding stocks while in a housing bubble.

Hindsight bias? A stopped clock is always right twice? Several investors were screaming from the rooftops about the  bubble building in housing. Go here for a ten minute clip: http://www.youtube.com/watch?v=tZaHNeNgrcI.
For a more in depth analysis of the causes of the housing bubble by the same
analyst: http://www.youtube.com/watch?v=jj8rMwdQf6k.
By the way, the point is not the successful prediction but the reasoning behind his analysis. If you don’t understand economics you are like a one-legged man in an ass-kicking contest. Thanks Mr. Munger.

No greater value investor than Seth A. Karman in his introduction to Security Analysis, 6th Edition (2009) writes on pages, xxxii to xxxiii:

Another important factor for value investors to take into account is the growing propensity of the Federal Reserve to intervene in financial markets at the first sign of trouble. Amidst severe turbulence, the Fed frequently lowers interest rates to prop up securities prices and investor confidence. While the intention of the Fed officials is to maintain orderly capital markets, some money managers view Fed intervention as a virtual license to speculate. Aggressive Fed tactics, sometimes referred to as the “Greenspan put” (now the “Bernanke put”), create a moral hazard that encourages speculation while prolonging overvaluation. So long as value investors aren’t lured into a false sense of security, so long as they can maintain a long-term horizon and ensure their staying power, market dislocations caused by Fed action (or investor anticipation of it may ultimately be a source of opportunity.

TODAY

Now for the current (2011):

A  monetary tsunami is coming: http://mises.org/daily/5597

Defining inflation: http://mises.org/daily/908

Just don’t believe what you read, go to the primary sources:

Current Money Stock Measures which are rising as fast as they did in the 1970s: http://www.federalreserve.gov/releases/H6/Current/

You need understanding to place those statistics into context.  The effects of inflation are rising prices in general or a decreased decline in some prices absent money printing. The effects are not just a result of the increased supply of money but the demand to hold money.

The pernicious effects of inflation:

http://mises.org/resources.aspx?Id=7215a07f-1a67-475e-90af-5789b7c82223

http://www.lewrockwell.com/paul/paul728.html

Why gold prices are so high: http://mises.org/daily/5652/Why-Are-Gold-Prices-So-High

HYPERINFLATION

I am not  implying impending hyperinflation but understand the worst case scenario. The US has suffered two hyper-inflations (The
Confederate Greenback and the US Continental Dollar). The dollar’s exchange
value has declined as shown here: http://mykindred.com/cloud/TX/Documents/dollar/
and for further clarification go here: http://www.financialsensearchive.com/fsu/editorials/dollardaze/2009/0223.html

As  investors we must also be prepared to understand worst case scenarios like hyperinflation. See video http://www.youtube.com/watch?v=DzV9WZhhKrM&feature=related.  The Weimar hyperinflation destroyed the
wealth of Germany’s middle class. The social devastation helped usher
in http://www.youtube.com/watch?v=VCwV75obpYk&feature=related
Hitler. May we never forget the lessons of history.

BOOKS

THE best book on understanding the causes and effects of hyperinflation is The Economics of Inflation by Constantino Bresciani-Turroni, download the book here: http://mises.org/books/economicsofinflation.pdf

When Money Dies: The Nightmare of Deficit Spending, Devaluation, and Hyperinflation in Weimar Germany by Adam Fergusson (1975, Reprint
2010). This is the “narrative description” of Bresciani’s book. The horror. Finally, another good read: Fiat Inflation in  France by White: http://mises.org/books/inflationinfrance.pdf

If you live in the USA or Europe and are not aware of the current dangers and what could happen, you are living a high-wire  act.


[1] Intelligent Investor, Chapter 2: The Investor and  Inflation by Benjamin Graham.