
In the Land of the Free, the Government Accountability Office (GAO) recently released its 2013 Financial Report of the United States government.
This is the government’s best attempt at an honest accounting of its books. And even though they use a different accounting system that gives them special advantages, the picture is still remarkably bleak.
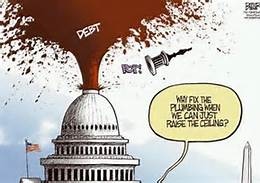
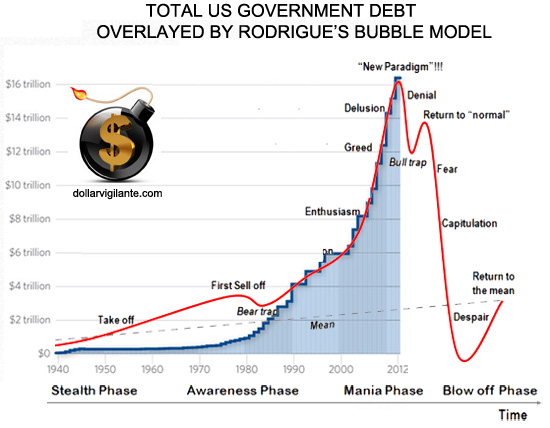
We all know that the US government has racked up a substantial debt; as of this morning, total outstanding public debt is $17,546,814,482,078.90. ($17.5 trillion)
But it’s not all about the debt. Debt is not necessarily evil… and it’s important to look at the situation qualitatively in addition to quantitatively.
Let’s drop a few zeros and consider this in terms of personal finance.
Assume you had $1.75 million in total debt. That sounds like a lot to most people.
But if you had $3 million in liquid assets to offset the debt, plus $500,000 in annual income to pay interest, living expenses, and just about any contingency that could come your way, you’d be in great shape.
It would be even better if that $1.75 million in debt financed a lucrative real estate investment which was generating a 25% cash-on-cash return for you.
But that’s not the case for the US government.
Despite the Obama administration touting a budget deficit of “only” $680 billion in 2013, the GAO’s more accurate accounting shows a total government cost of $3.8 trillion on total revenue of $2.8 trillion.
In other words– the administration wasn’t exactly honest with the American people– the deficit was more like $1 trillion, not $680 billion. But it gets worse.
The GAO added up ALL the US government’s assets in 2013. Aircraft carriers. The highway system. Land. Cash and financial assets. The total is $2.97 trillion.
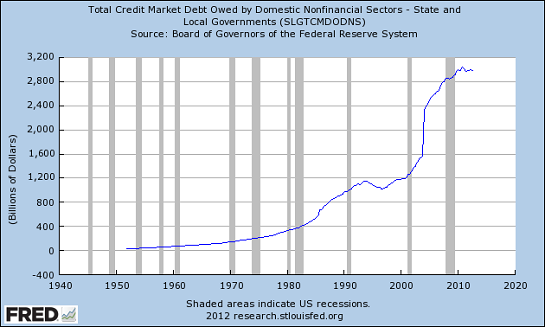
The liabilities, on the other hand, total $19.88 trillion. This includes the official public debt, plus all sorts of IOUs and loan guarantees.
This means the net EQUITY of the US government is minus $16.9 trillion.
Moreover, the US government’s cash position is a mere $206 billion… roughly 1.1% of its public debt. This isn’t enough to cover net interest payments for the next year.
Unlike a savvy investor who borrows cheap money to purchase productive assets, the US government borrows money to pay interest.
Quantitatively AND qualitatively, the data point to an inevitable conclusion: despite all the propaganda, this is NOT a risk free environment.
And understanding these trends and consequences is absolutely critical to your long-term financial survival. From: www.sovereignman.com (Simon Black)
A solution? Debtors’ Prisons
http://www.oftwominds.com/blogmar14/legal-looting3-14.html
A great audio interview of Bob Hoye, a financial historian & money manager, discusses our current situation compared to the past: http://radio.goldseek.com/nuggets/goyette.03.19.14.mp3
5 responses to “Government Debt Bubble; Financial History”