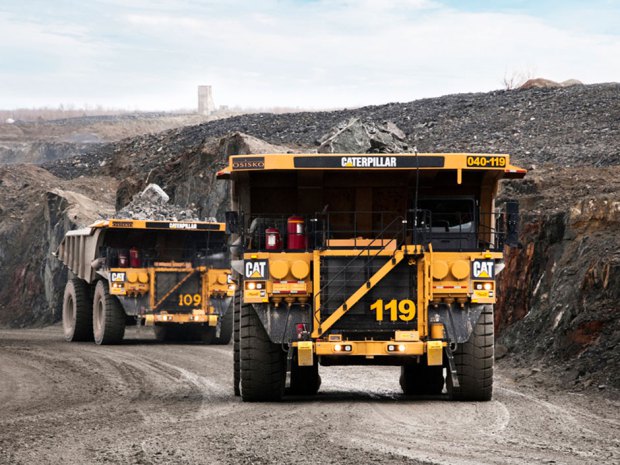
A gold mine is a hole in the ground with a liar on top–Mark Twain
Industry Map:
Industry Map of the Precious Metals Sector OK, I give myself a D- for effort and appearance but time has been passing so we need to move forward to a valuation of Detour Mines (DRGDF). Please see where Detour is highlighted in my industry map.
A reader was kind to share a brokerage report on the industry: Merrill_Global_Gold and Precious Metals and Gold-Special-Report-Time-to-Mine-2014 (I personally do not spend much time on jewelry demand, etc. because investment demand, in my opinion, drives the price of gold). When you hear that China’s demand for gold is higher per year than annual production and the only reason gold is lower is because of manipulation in the “paper” (Comex/LMBA), think for yourself! Because of the huge stock to flow ratio (190,000 tonnes supply vs. 2,500 annual production) what matters is the NET hoarding (buying) and/or dishoarding (selling) at the current price. Gold doesn’t disappear like wheat, it simply changes hands at a certain/specific price. When silver hit $50 in 1980, Grannies started melting down their silver tea sets to sell into the market.
Try to value Detour Mine with today’s gold price give or take $100 to $200 dollars–the range we have been trading through for the past year. On Monday, I will give a big hint in how you might value Detour, but let’s see if you can spot the obvious, first. Good luck! What prize would folks like for their effort? Money, gold bullion, or a date with my Ex?
Have a Great Weekend!
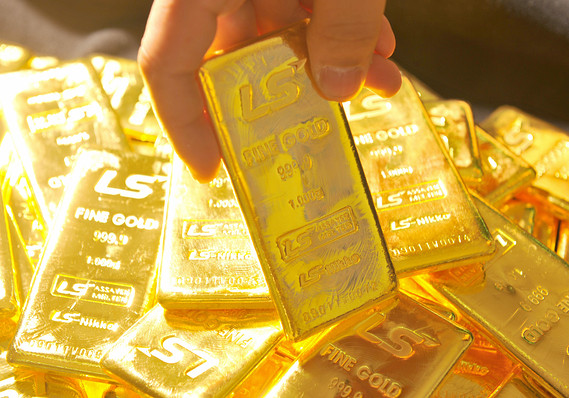
REMEMBER: It is a long, long way from searching for gold to this:


2 responses to “Case Study: Valuing Detour Gold; Industry Map”