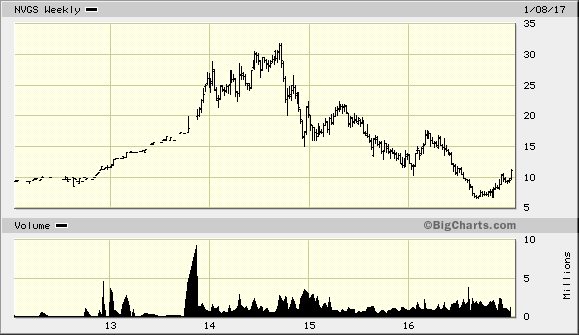
So if charts have NO FORECASTING ability or, in my humble opinion, no investor/trader can use chart formations like rising wedges, cup and handles, head and shoulders, etc to PREDICT where the market will go IN THE FUTURE. Charts might work for Hindsight Capital, but I have yet to see any research showing the efficacy of chart reading. Despite that vicious attack on chartists, I do use charts. Take for example, Navigator’s Holdings (NVGS). Let’s zero in a bit more:
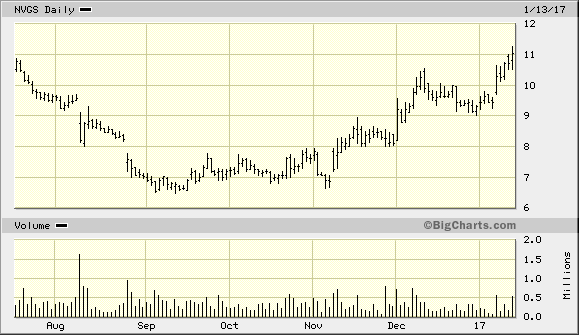
Note the time period from August 2016 to December 2016. As the price accelerated downward on larger than normal volume–note in the second week of August the plunge in price from $9.50 t0 $8.10 in one day or about 15%, OUCH! The price decline occurred on the anouncement of second quarter earnings:
Navigator Holdings misses by $0.04, misses on revenue Aug. 8, 2016
So you have a plunging/falling knife on an “earnings miss” or worse than “expected” news. Now look at the opposite of the trade. Since I was fundamentally bullish, who was on the other side selling? First from the holdings, you can see that 41% of the 53 million shares outstanding is held by a private equity firm, Invesco run by Wilbur Ross–a deep value investor. Invesco bought at $9 a share back in 2012, then sold some shares at $20 a year and a half later. Over 50% of the shares seem to be held by long-term investors. The NVGS share price had been declining for over two years from $32 per share while it bought more ships, then LPG freight rates declined sharply and the arbitrage shrunk for some of NVGS’s products. In short, the sudden high volume rapid decline indicated MOTIVATED sellers who were either distressed or late momentum sellers. Some of the sellers are selling AFTER a long price decline and bad news being announed. I consider those emotional/weak sellers. Now there is no guarantee that the news won’t worsen and the price won’t keep declining.
I feel confident saying that because NVGS’ balance sheet was not overburdened with debt. See September-2016-Update for NVGS.
| INVESCO PRIVATE CAPITAL, INC. | 21,863,874 | $ 157,201,000 | 41.05% | 53.08% | 1 | NaN% | |
| PARAGON ASSOCIATES & PARAGON ASSOCIATES II JOINT VENTURE | 1,050,000 | $ 7,550,000 | 8.73% | 10.85% | 4 | 86,516 | NaN% |
| EMANCIPATION MANAGEMENT LLC | 683,422 | $ 4,913,000 | 7.57% | 6.95% | 3 | 187,961 | NaN% |
| HOLLOW BROOK WEALTH MANAGEMENT LLC | 855,072 | $ 6,148,000 | 3.63% | 2.91% | 10 | 489,875 | NaN% |
Then prices CONTINUED to decline as negative news and research reports came out reporting the known bad news of declining freight rates, over-supply of ships, economic uncertainty, etc.
Let’s set aside that on a normalized basis, I have a value for NVGS above $20, how do I know the price won’t go to $8 or $5 or $2? I don’t! But I do have context to see if the price is “OVER” discounting the news/fundamentals.
http://seekingalpha.com/research/839737-j-mintzmyer/4912014-exclusive-research-navigator-holdings-cheap-underfollowed-deservedly is an example of several negative research reports that implied, “Yes, the stock is cheap with solid management and the company is profitable, BUT supply will increase next year.” Stay away.
Then for the next two months, September and October, the price chart showed a change in trend from rapidly down to sideways. Why was the price going sideways with negative reports and negative news constantly coming out each day? Perhaps the chart was showing that prices had ALREADY discounted the known NEGATIVE news and extrapolating a long period of negative news. Unless the news became much worse–despite frieght rates at 30 year lows–all you needed was slightly less bad news.
Sure enough, the announcement of earnings Nov. 4th 2016 showed that the company could still generate profits in an extremely negative operating environment. The price rallied confirming the prior discounting. Now I could really start to add to my position. The chart had helped me “eliminate” one side of the market–the downside.
The combination of fundamentals, the action of majority shareholders (holding firm), extreme negative news coupled with NON-DECLINING prices, gave me a signal that the market had ALREADY discounted negative news. This is more of an art or combination of fundamentals, sentiment, and human incentives than just looking at chart patterns.
Hope that helps.
—
You are Hired! A Trump Playbook For Fixing Americas Economy
—
If you were against the New Deal and its wholesale buying of pauper votes, then you were against Christian charity. If you were against the gross injustices and dishonesties of the Wagner Labor Act, then you were against labor. If you were against packing the Supreme Court, then you were in favor of letting Wall Street do it. If you are against using Dr. Quack’s cancer salve, then you are in favor of letting Uncle Julius die. If you are against Holy Church, or Christian Science, then you are against god. It is an old, old argument. –H.L.Mencken


