The above post is an excellent tutorial and case study on riding a volatile, cyclical bull market in Uranium Company, Cameco (and others) from 2000 when CCJ traded about $7 to $8 until mid-2007 or about $40 to $45 (you never get the exact high). That is about a 27% compounded return over seven years. Buying near the low and selling near the high–isn’t that a fantasy. Not if you were following the fundamentals and the sentiment. The hardest part is holding on until it is clearly time to sell.
The article was written by https://www.uraniuminsider.com/ who did a great job on this article. I don’t know him or his newsletter, but I collated his articles in a case study below. I highly recommend you study the case below even if you avoid investing in cyclical, commodity companies.
The case also gives you a condensed application of the capital cycle.
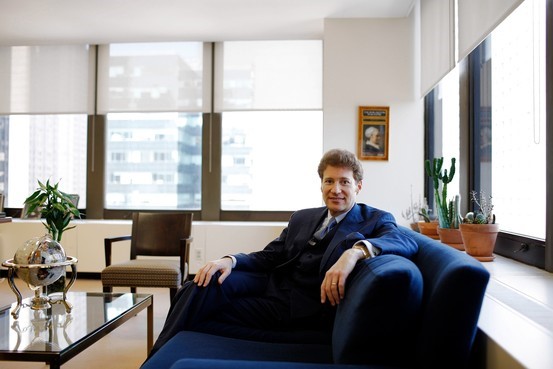
Mr. Kaplan is the perfect investor to study to improve your investing in deeply cyclical resource investments and to understand gold. As Mr. Kaplan explains in an interview (2017): “Gold is not someone’s liability…. Economically, we are in unchartered waters.”
His philosophy is to start with a macro theme (A long-term bull market in gold) and then locate the best asset (Novagold) to leverage that theme. He considers gold the best risk reward of any asset class. Setting aside that gold is the best asset to own during financial crises, gold will be facing a severe supply crunch since no new large deposits over 5 million ounces are being discovered much less developed. Development from discovery to production requires over 20 years.
In addition, more and more foreign jurisdictions like the Philippines or Papua New Guinea are becoming too risky to mine. Mr. Kaplan estimates the equilibrium price to incentivize new discoveries is probably $3,000 to $5,000 per ounce. I think that is too low of a price.
The patience and conviction to be successful in this type of investing are extraordinarily high. Most professional investors cannot even pretend to be as patient. Mr. Kaplan became involved in Novagold during the crisis of 2009–imagine the fear and financial stress swirling amongst investors then.
Recognizing the obvious: Intrinsic value rising well before price
From 2009 to 2019 the intrinsic value was rising as Novagold became de-risked. The decade ticked by as Novagold obtained all the required permits, it strengthened relationships with native communities, it spun off non-core assets like Galore (copper) to Trilogy, Novagold treasury increased its cash balance to $250 million with an annual cash burn of less than $10 million, and NG’s relationship with Barrick strengthened. Few cared or paid attention. Meanwhile, many jurisdictions have become even higher risk like the Philippines, Papua New Guinea, etc.
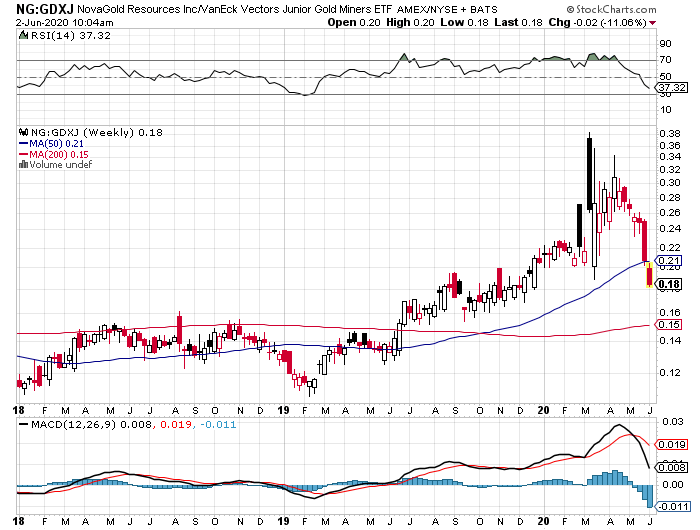
Price goes sideways while intrinsic value rises quietly. These are the best situations to hold onto. You just need VAST patience and to pay attention. Value accretion was occurring away from the financial statements. You would see expenses each quarter, but you would need to be aware of the permits won and the relationships strengthened. No algorithm or computer screening model will do that for you. But NG just traded as part of an index until decoupling in mid-2019. Everything related to Novagold was increasing except the share price until one day……. Meanwhile, Mr. Kaplan held fast because of his knowledge and conviction.
NG trades with the indexes, GDX and GDXJ, then decouples upward as price catches up with intrinsic value.
As a word of caution, this post is not a recommendation to buy Novagold even though I have been a shareholder since 2015. You should understand that Mr. Kaplan has been an investor for over 11 years through declines of 85% in NG’s share price. As an investor you might check on the statements and claims made in the annual reports listed below. If Novagold’s grade is considered outstanding, then look at the annual reports of five major miners and verify/check whether that fact checks out. Take nothing on faith so you can learn conviction.
How would you be willing to hold a investment without a huge payoff for over a decade while waiting for the market to turn to your analysis?
If you study those letters and annual reports, you will have a course in patient investing in a deeply cyclical industry and in understanding gold.
UPDATE 5/1/2020: 2008 Annual Report marks the entry of Electrum during the Great Financial Crisis.
2012 Annual Report began the time when management change had begun in earnest with CEO Greg Lang arriving from Barrick Gold as well as divesting of assets to focus on Donlin Gold. Those actions made the company into a perpetual option on the value of gold.
The Tortoise and The Hare Chairman’s Letter of 2015 explains why Thomas Kaplan was (and remains) bullish towards gold.
Please note how consistent Mr. Kaplan’s and Novagold’s message has been over the past twelve years. The Donlin project attributes remain consistent even while the resource base increases.
Remember that Novagold (NG) as a perpetual option is highly leveraged to the price of gold and to sentiment so expect prices swings of 25% to 50% or more. Such is the requirement to being a long-term investor. My secret is not to look at the share price but once a quarter.
Below is a case study of the capital cycle using Tidewater as an example. This page will be updated over time. This is not an investment recommendation but an ongoing case study.
Since Tidewater has been in business since 1955, its service is needed, but this is–at best–no more than an average business with no long-term competitive advantage. Currently, there is a trade-off between a decline in intrinsic value as time progresses without economic charter rates versus Tidewater’s competitive advantage over financially distressed competitors.
Update: 4/17/20
Tidewater filed to protect its $300 million in NOLs and $388 million in foreign tax credits. As an investor, you know that the NOLs can be worth more than $0 to worth a whole lot.
Meanwhile, Hornbeck (HOSS), a competitor filed for bankruptcy.
Update: 4/21/2020 US Crude oil near-term futures trade at a negative price for the first time in history. Natural gas is rising in price as shut-in oil wells reduce natural gas supply. What we are witnessing is a massive destruction of capital and productive capacity thanks to covid-19 and negative global interest rates. The future might require far higher oil prices. Near-term one would expect more pressure on TDW’s price because of the fear in hydrocarbon markets.
Update: 4/22/2020 TDW does not seem to be declining with oil prices–a divergence that may be signaling some change–perhaps investors are looking out at the supply destruction in oil.
4/25/20: Siem Management in their 2019 Shareholder letter move from hopeful to despair. (A good sign for Tidewater). These are dark days for the OSV industry and what you typically hear about in the depths of a downcycle.
The Siem Offshore is exposed to a number of risks. One of the most important risk factors is the demand for its services. The OSV market is now in its 7th year of depressed conditions and it has taken longer to recover than earlier expected. It is highly uncertain as to when charter rates will offer sufficient earnings for full debt servicing. The Company has been able to reduce its debt substantially over the last five years. Principal payment of debt instalments in 2019 was USD99 million (2018: 195 million). The significant debt reduction has been possible due to good cooperation between the Company and its financing banks, significant shareholder support, good ship operations and disposal of non-strategic and older assets. However, the significant excess capacity in the worldwide offshore service vessel fleet has increased the competition amongst owners for any vessel requirements, thereby depressing charter rates. The imbalance of supply and demand for offshore vessels is expected to remain for some years and will continue to put pressure on the charter rates and our cash flows. Five vessels were in lay-up at year-end 2019.
4/22/2020 OUTLOOK from Siem Offshore’s Annual Report. Despair!
The collapse in the oil price and the effect of the COVID-19 on the world’s economies have created a very different operating environment for our fleet. Field developments offshore are being cancelled or postponed by our clients and there will be much less work offshore during the coming several years. The demand for our services will therefore reduce rather than increase. At the end of last year, we looked forward to a gradual recovery in offshore activities and the nearing of balance in supply and demand in the OSV sector. That hope is now gone and we brace ourselves for a downturn probably worse than we have experienced during the past few years.
The actions required to achieve the best possible outcome when confronted with the market difficulties include consolidations between and among debt-burdened owners, such as practically all OSV owners in Norway. This is the time when owners should work together to embrace the opportunities to survive until the end of a long, dark tunnel of slow activity in the market for all of our vessels. Only by working together can the right scheduling and layup of vessels be achieved. The cost saving would be an added benefit. Most of our lending banks are lenders to several if not all of the competing OSV owners and are in the position to influence this required development. Disappointedly, the banks do not appear willing or prepared to assume this vital role.
The financial problems are currently solved independently within each company giving the owners more time to compete fiercely with each other, all to the benefit of the clients. Owners are seen to take higher risks as the clients take advantage of the desperate situations to shift operating risks from the clients to the OSV owners. The latter accepts the risks because they have nothing more to lose. Ironically, it is the banks who are exposed to the contractual downside in this new reality. This has created an artificial, unhealthy and unsustainable competitive situation in our industry.
May 17, 2020 Update. Tidewater currently trades at $4.13 or about 24% below its scrap liquidation value if we take Hornbeck’s bankruptcy filing as a guide.
Tidewater had 157 vessels operating at the end of the year. It took 4 of its active fleet to sell. So let’s take 150 vessels times $2 million per vessel (See last page on Hornbeck Bankruptcy filing below) for 300 million sales/scrap value then minus $85 million net debt for $215 liquidation value divided by 42 million shares or $5.11 per share. At $4.13, TDW trades 24% below this value.
I realize that the next twelve to eighteen months will be extremely difficult for TDW as it races to scrap excess vessels and conserve cash, but I don’t think it is a certainty that TDW will have to restructure it debt or declare bankruptcy again, but the market is pricing for extreme events ALREADY. The issue is whether to add on weakness.
The biggest risk is if financiers continue to throw good money after bad in this OSV industry. We shall see.
A Stoic would agree with this quote from the above book:
The most important thing successful investors have in common is worrying about what they can control. They don’t waste time worrying about which way the market will go or what the Federal Reserve will do or what inflation or interest rates will be next year. They stay within their circle of competence, however narrow that might be.
Other useful quotes:
In my nearly fifty years of experience in Wall Street I have found that I know less and less about what the stock market is going to do but I know more and more about what investors ought to do; and that is a pretty vital change in attitude — Ben Graham
Investment success accrues not so much to the brilliant as to the disciplined.– William Bernstein
Investors who confine themselves to what they know, as difficult as that may be, have a considerable advantage over everyone else — Seth Klarman
Genius is a rising market — John Galbraith
In a winner’s game the outcome is determined by the correct actions of the winner. In a loser’s game, the outcome is determined by mistakes made by the loser. — Charlie Ellis
How could economics not be behavioral? If it isn’t behavioral, what the hell is it? — Charlie Munger
You need patience, discipline, and an ability to take losses without going crazy — Charlie Munger, 2005
You will do a great disservice to yourselves, to your clients, and to your businesses, if you view behavioral finance mainly as a window onto the world. In truth, it is also a mirror that you must hold up to yourselves. — Jason Zweig
If I could sum up the lesson of the above 175-page book at $35, it would be that IF you invest long-term in compounders or franchise companies that redeploy their capital at high rates of return, then expect to suffer through multiple 50% to 60% declines in stock price as you hold on for the long-term. And remember that a price decline of 50% does not necessarily indicate a bargain.
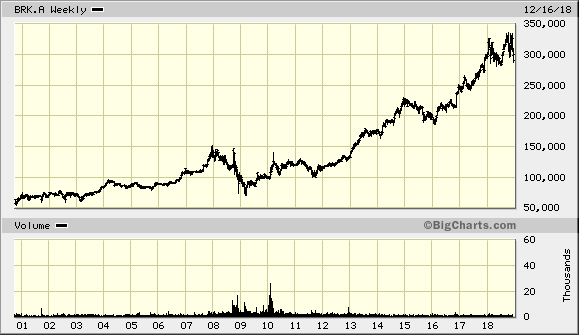
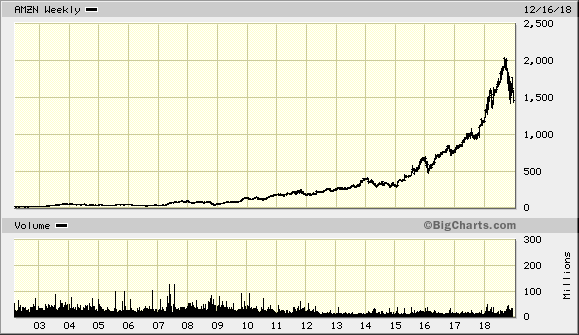
You can see the 50% sell-off in Bershire’s stock in 1999/2000 while you can barely make out the multiple 50% or more declines in AMZN over the past twenty years. Investing is HARD!
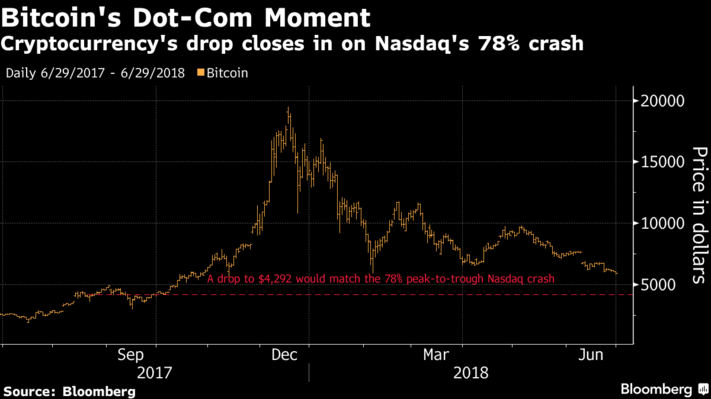
To understand the prospects for bitcoin and the other cryptocurrencies and tokens, it is necessary to grasp the centrality of gold.
Gold resolved both the horizontal and vertical enigmas of money. As a universal index of value, it muted the volatile shifts and shuffles of exchange rates. As an unchanging standard, it made interest rates a reliable guide for entrepreneurs making commitments in the darkness of time.
The gold standard thus provided maps and metrics that enabled entrepreneurs to act confidently across time and space. they were assured that in an ever-changing and insecure world the monetary measuring sticks would not change when they brought their products in for a landing in the marketplace.
As King Midas discovered, gold (and all candidates to be real money) is not wealth itself but a metric of wealth. While some gold advocates–including George Gilder in years past–have insisted that its slow but steady 2 percent rate of growth assures an expanding supply of money. But under a gold standard, the money supply has virtually nothing to do with the gold supply. In 1775, the total mount of currency in circulation (primarily gold and silver coins) was an estimated $12 million. In 1900, it was $1,954 million –an increase of 163X. During this time, the amount of gold in the world increased by about 3.4 times, due to mining production.
Since gold does not deteriorate, all the 189,000 tones of gold mined over the centuries remains available for use as money. Maintaining neutrality in time and space, gold is neither inflationary nor deflationary (KEY POINT!) It penalized neither creditors nor debtors. It is a measuring stick and unit of account for the world’s goods and services.
Bitcoin
Satoshi, the “founder” of Bitcoin believed that his mining algorithm was mimicking gold. Bitcoin did laboriously cancel out the advance of technology through its ten-minute mining cycles and lottery process.
However, Mike Kendall, who was drilling down into the economic model of bitcoin as a possible successor to the gold standard noted that “Contrary to the most egregiously erroneous and central tenet of the state theory of money, it was not government that decreed gold as money, rather it is only by holding gold that governments could EVEN ISSUE ANY FORM OF MONEY AT ALL.” http://manonthemargin.com/notes-on-the-bitcoin-standard/
Nakamoto invented digital scarcity….a digital good that is scarce and cannot be reproduced infinitely….a digital good whose transfer stops it from being owned by the sender..
“The limit on the quantity we can produce of any good is never its prevalence on the planet, but the effort and time dedicated to producing it. With its absolute scarcity, writes Ammous, “bitcoin is highly salable across time.”
THE FATAL FLAW
The fatal flaw is the belief that the money supply can and should be determined by the supply of bitcoin or gold. Gold (or bitcoin mimicking gold) should serve not only as a measuring stick or unit of account but as the actual medium for all exchanges.
Such monolithic money was also the ERROR of Murray Rothbard, an idiosyncratic exponent of Austrian theory who believed that any authentic gold standard must have 100 percent gold backing. He did not even believe in fractional reserve banking, intrinsic to the role of banks, which necessarily mediates between savers seeking safety and liquidity and entrepreneurs destroying it through long-term investments. The value of liquid savings is necessarily dependent on the achievements of illiquid and long-term enterprise. There is no way to avoid the maturity mismatch between savings and investments except by abolishing capitalism.
In the same way, bitcoin and other cryptocurrencies cannot become significant money without systems to intermediate between savers and investors. Money cannot be simply a smart contract. It entails continual acts of intelligent discretion in the provision of loans and investments responding to changes in markets and technologies.
Cameron Harwick of George Mason University makes the point that BITCOIN CANNOT SUCCEED AS A SMART CONTRACT; IT MUST BE COMPLEMENTED BY AN ENTREPRENURIAL BANKING FUNCTION:
If the main source of Bitcoin’s volatility is volatile demand, we can expect the issue and circulation of bitcoin-redeemable liabilities to stabilize the demand for and therefore the value of Bitcoin by allowi9ng fluctuations to be borne by changes in the supply of liabilities rather than by the price level or the volume of transactions.
A currency needs oracles to channel it to the most promising entrepreneurial uses.
As Kendall explains, “While Satoshi was brilliant in creating the blockchain as the basis for bitcoin, Satoshi had no understanding of currency as a unit of account. By limiting bitcoin’s supply to 21 million units over a 131-year period, Satoshi designed bitcoin as a deflationary currency….Because of its deflationary design, bitcoin is used more as a volatile investment bet: than as a MEASURING STICK or UNIT OF ACCOUNT. In other words, bitcoin’s fixed limit is deflationary and unworkable.
Bitcoin is the transactions medium ITSELF rather than a stable metric for the valuation of fiat moneys. For gold, transactions are incidental; for bitcoin, transactions are the key point. Bitcoin, unlike gold, must therefore increase in either volume or value if the system is to succeed.
Bitcoin, as now constituted, CANNOT BE A CURRENCY. Currencies create value by measuring it. The price of bitcoin changes with demand. You could respond that the price of the dollar also changes with demand. That has been mostly true since 1971, and such fluctuations are the Achilles heel of the dollar as a long-term currency.
“No other basic unit of measure,” says Kendall–whether it is the second, the meter, the ampere, or the kilogram-“changes in value with demand. They are standards” based on physical constants. IF MONEY IS A MEASURING STICK, IT CANNOT RESPOND TO DEMAND.
Since bitcoin cannot fulfill its basic role as a currency. its historical fate is to provide a haven from governments and central banks and a harbor for a great innovation, the blockchain.
Source: Life After Google by George Gilder.
—
The EXPERTS
Lorimer Wilson January 24, 2011
$5,000 Gold Bandwagon Now Includes 85 Analysts!
More and more economists, analysts and financial writers, 125 in fact, have taken the bold step of projecting the price at which gold will achieve its parabolic peak with 5 individuals claiming that the peak price will be realized sometime in 2011. Some have adjusted their previous prognostications higher given gold’s strong advance again in 2010 while others have jumped aboard what has become a bandwagon of optimism. The majority (85) maintain that $5,000 or more for gold is possible.
These 5 Analysts Believe Gold Will Reach Parabolic Peak Sometime in 2011
1. Bob Kirtley: $10,000;
2. Patrick Kerr: $5,000 – $10,000;
3. James Dines: $3,000 – $5,000;
4. Taran Marwah: $3,000;
5. Jim Sinclair: $3,000 – $5,000 (by June 2011);
These 6 Analysts See Gold Price Going Parabolic to +$10,000
1. Mike Maloney: $15,000;
2. Ben Davies: $10,000 – $15,000;
3. Howard Katz: $14,000;
4. Dr. Jeffrey Lewis: $7,000 – $14,000;
5. Jim Rickards: $4,000 – $11,000;
6. Roland Watson: $10,800
These 46 Analysts See Gold Price Peaking Between $5,001 and $10,000
1. Bob Kirtley: $10,000 (by 2011);
2. Arnold Bock: $10,000 (by 2012);
3. Porter Stansberry: $10,000 (by 2012);
4. Peter George: $10,000 (by Dec. 2015);
5. Tom Fischer: $10,000;
6. Shayne McGuire: $10,000;
7. Eric Hommelberg: $10,000;
8. David Petch: $6,000 – $10,000;
9. Gerald Celente: $6,000 – $10,000;
10. Egon von Greyerz: $6,000 – $10,000;
11. Peter Schiff: $5,000 – $10,000 (in 5 to 10 years);
12. Patrick Kerr: $5,000 – $10,000 (by 2011);
13. Peter Millar: $5,000 – $10,000;
14. Roger Wiegand: $5,000 – $10,000;
15. Alf Field: $4,250 – $10,000;
16. Jeff Nielson: $3,000 – $10,000;
17. Dennis van Ek: $9,000 (by 2015);
18. Dominic Frisby: $8,500;
19. Paul Brodsky: $8,000;
20. James Turk: $8,000 (by 2015);
21. Joseph Russo: $7,000 – $8,000;
22. Bob Chapman: $7,000+;
23. Michael Rozeff: $2,865 – $7,151;
24. Jim Willie: $7,000;
25. Dylan Grice: $6,300;
26. Chris Mack: $6,241.64 (by 2015);
27. Chuck DiFalco: $6,214 (by 2018);
28. Jeff Clark: $6,214;
29. Aubie Baltin: $6,200 (by 2017);
30. Murray Sabrin: $6,153;
31. Samuel “Bud” Kress: $6,000 (by 2014);
32. Adam Hamilton: $6,000;
33. Robert Kientz: $6,000;
34. Harry Schultz: $6,000;
35. John Bougearel: $6,000;
36. David Tice: $5,000 – $6,000;
37. Laurence Hunt: $5,000 – $6,000 (by 2019);
38. Taran Marwah: $3,000 – $6,000+ (by Dec. 2011 and Dec. 2012, respectively);
39. Martin Hutchinson: $3,100 – $5,700;
40. Stephen Leeb: $5,500 (by 2015);
41. Louise Yamada: $5,200;
42. Jeremy Charlesworth: $5,000+;
43. Przemyslaw Radomski: $5,000+;
44. Jason Hamlin: $5,000+;
45. Greg McCoach: $5,000+ (by 2012)
46. David McAlvany: $5,000+
Cumulative sub-total: 52
These 34 Analysts Believe Gold Price Could Go As High As $5,000
1. David Rosenberg: $5,000;
2. Doug Casey: $5,000;
3. Peter Cooper: $5,000;
4. Robert McEwen: $5,000 (by 2012 -2014);
5. Martin Armstrong: $5,000 (by 2016);
6. Peter Krauth: $5,000;
7. Tim Iacono: $5,000 (by 2017);
8. Christopher Wyke: $5,000;
9. Frank Barbera: $5,000;
10. John Lee: $5,000;
11. Barry Dawes: $5,000;
12. Bob Lenzer: $5,000 (by 2015);
13. Steve Betts: $5,000;
14. Stewart Thomson: $5,000;
15. Charles Morris: $5,000 (by 2015);
16. Marvin Clark: $5,000 (by 2015?);
17. Eric Sprott: $5,000;
18. Nathan Narusis: $5,000;
19. Bud Conrad: $4,000 – $5,000;
20. Paul Mylchreest: $4,000 -$5,000;
21. Pierre Lassonde: $4,000 – $5,000;
22. Willem Middelkoop: $4,000 – $5,000;
23. Mary Anne and Pamela Aden: $3,000 – $5,000 (by February 2012);
24. James Dines: $3,000 – $5,000 (by June 2011);
25. Goldrunner: $3,000 – $5,000 (by 2012);
26. Bill Murphy: $3,000 – $5,000;
27. Bill Bonner: $3,000 – $5,000;
28. Peter Degraaf; $2,500 – $5,000;
29. Eric Janszen: $2,500 – $5,000;
30. Larry Jeddeloh: $2,300 – $5,000 (by 2013);
31. Larry Edelson: $2,300 – $5,000 (by 2015);
32. Luke Burgess: $2,000 – $5,000;
33. Jim Sinclair: $3,000-$5,000 (by June 2011);
34. Marc Faber: $1,500 – $5,000
Cumulative sub-total: 86
These 27 Analysts Believe Gold Will Achieve a Parabolic Peak Price Between $3,000 and $4,999
1. David Moenning: $4,525;
2. Larry Reaugh: $4,000+;
3. Mike Knowles: $4,000;
4. Ian Gordon/Christopher Funston: $4,000;
5. Barry Elias: $4,000; (by 2020);
6. Jay Taylor: $3,000 – $4,000;
7. Christian Barnard: $2,500 -$4,000;
8. John Paulson: $2,400 – $4,000 (by 2012);
9. Myles Zyblock : $3,800;
10. Eric Roseman: $3,500+;
11. Christopher Wood: $3,360;
12. Franklin Sanders: $3,130;
13. John Henderson: $3,000+ (by 2015-17);
14. Michael Berry: $3,000+; (by 2015)
15. Hans Goetti: $3,000;
16. Michael Yorba: $3,000;
17. David Urban: $3,000;
18. Mitchell Langbert: $3,000;
19. Brett Arends: $3,000;
20. Ambrose Evans-Pritchard: $3,000;
21. John Williams: $3,000;
22. Byron King: $3,000;
23. Ron Paul: $3,000 (by 2020);
24. Chris Weber: $3,000 (by 2020);
25. Mark Leibovit: $3,000;
26. Mark O’Byrne: $3,000;
27. Kevin Kerr: $3,000
Cumulative sub-total: 113
Source:- http://www.munknee.com
There seems to be one name missing from the list. All those SWAGS have missed one important element. When you are talking about the price of gold, you are talking about two commodities, gold and whatever currency you are quoting the price in.
If you can’t predict the value of the dollar in the future with accuracy, you cannot predict the price of gold either.
You should buy gold when it is cheap and unloved. You should then sell it when it is expensive and everyone loves it.
A very interesting presentation of how Barrick is planning its future.
—
CORRECTION
I have often mention gold as a “Store of Value.” I never defined my terms.
I apologize. A better explanation by Keith Weiner of www.monetary-metals.com
Store of Value Fallacy
And this leads us to make one final, if tangential point. We often hear people talk about gold as a “store of value”. If you have a tank, that is a store of water. A grain silo is a store of wheat. In both cases, what is being stored is a quantity of a commodity. In this sense, a vault is a store of gold.
However, economic value—as we see above—is whatever the bidder is willing to pay. Gold’s moneyness does not come from it commanding the same amount of wheat today as it did last year or 2000 years ago. In fact, its purchasing power of wheat is not fixed. Over the last ten years, pricedingold.com shows that wheat has ranged from about 0.9 grams gold per bushel to 3.6g. The highest price during this time is 4X the lowest.
One reason for gold’s moneyness is that we value the next ounce of gold—the marginal ounce—the same as the last one. Proof of this extraordinary claim is observed in the extraordinary fact that virtually all gold ever mined in 5,000 years of human history is still in human hands. Gold is not produced to be consumed, but to be held. And we keep on producing, regardless of how much has already been produced.
In other words, we measure the value of gold like we measure the value of all other things in the economy—in gold. Gold does not have constant purchasing power (perhaps we should use scare quotes “purchasing power”). It has a constant price. The price of gold is always 1. This is not expressing a tautology. It is expressing that gold has constant marginal utility.
Gold is the steel meter stick of measuring economic values. Even if we climb in elevation (quantity) the meter (ounce) does not shrink.