

Moreover, just twelve months before the onset of the worst recession since the 1930s, Fred Mishkin revealed himself (Dec. 2006) to be as blind to the fundamentals of the American economy as he had been to those of Iceland (Mishkin confirmed that Iceland’s banking system was sound, weeks before the system collapsed). “There is a slight concern about a little weakness,” he averred, “but the right word is I guess a ‘smidgeon,’ not a whole lot.”
This stumbling misperception was not about the difficulties of forecasting the foggy future. Instead, it reflected the fact that the monetary central planners on the Fed were mesmerized by their own doctrine. For obvious reasons, they could not even begin to acknowledge that their chosen instruments of prosperity management-low interest rates, stuffing the privamary bond dealers with fresh cash via constant Treasury bond purcases, and the Greenspan Put–would inherently unleash a Wall Street-driven tidal wave of credit expansion and leveraged speculation.
http://youtu.be/5msVl3oZl4U (Mishkin Interview)
Why I’m Pessimistic about Stocks in general
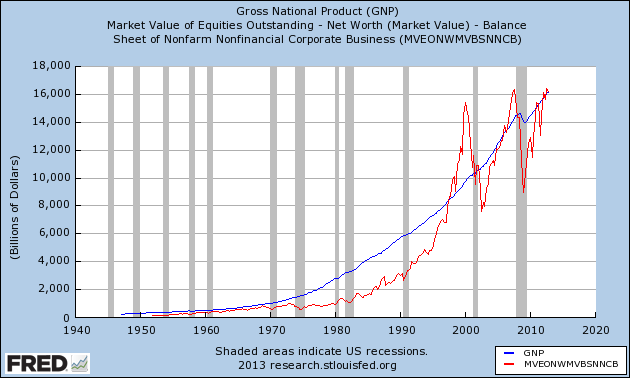
http://greenbackd.com/2013/03/28/fred-on-buffetts-favored-market-measure-total-market-value-to-gnp/
Geoff Gannon on P/Es, ROE and Finding Value
http://www.gurufocus.com/news/213944/why-im-pessimistic-about-stocks A good discussion on the need to NORMALIZE your estimates. Remember financial history and Regression to the Mean–especially in these unusual times of zero cost money.
Article:Gannon on ROE and Schiller PE and Q Ratio
You should take the time to read many of Geoff Gannon’s articles: http://www.gurufocus.com/news.php?key_word=gannon
Extrapolating Q
Unfortunately, the Q Ratio isn’t a very timely metric. The Flow of Funds data is over two months old when it’s released, and three months will pass before the next release. To address this problem, I’ve been experimenting with estimates for the more recent months based on a combination of changes in the VTI (the Vanguard Total Market ETF) price (a surrogate for line 35) and an extrapolation of the Flow of Funds data itself (a surrogate for line 32).
The Message of Q: Overvaluation
Based on the latest Flow of Funds data, the Q Ratio at the end of the fourth quarter was 0.90. Two months later, at the end of February, the broad market was up about 6.6%. My latest estimate would put the ratio about 40% above its arithmetic mean and 51% above its geometric mean. Of course periods of over- and under-valuation can last for many years at a time, so the Q Ratio is not a useful indicator for short-term investment timelines. This metric is more appropriate for formulating expectations for long-term market performance. As we can see in the next chart, the current level is still close to the vicinity of market tops, with Tech Bubble peak as an extreme outlier.
More here: Q Ratio: http://www.advisorperspectives.com/dshort/updates/Q-Ratio-and-Market-Valuation.php
Morningstar Market Graph: http://www.morningstar.com/cover/market-fair-value-graph.aspx
Opinion: The above articles are just for reference. Don’t pick a top–in fact, I would be surprised if stocks didn’t maintain their upward drift in the near term while folks feel “forced” to flee financial repression–but be conservative in your estimates and valuations–especially now. Don’t reach for relative value.