Part 1 of Graham’s Chapter 39 Newer Methods for Valuing Growth Stocks (Security Analysis 4th Ed.: http://wp.me/p2OaYY-1qQ
Also, what Graham said prior to this chapter on growth-stock investing:Growth in 2nd Edition
We will have another valuation case study next post to break-up this fusty theory. Read on.
Part 2: Valuation of DJIA in 1961 by this method.
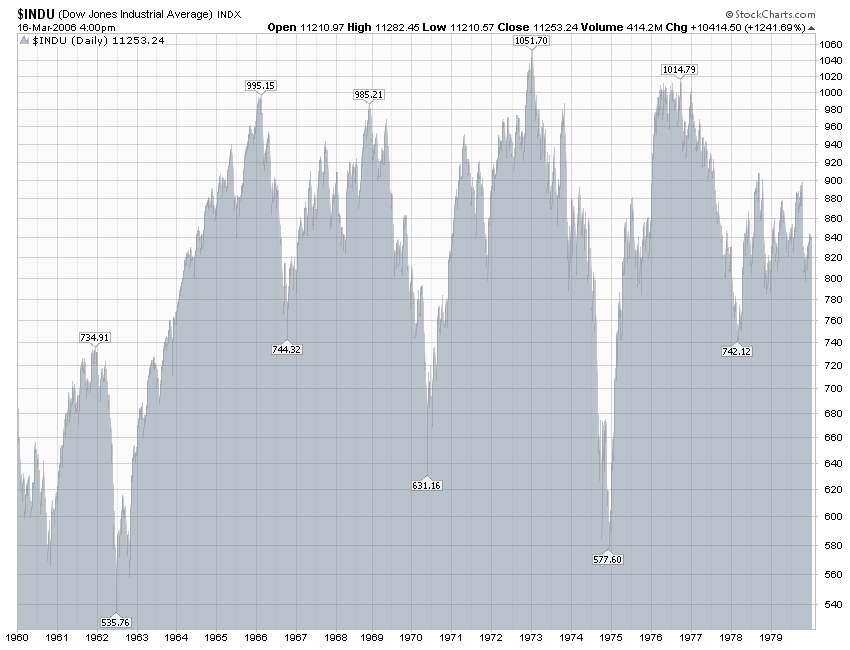
In a 1961 article, Molodovsky selected 5 percent as the most plausible growth rate for DJIA in 1961- 1970. This would result in a ten-year increase of 63 percent, raise earnings from a 1960 “normal” of say, $35 to $57, and produce a 1970 expected price of 765, with a 1960 discounted value of 365. To this must be added 70 percent of the expected ten-year dividends aggregating about $300—or $210 net. The 1960 valuation of DJIA, calculated by this method, works out at some $575. (Molodovsky advanced it to $590 for 1961.)
Similarity with Calculation of Bond Yields
The student should recognize that the mathematical process employed above is identical with that used to determine the price of a bond corresponding to a given yield, and hence the yield indicated by a given price. The value, or proper price, of a bond is calculated by discounting each coupon payment and also the ultimate principal payment to their present worth, at a discount rate of required return equal to the designated yield. In growth-stock valuation the assumed market price in the target year corresponds to the repayment of the bond at par at maturity.
Mathematical Assumptions Made by Others
While the calculations used in the DJIA example may be viewed as fairly representative of the general method, a rather wide diversity must be noted in the specific assumptions , or “parameters,” used by various writers. The original tables of Clendenin and Van Cleave carry the growth-period calculations out as far as 60 years. The periods actually assumed in calculations by financial writers have included 5 years (Bing) , 10 years (Molodovsky and Buckley), 12 to 13 years (Bohmfalk), 20 years (Palmer and Burrell), and up to 30 years (Kennedy) . The discount rate has also varied widely –from 5 percent (Burrell) to 9 percent (Bohmfalk).
The Selection of Future Growth Rates
Most growth-stock valuers will use a uniform period for projecting future growth and a uniform discount or required-return rate, regardless of what issues they are considering (Bohmfalk, exceptionally divides his growth stocks into three quality classes, and varies the growth period between 12 and 13 years, and the discount rate between 8 and 9 percent, according to class.) But the expected rate of growth will of course vary from company to company. It is equally true that the rate assumed for a given company will vary from analyst to analyst.
It would appear that the growth rate for any company could be established objectively if it were based entirely on past performance for an accepted period. But all financial writers insist, entirely properly, that the past growth rate should be taken only as one factor in analyzing a company and cannot be followed mechanically in setting the growth rate for the future. Perhaps we should point out, as a cautionary observation, that even the past rate of growth appears to be calculated in different ways by different analysts.
Multiplier Applied to “Normal Earnings”
The methods discussed produce a multiplier for a dollar of present earnings. It is applied not necessarily to the actual current or recent earnings, but to a figure presumed to be “normal”—i.e., to the current earnings as they would appear on a smoothed-out earning curve. Thus the DJIA multipliers in 1960 and 1961 were generally applied to “trend-line” earnings which exceeded the actual figures for those years—assumed to be “subnormal.”
Dividends vs. Earnings in the Formulas. A Simplification
The “modern” methods of growth—stock valuations represent a considerable departure from the basic concept of J.B. Williams that the present value of a common stock is the sum of the present worths of all future dividends to be expected from it. True, there is now typically a ten-to-twenty – year dividend calculation, which forms part of the final value. But as the expected growth rate increased from company to company, the anticipated payout tends also to decrease, and the dividend component loses in importance against the target year’s earnings.
Possible variations in the expected payout will not have a great effect on the final multiplier. Consequently the calculation process may be simplified by assuming a uniform payout for all companies of 60 percent in the next ten years. If T is the tenth-year figure attained by $1 of present earnings growing at any assumed rate, the value of the ten-year dividends works out at about 2.1 + 2.1 T. The present value of the tenth-year market price works out at 48 percent of 13.5T, or about 6.5T. ? Hence the total value of $1 of present earnings –or the final multiplier for the shares—would equal 8.6T + 2.1.
Table 39-1 gives the value of T and the consequent multipliers for various assumed growth rates.
Growth Rate Tenth-year earnings (T) Multiplier of present earnings (8.6T + 2.1)
2.5% $1.28 13.1x
4.0 1.48 14.8x
5.0 1.63 16.1x
6.0 1.79 17.5x
7.2 2.00 19.3x
8.0 2.16 20.8x
10.0 2.59 24.4x
12.0 3.11 28.8x
14.3 4.00 36.5x
17.5 5.00 45.1x
20.0 6.19 55.3x
These multipliers are a little low for the small growth rates, since they assume only a 60% payout. By this method the present value is calculated entirely from the current earnings and expected growth; the dividend disappears as a separately calculated factor. This anomaly may be accepted the more readily as one accepts also the rapidly decreasing importance of dividend payments in the growth-stock field.
To be continued……
An Apparent Paradox in Growth Stock Valuations

