Tag Archives: EBITDA

Lesson 4: The Acquirer’s Multiple

End nearWhat happens if you get scared half to death twice?  –S. Wright

We were unable to discover any ‘magic’ qualities associated with stocks selling below liquidation value. — Joel Greenblatt (How the Small Investor Can Beat the Market)

Enterprise Multiple = Earnings before interest, taxes, and depreciation & amortization, (“EBITDA”) divided by Enterprise Value (“EV”).

We need to understand the use of EBITDA, Why we must use EV, and the requirement to use pre-tax owner’s earnings or EBITDA – maintenance capex (“MCX”).

Placing EBITDA into Perspective (from the prior post) Suggested reading

EV The Price of a Business  Understanding and calculating EV. Suggested reading

Beginning lesson on Enterprise Value for beginners (Video, Khan Academy)

Pop Quiz: Why do you include minority interests with EV?

Why you use Enterprise Value (Review)

Minority Interests (Review)

Chapter 9 EV Multiples  Only if you dare. Heavy reading. Voluntary.

Let’s tackle really grasping the use of EV, EBITDA, and EBITDA – MCX

I will also send out the Little Book via email as supplementary reading for this chapter.

Good luck.

Question on ROE vs. ROCE; Comprehensive Look at EBITDA

EBITDA

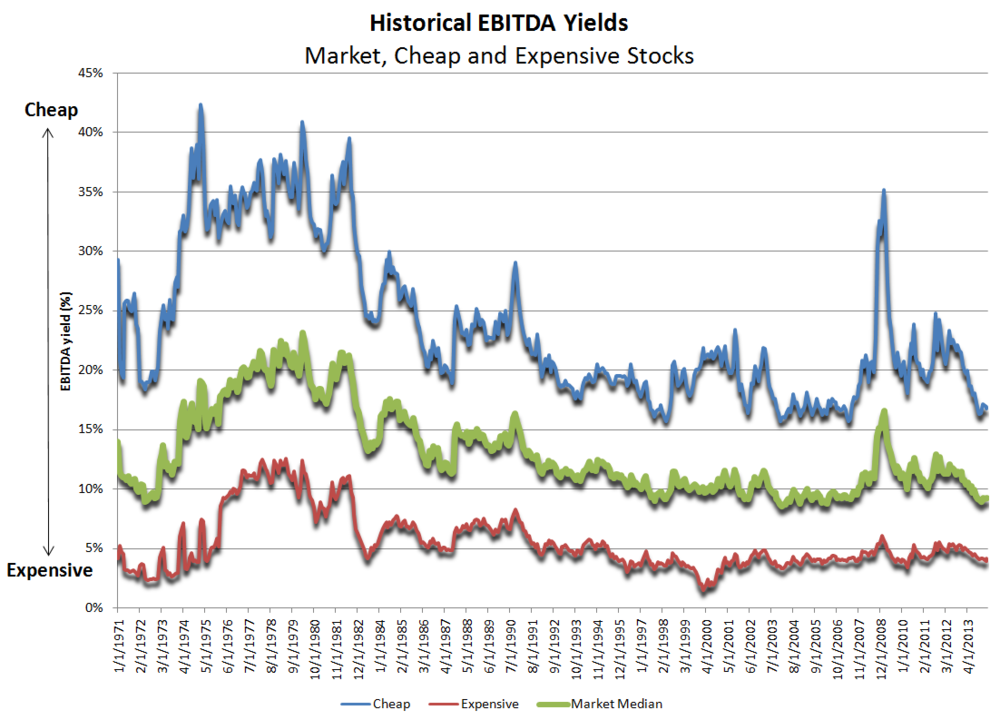
http://greenbackd.com/2014/04/28/median-stock-at-all-time-high-valuation/ and an interesting look at margins here:

Respecting the Reality of Change

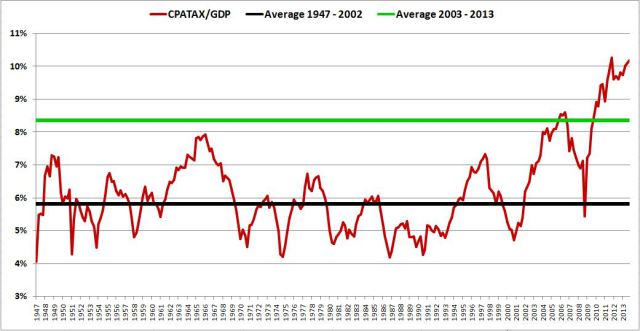
The following chart shows CPATAX divided by GDP from 1947 to present.  The black line represents the average from 1947 to 2002, and the green line represents the average from 2003 to 2013.
cptxa

As you can see in the chart, CPATAX/GDP is wildly elevated at present.  It currently sits 63.3% above its average from 1947 to 2013, and a whopping 75.0% above its average from 1947 to 2002.

As readers of this blog have probably inferred by now, I’m not very patient when it comes to waiting for “mean-reversion” to occur.  In my view, when a variable deviates for long periods of time from a reversion pattern that it has exhibited in the past, the right response is to expect something important to have changed–possibly for the long haul, such that a predictable reversion to prior averages will no longer be readily in the cards.  The task would then be to find out what that something is, and try to understand it. Go here:

http://philosophicaleconomics.wordpress.com/
http://www.millennialinvest.com/   (Interesting blog)

Reader Question:

Can you help me understand one aspect of ROE? In Indian companies, some of the companies have ROE < ROCE.

Isn’t that a violation of the observation that ROE ~ ROCE times Leverage.

I define ROCE as Return on Capital Employed.

ROCE = EBITDA (1-Tax Rate)/Total Capital Employed (=Debt+Equity)

I use ROCE as a measure of the attractiveness of the industry and the company. High ROCE is good, implying a moat, low ROCE is not.

Some of the reasons I could think of are:

  1.  Exceptional losses, which lead to Net Income << EBIT(1-Tax) *Leverage
  2.  Extremely high interest charges. ( higher than return on the        debt portion) which leads Net Income << EBIT(1-Tax)* Leverage
  3.  There is a slump sale of a division, and thus suddenly huge            amount of profit has come in increasing inordinately the            average shareholder equity. So suddenly the effective leverage        has dropped.

Update May 1: 

I made a mistake in describing ROCE.  In my defense, I dont exactly calculate ROCE and merely use the numbers from screens.
ROCE = EBIT(1-Tax Rate)/ Total Assets and not EBITDA as mentioned before.

Does someone want to have a crack at this? I see issues whenever you use EBITDA without understanding maintenance capex. Please read this: Placing EBITDA into Perspective

More on WMT: A reader posted this in the comment section: http://www.fool.com/investing/general/2014/04/28/why-is-wal-mart-failing-in-emerging-markets.aspx.    Does that article even touch upon the ture nature of WMT’s competitive advantage?  No wonder the obvious is overlooked.

EBITDA leading to EBIT and then to ROIC; Accounting blogs

We literally called Jon Corzine. We called Jon Corzine because we knew that he knew about the economy, about the world markets, about how we had to respond.” –Vice President Joe Biden, talking about the people he asked for advice from during the financial crisis.

Jon Corzine recently resigned as the CEO of MF Global. The firm declared bankruptcy after making bad bets on European Sovereign debt.
The bankruptcy was the fourth-largest financial firm in U.S. history, and the eighth largest overall.

EBITDA into Perspective

We will finish our discussion on return on invested capital (ROIC) this week, but first let’s return to fundamentals. Joel Greenblatt uses (EBITDA minus maintenance capital expenditures (“MCX”) as his proxy for Operating Earnings or EBIT.

Many may have not seen the 36-page PDF on placing EBITDA into context*. Once we know MCX, we can subtract that estimated figure from EBITDA to arrive at pre-tax operating income–the bedrock upon which we divide by the amount of capital used to produce such income for calculating ROIC.

We will discuss MCX in another post.

EBITDA mentioned here: http://csinvesting.org/placing-ev-and-ebitda-into-perspective-case-studies/

*Placing EBITDA into perspective (36-page PDF): http://www.scribd.com/doc/66843869/Placing-EBITDA-Into-Perspective

Recent blog discussion on EBITDA: http://blogs.smeal.psu.edu/grumpyoldaccountants/archives/542

Educational Blogs on Accounting and Financial Statement Analysis

http://mgt.gatech.edu/news_room/news/2009/articles/FALreporttaxpayments.html

http://www.10qdetective.blogspot.com/

http://accountingonion.typepad.com/

http://www.footnoted.com/

http://www.footnoted.com/

http://www.thebigdo-over.com/

http://www.proxydemocracy.org/

http://sharesleuth.com/

http://blog.issgovernance.com/