Tag Archives: accounting

Is Book Value as Relevant as it used to be? (Part 1)

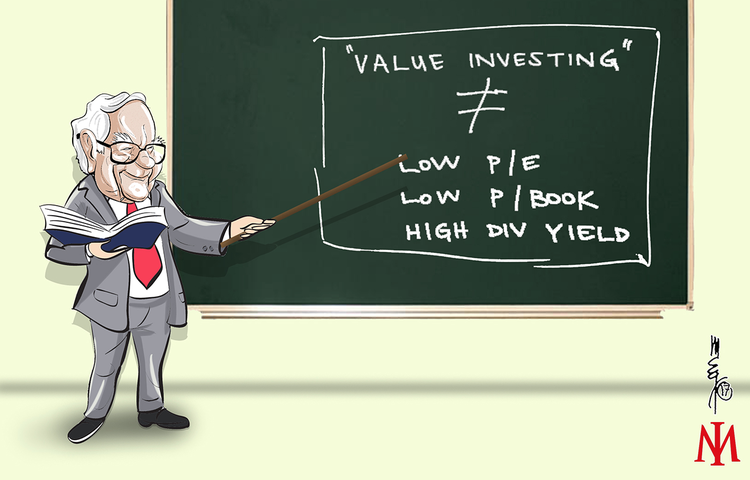
What Worked in Investing-Tweedy Browne

WhatHasWorkedFundOct14Web

Low price to book value or high book value to price was an INDICATOR of value but no guarantee to coincide with intrinsic value as Buffett explains:

“In past reports I have noted that book value at most companies differs widely from intrinsic business value – the number that really counts for owners.” Berkshire 1986 Letter

“Book value’s virtue as a score-keeping measure is that it is easy to calculate and doesn’t involve the subjective (but important) judgments employed in calculation of intrinsic business value.

It is important to understand, however, that the two terms – book value and intrinsic business value – have very different meanings. Book value is an accounting concept, recording the accumulated financial input from both contributed capital and retained earnings. Intrinsic business value is an economic concept, estimating future cash output discounted to present value. Book value tells you what has been put in; intrinsic business value estimates what can be taken out.

An analogy will suggest the difference. Assume you spend identical amounts putting each of two children through college. The book value (measured by financial input) of each child’s education would be the same. But the present value of the future payoff (the intrinsic business value) might vary enormously – from zero to many times the cost of the education. So, also, do businesses having equal financial input end up with wide variations in value.” Berkshire 1983 Letter

“Some investors weight book value heavily in their stock-buying decisions (as I, in my early years, did myself). And some economists and academicians believe replacement values are of considerable importance in calculating an appropriate price level for the stock market as a whole.

Those of both persuasions would have received an education at the auction we held in early 1986 to dispose of our textile machinery. The equipment sold (including some disposed of in the few months prior to the auction) took up about 750,000 square feet of factory space in New Bedford and was eminently usable. It originally cost us about $13 million, including $2 million spent in 1980-84, and had a current book value of $866,000 (after accelerated depreciation). Though no sane management would have made the investment, the equipment could have been replaced new for perhaps $30-$50 million.
Gross proceeds from our sale of this equipment came to $163,122. Allowing for necessary pre- and post-sale costs, our net was less than zero. Relatively modern looms that we bought for $5,000 apiece in 1981 found no takers at $50. We finally sold them for scrap at $26 each, a sum less than removal costs.
Ponder this: the economic goodwill attributable to two paper routes in Buffalo – or a single See’s candy store – considerably exceeds the proceeds we received from this massive collection of tangible assets that not too many years ago, under different competitive conditions, was able to employ over 1,000 people.” Berkshire 1985 Letter

“Of course, it’s per-share intrinsic value, not book value, that counts. Book value is an accounting term that measures the capital, including retained earnings, that has been put into a business. Intrinsic value is a present-value estimate of the cash that can be taken out of a business during its remaining life. At most companies, the two values are unrelated.” Berkshire 1993 Letter

“We define intrinsic value as the discounted value of the cash that can be taken out of a business during its remaining life. Anyone calculating intrinsic value necessarily comes up with a highly subjective figure that will change both as estimates of future cash flows are revised and as interest rates move. Despite its fuzziness, however, intrinsic value is all- important and is the only logical way to evaluate the relative attractiveness of investments and businesses.

To see how historical input (book value) and future output (intrinsic value) can diverge, let’s look at another form of investment, a college education. Think of the education’s cost as its “book value.” If it is to be accurate, the cost should include the earnings that were foregone by the student because he chose college rather than a job.

For this exercise, we will ignore the important non-economic benefits of an education and focus strictly on its economic value. First, we must estimate the earnings that the graduate will receive over his lifetime and subtract from that figure an estimate of what he would have earned had he lacked his education. That gives us an excess earnings figure, which must then be discounted, at an appropriate interest rate, back to graduation day. The dollar result equals the intrinsic economic value of the education.

Some graduates will find that the book value of their education exceeds its intrinsic value, which means that whoever paid for the education didn’t get his money’s worth. In other cases, the intrinsic value of an education will far exceed its book value, a result that proves capital was wisely deployed. In all cases, what is clear is that book value is meaningless as an indicator of intrinsic value.” Berkshire 1994 Letter

Is Accounting as Useful as an Indicator as it Used to be?

Recent years has seen the brisk rise in market value of businesses defined by their network effects and operational leverage to the new economy rather than those dependent on traditional accounting defined forms of capital. Also, we have seen rising domestic Gini coefficients despite global improvements in aggregate output. Capitalism without Capital investigates the increased investment in intangible assets and their place in the modern economy.

The book is about the change in the type of investment observed in more or less all developed countries over the past forty years.  The authors argue:

  1. There has been a long-term shift from tangible to intangible investment.
  2. Much of that shirt does not appear in company balance sheets and national accounts because accountants and statisticians tend not to count intangible spending as an investment, but rather as day-to-day expenses.
  3. The tangible, knowledge-based assets that intangible investment builds have different properties relative to tangible assets: they are more likely to be scalable and have sunk costs; and their benefits are likely to spill over and exhibit synergies with other intangibles.

Is Book Value Irrelevant?

http://thereformedbroker.com/2018/04/30/is-book-value-irrelevant/

To be continued………..

Poking Holes in the Market Bubble Hypothesis

Nygren Commentary September 30, 2017

CSInvesting: We can’t increase our IQ but we can try to improve our critical thinking skills by seeking out opposing views to the now current din of pundits screaming that this “over-valued market is set to crash.”  1987 here we come.  What do you think of his arguments?  I certainly agree about how GAAP accounting punishes growth investments.  

At Oakmark, we are long-term investors. We attempt to identify growing businesses that are managed to benefit their shareholders. We will purchase stock in those businesses only when priced substantially below our estimate of intrinsic value. After purchase, we patiently wait for the gap between stock price and intrinsic value to close.

“All the company would have to do is raise prices 50% and the P/E ratio would fall to the low-teens.”   -Analyst recommending a new stock purchase

We are nine years into an economic and stock market recovery and P/E ratios are elevated somewhat beyond historic averages. So when an experienced portfolio manager hears a young analyst make the above comment, he hears alarm bells. But instead of seeing this as a sign that the market has peaked, we purchased the stock for the Oakmark Fund. But, more on that later.

For several years, the financial media has been dominated by pronouncements that the bull market is over. Throughout my career, I can’t remember a more hated bull market. Many state that a recession is “overdue” since past economic booms have almost never lasted as long as this one. But do nine years of sub-normal economic growth even constitute a recovery, much less a boom? If recessions occur to correct excesses in the economy, has this recovery even been strong enough to create any? Maybe recessions are less about duration of the recoveries they follow and more about the magnitude. If so, earnings might not even be above trend levels.

Bears will also point to the very high CAPE ratio—or the cyclically adjusted P/E. That metric averages corporate earnings over the past decade in an attempt to smooth out peaks and valleys. But remember that the past decade includes 2008 and 2009, frequently referred to as the “Great Recession” because of how unusually bad corporate earnings were. I’ll be the first to say that if you think an economic decline of that magnitude is a once-in-a-decade event, you should not own stocks today. But if it is more like a once-in-a-generation event, then that event is weighted much too heavily in the CAPE ratio. If the stock market and corporate profits maintained their current levels for the next two years—an outcome we would find disappointing—simply rolling off the Great Recession would result in a large decline in the CAPE ratio.

Higher P/E ratios are also caused by near-zero short-term interest rates because corporate cash now barely adds to the “E” in the P/E ratio. When I started in this business in the early 1980s, cash earned 8-9% after tax. Consider a simple example of a company whose only asset is $100 of cash and the market price is also $100. In the early 1980s, the $8 or $9 of interest income would generate a P/E ratio of about 12 times. Today, $100 would produce less than $1 of after-tax income, driving the P/E ratio north of 100 times. There is, of course, uncertainty as to whether that cash will eventually be returned to shareholders or invested in plants or acquisitions, but it seems that making a reasoned guess about the value of cash is more appropriate than valuing it at almost nothing.

A less obvious factor that is producing higher P/E ratios today is how accounting practices penalize certain growth investments. When a company builds a new plant, GAAP accounting spreads that cost over its useful life—often 40 years—so the cost gets expensed through 40 years of depreciation as opposed to just flowing through the current income statement.

But when Amazon hires engineers and programmers to help it prepare for sales that could double over the next four years, those costs get immediately charged to the income statement. When Facebook decides to limit the ad load on WhatsApp to allow it to quickly gain market share, the forgone revenue immediately penalizes the income statement. And when Alphabet invests venture capital in autonomous vehicles for rewards that are years and years away, the costs are expensed now and current earnings are reduced.

The media is obsessed with supposedly bubble-like valuations of the FANG stocks—Facebook, Amazon, Netflix and Google (Alphabet). The FANG companies account for over 7% of the S&P 500 and sell at a weighted average P/E of 39 times consensus 2017 earnings. In our opinion, the P/E ratio is a very poor indicator of the value of these companies. Alphabet is one of our largest holdings, and our valuation estimate is certainly not based on its search division being worth 40 times earnings. If one removed the FANG stocks from the S&P multiple calculation—not because their multiples are high, but because they misrepresent value—the market P/E would fall by nearly a full point. And, clearly, more companies than these four are affected by income statement growth spending.

In addition, no discussion of stock valuations would be complete without some consideration of opportunities available in fixed income. Many experts argue that investors should sell their stocks because the current S&P 500 P/E of 19 times is higher than the 17 times average of the past 30 years. By comparison, if we think of a long U.S. Treasury bond—say, 30 years—in P/E terms, the current yield of 2.9% results in a P/E of 34 times. The average yield on long Treasuries over the past 30 years has been 5.5%, which translates to a P/E of 18 times. Relative to the past 30 years, the long bond P/E is now 90% higher than average. We don’t think the bond market at current yields is any less risky than equities.

The point of this is not to advance a bullish case for stocks, but rather to poke holes in the argument that stocks are clearly overvalued.

We think our investors would also fare best by limiting their in-and-out trading. We suggest establishing a personal asset allocation target based on your financial position and risk tolerance. Then limit your trading to occasionally rebalancing your portfolio to your target. If the strong market has pushed your current equity weighting above your target, by all means take advantage of this strength to reduce your exposure to stocks.

Now, back to the P/E ratio distortions caused by investing for growth. This highlights a costly decision we made six years ago. In 2011, when Netflix traded at less than $10 per share, one of our analysts recommended purchase because the price-per-subscriber for Netflix was a fraction of the price-per-subscriber for HBO. Given the similarity of the product offerings and Netflix’s rapid growth, it seemed wrong to value the company’s subscribers at less than HBO’s. But, at the time, streaming was a relatively new technology, HBO subscribers had access to a much higher programming spend than Netflix subscribers and Netflix was primarily an online Blockbuster store, providing access to a library of very old movies. Netflix had only one original show that subscribers cared about, House of Cards, and churn was huge as they would cancel the service after a month of binging on the show. Despite the attractive price-per-sub, we concluded that the future of Netflix was too uncertain to make an investment.

Today, Netflix trades at $180 per share and has more global subscribers than the entire U.S. pay-TV industry. Netflix provides its subscribers access to more than two times the content spending that HBO offers, making it very hard for HBO to ever match the Netflix value proposition. Finally, Netflix is no longer just a reseller of old movies. The company has doubled its Emmy awards for original programming in each of the past two years and now ranks as the second most awarded “network.” On valuation, Netflix is still priced similarly to the price-per-subscriber implied by AT&T’s acquisition of HBO’s parent company Time Warner, despite Netflix subscribers more than quadrupling over the past four years while HBO subscribers have grown by less than one third.

Last quarter, when our analyst began his presentation recommending Netflix, selling at more than 100 times estimated 2017 earnings, I was more skeptical than usual. His opening comment was that Netflix charges about $10 per month while HBO Now, Spotify and Sirius XM each charge about $15. “All the company would have to do is raise prices 50% and the P/E ratio would fall to the low teens,” he argued. Anecdotally, those who subscribe to several of these services tend to value their Netflix subscription much higher despite its lower cost. Quantitatively, revenue-per-hour-watched suggests Netflix is about half the cost (subscription fees plus ad revenue) of other forms of video. Netflix probably could raise its price to at least $15 without losing many of its subscribers. For those reasons, Netflix is now in the Oakmark portfolio.

So, is Netflix hurting its shareholders by underpricing its product? We don’t think so. Like many network-effect businesses, scale is a large competitive advantage for content providers. Scale creates a nearly impenetrable moat for new entrants to cross. With more subscribers than any other video service, Netflix can pay more for programming and still achieve the lowest cost-per-subscriber. As shareholders of the company, we are perfectly amenable to Netflix’s decision to forfeit current income to rapidly increase scale.

Because we are value investors, when companies like Alphabet or Netflix show up in our portfolio, it raises eyebrows. Investors and advisors alike are full of questions when investors like us buy rapidly growing companies, or when growth investors buy companies with low P/Es. Portfolio managers generally don’t like to be questioned about their investment style purity, so they often avoid owning those stocks. We believe our portfolios benefit from owning stocks in the overlapping area between growth and value. Therefore, we welcome your questions about our purchases and are happy to discuss the shortcomings of using P/E ratio alone to define value.

Question on ROE vs. ROCE; Comprehensive Look at EBITDA

EBITDA

http://greenbackd.com/2014/04/28/median-stock-at-all-time-high-valuation/ and an interesting look at margins here:

Respecting the Reality of Change

The following chart shows CPATAX divided by GDP from 1947 to present.  The black line represents the average from 1947 to 2002, and the green line represents the average from 2003 to 2013.

cptxa

As you can see in the chart, CPATAX/GDP is wildly elevated at present.  It currently sits 63.3% above its average from 1947 to 2013, and a whopping 75.0% above its average from 1947 to 2002.

As readers of this blog have probably inferred by now, I’m not very patient when it comes to waiting for “mean-reversion” to occur.  In my view, when a variable deviates for long periods of time from a reversion pattern that it has exhibited in the past, the right response is to expect something important to have changed–possibly for the long haul, such that a predictable reversion to prior averages will no longer be readily in the cards.  The task would then be to find out what that something is, and try to understand it. Go here:

http://philosophicaleconomics.wordpress.com/
http://www.millennialinvest.com/   (Interesting blog)

Reader Question:

Can you help me understand one aspect of ROE? In Indian companies, some of the companies have ROE < ROCE.

Isn’t that a violation of the observation that ROE ~ ROCE times Leverage.

I define ROCE as Return on Capital Employed.

ROCE = EBITDA (1-Tax Rate)/Total Capital Employed (=Debt+Equity)

I use ROCE as a measure of the attractiveness of the industry and the company. High ROCE is good, implying a moat, low ROCE is not.

Some of the reasons I could think of are:

  1.  Exceptional losses, which lead to Net Income << EBIT(1-Tax) *Leverage
  2.  Extremely high interest charges. ( higher than return on the        debt portion) which leads Net Income << EBIT(1-Tax)* Leverage
  3.  There is a slump sale of a division, and thus suddenly huge            amount of profit has come in increasing inordinately the            average shareholder equity. So suddenly the effective leverage        has dropped.

Update May 1: 

I made a mistake in describing ROCE.  In my defense, I dont exactly calculate ROCE and merely use the numbers from screens.
ROCE = EBIT(1-Tax Rate)/ Total Assets and not EBITDA as mentioned before.

Does someone want to have a crack at this? I see issues whenever you use EBITDA without understanding maintenance capex. Please read this: Placing EBITDA into Perspective

More on WMT: A reader posted this in the comment section: http://www.fool.com/investing/general/2014/04/28/why-is-wal-mart-failing-in-emerging-markets.aspx.    Does that article even touch upon the ture nature of WMT’s competitive advantage?  No wonder the obvious is overlooked.

What Is Behind The Numbers?

510y1Ll7csL._SL160_PIsitb-sticker-arrow-dp,TopRight,12,-18_SH30_OU01_AA160_

With sentiment high and stocks in general having rallied for five years, be very careful about the financial numbers in your companies. A strong review of financial shenanigans is worth your time.

John Del Vecchio and Tom Jacobs, the authors of What’s Behind the Numbers?, are giving a presentation at the New York Society of Analysts. See sample chapter:WBTN_DelJacobs_samplechapter

Attendees will learn:

  1. How companies hide poor earnings quality
  2. Repeatable methods for uncovering what companies don’t tell you about their numbers
  3. Reliable formulas for determining when a stock will get hit

Whether you’re a number cruncher or just curious, you’ll greatly benefit from this seminar, given by two people who combine investment chops with crowd-pleasing stories. So what are you waiting for?

Date: January 13, 2014
Time: 6:30 – 8 pm
Place: NYSSA Conference Center
1540 Broadway, Suite 1010
(entrance on 45th Street)
New York, NY 10036
Price: Nonmember $55 ($10 surcharge for walk-ins)

Advance registration is encouraged in order to avoid the additional charge for walk-ins. Also, space is limited by the size of the room.

https://www.youtube.com/watch?v=G-YYwz9oSPM

The above video is worth viewing. Just remember that the authors do not understand the causes of inflation, but you will learn more about individual investor psychology. Jacobs provides plenty of excellent advice for individuals in terms of search and strategy. Go small and look for wholesale emotional selling.

If you don’t want to invest in stocks, then go here:

Cisco (CSCO) Case Study; The Lord of Dark Matter

SLAP

Next the statesmen will invent cheap lies, putting the blame upon the nation that is attacked (Syria), and every man will be glad of those conscience-soothing falsities, and will diligently study them, and refuse to examine any refutation of them; and thus he will by and by convince himself that the war is just, and will thank God for the better sleep he enjoys after this process of grotesque self-deception.” –Mark Twain

“When the rich make war, it is the poor that die.”–Jean-Paul Sartre

Case Study of Cisco:

CSCO Chart

Case Study on Cisco Third Quarterly Earnings  (includes 2012 for comparison purposes).  Instructions and questions in the document.

CSCO_VL   (for reference) CSCO March 2013 Qtr Report

Please explain what you see.

The Lord of Dark Matter

Fleckenstein:  “Probably anyone who listens to your wonderful interviews already understands that money printing can’t solve anything … Most recently the housing bubble led to the collapse in 2008/2009, and now we’ve got QE of biblical proportions being foisted upon us by the Fed, BOJ (Bank of Japan), Swiss National Bank, and probably the BOE (Bank of England) soon, etc.

The irony of it all is that 5 years into zero rates, and America alone (with) $5 or $6 trillion of deficit spending, the economy is still crummy.  No one ever says, ‘Why is that?’  Well, the reason is because money printing doesn’t work.”

….Everybody and his brother is bearish.  I get sent two articles a day about some knucklehead who’s bearish on gold.  Well, you know what?  They are all bearish for the same two reasons:  The chart looks bad, and the price is wrong.  Like they know what the price (should be).  How do any of us know what the price is supposed to be?  It’s just a price.

Click the link below to hear the twelve-minute interview:

http://www.kingworldnews.com/kingworldnews/Broadcast/Entries/2013/6/6_Bill_Fleckenstein.html

HUI CHART

Serial Bubbles: 

http://www.zerohedge.com/news/2013-06-06/why-serial-asset-bubbles-are-now-new-normal


P.S. I have been a bit swamped with work, so I will post next week. Be well and BE CAREFUL!


For Beginners: Linkages between Financial Statements or How to Read a Financial Statement

A reader posts a question

I haven’t started investing yet but can’t wait to do so once I get a job. I am still developing my investment strategy and plan.

I think I am able to do basic valuations and financial modelling. BUT the one thing I can’t get my head around is: Linkages between financial statements.

This is the most important issue that is not being discussed here. I agree with V4Value that learning financial statement analysis would be an excellent idea. Unfortunately, there doesn’t seem to be any good, free online courses such as there are for valuations. I have been able to find this  course which comes close to what I am looking for: http://ocw.mit.edu/courses/sloan-school-of-management/15-535-business-analysis-using-financial-statements-spring-2003/lecture-notes/

But no video lectures! :(

CSInvesting Accounting Sources

Thanks for your dilemma and your excellent link above to the MIT accounting course (free).  Here are two books (of course, in the VALUE VAULT.  Email me at aldridge56@aol.com with VALUE VAULT in the subject line and I will send a key within 48 hours).

Ben Graham’s Classic Book: Interpretation_of_Financial_Statments-1

Tracy’s book on how financial statements link together: How_to_Read_a_Financial_Report

Videos on Accounting

Here is one link for an accounting lecture on common-size financial statements:

http://www.learnerstv.com/video/Free-video-Lecture-1170-Management.htm (Click on videos at the top of the web-page for videos on accounting and many other courses) A great series of videos for a Saturday night date.  Seriously, another supplement to what you learn from books. The next step is to go through a company annual report of a company that interests you.

Short lectures on financial topics or many other subjects: http://www.khanacademy.org/

Good luck!