Category Archives: Uncategorized

Apple Case Study File Part 2

Fordipod
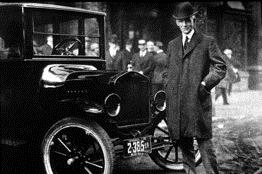
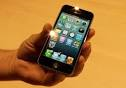
The Model-T vs. IPhone


We first discussed Apple (AAPL) here: http://wp.me/p2OaYY-1Fi

LT Chart of Apple

As a reader made clear on our prior post on Apple, anticipating or foreseeing Apple’s stupendous success would take insight, knowledge and clairvoyance that few–especially this writer–possess.  So what’s the point? Can we learn anything to add to our skills?

Well, we can compare Apple to other great innovations like the first mass-produced car, the Ford Model-T. We can look at technology companies that lost their genius founder like Polaroid and compare and contrast with Apple. Also, we can look at the expectations the market had for Apple vs. the law of large numbers–the huge size of the company, its huge dominance of an important, growing market that made the odds of maintaining its current rate of success vs. expectations quite low.

When expectations are high for already outstanding success we need look no further than the Nifty Fifty for what can happen. Please read:The Delusions of High Growth Expectations and valuing-growth-stocks-revisiting-the-nifty-fifty .

Here is an excellent article from the Wall Street Journal discussing Apple in historical perspective: WSJ_Apple.

I will be building my case file on Apple including past annual reports. If readers come across anything pertaining to Apple or other companies in the same context, please alert me and I will post and add to the case file.  Everyday there are lessons to be had, but I chose Apple for its sheer influence on our daily lives.

THANKS!

Update Feb. 8, 2013

Following a Herd of Bulls on Apple By 

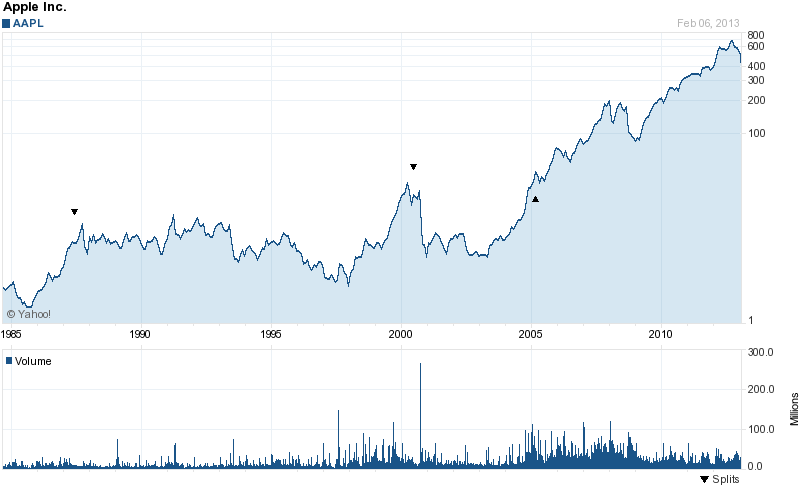
Last September, Apple shares hit a record $705. And to the overwhelming majority of Wall Street analysts, that meant one thing: buy.

By November, with Apple stock in the midst of a precipitous decline, they were still bullish. Fifty of 57 analysts rated it a buy or strong buy; only two rated it a sell. Apple shares continued their plunge, and this week were trading at just over $450, down 36 percent from their peak.       

How could professional analysts have gotten it so wrong?

It wasn’t supposed to be this way. A decade ago, Congressional hearings and an investigation by Eliot Spitzer, then the New York attorney general, exposed a maze of conflicts of interest afflicting Wall Street research. There were some notorious examples of analysts who curried favor with investment banking clients and potential clients by producing favorable research, and then were paid huge bonuses out of investment banking fees. Many investors and regulators blamed analysts’ overly bullish forecasts for helping to inflate the dot-com bubble that burst in 2000.

After a global settlement of Mr. Spitzer’s investigation by major investment banks and the Sarbanes-Oxley reform legislation in 2002, investment banking and research operations were segregated. Conflicts had to be disclosed, and research and analyst pay was detached from investment banking revenues, among other measures.

These reforms seem to have worked — but only up to a point. Other conflicts have come to the fore, especially at large brokerage firms and investment banks. And studies have shown that analysts are prone to other influences — like following the herd — that can undermine their judgments. “The reforms didn’t necessarily make analysts better at their jobs,” said Stuart C. Gilson, a professor of finance at Harvard Business School.

It may be no coincidence that the only analyst who even came close to calling the peak in Apple’s stock runs his own firm and is compensated based on the accuracy of his calls. Carlo R. Besenius, founder and chief executive of Creative Global Investments, downgraded Apple to sell last Oct. 3, with shares trading at $685. In December, he lowered his price target to $420, and this week he told me he may drop it even further, to $320.

Mr. Besenius founded his firm a decade ago after spending many years in research at Merrill Lynch and Lehman Brothers. “I saw so many conflicts of interest in trading, investment banking and research, so I started a conflict-free company,” he said this week from Luxembourg, where he was born and now lives. “Wall Street is full of conflicts. It still is and always will be. It’s incompetent at picking stocks.”       

Since the passage of Sarbanes-Oxley, several studies have documented a decline in the percentage of analysts’ buy recommendations, albeit a modest one, while sell recommendations have increased. “Before 2002, analyst recommendations were tilted toward optimistic at an extreme rate,” Ohad Kadan, a professor of finance at Washington University in St. Louis, and co-author of one of the studies, told me this week. “That’s still true today, but it’s not as extreme. It’s a little more balanced.”

While investment banking conflicts have been addressed, “the most obvious conflict now is that research is funded through the trading desks,” Professor Gilson said. “If you’re an analyst and one way your report brings in revenue is through increased trading, a buy recommendation will do this more than a sell. For a sell, you have to already own the stock to generate a trade. But anybody can potentially buy a stock. That’s one hypothesis about why you still see a disproportionate number of buy recommendations.” That may be especially true for heavily traded stocks like Apple, which generate huge commissions for Wall Street.

But no one thinks conflicts alone can explain the analysts’ abysmal recent Apple performance. “There’s too much unanimity,” Bruce Greenwald, a professor of finance and asset management at Columbia Business School and a renowned value investor, told me this week. “That’s what’s so troubling. When that many analysts are in agreement, they can’t all be conflicted.”       

He and other experts say there are additional documented factors that help explain why Wall Street analysts are so often wrong: they extrapolate from recent performance data; they chase momentum; they want to please their customers; and they show a tendency toward herd behavior. Which is to say, they fall into the same pitfalls that afflict most investors.

“Why aren’t they more sophisticated? You’d hope they would be,” Professor Kadan said. “But they always fall into the same traps.”

Professor Greenwald agreed. “When something goes up, they all put out buy recommendations. Their models extrapolate past performance into the future. They chase momentum. With Apple, they were right at $600, and they were right at $650, which reinforced the trend. So why would they be wrong at $700?”

Professor Kadan said that momentum investing has its adherents, and is often right, at least in the short term that many investors focus on. “You’d hope that analysts, of all people, would be able to anticipate an abrupt reversal, but they’re not very good at it. They loved Apple at $700. I’m sure they were trying to do their best, but they’re prisoners of momentum.”

Another factor is that analysts have a tendency to tell their audience what it wants to hear. “The analysts are in the end sales people,” Professor Greenwald said. “Their credibility depends on their not upsetting their investors too much. Everybody loved Apple, everybody did well. The bears were always wrong. It took an enormous amount of courage to fight the tide.”

Professor Kadan agreed. “Analysts tend to herd. There’s no big penalty if you’re wrong, because everyone else is wrong. You’ve got cover. You’re not going to lose your job. If you take a different opinion, either you get a big prize if you’re right, or you lose your job. An analyst needs to be really courageous to say something different from most other analysts.”

Mr. Besenius, the one analyst who downgraded Apple near its peak, said, “I’m not afraid to make big, controversial calls,” but attributed his decision less to courage than to survival. “I’m paid based on performance,” he said. “I have to go to my clients and explain why they should pay for my research when they can get it for nothing from the firms where they pay their trading commissions.”

Mr. Besenius based his recommendation on technical factors — as Apple hit $700, its upward momentum and trading volume were slowing — as well as more fundamental concerns about product quality and innovation, as well as growing competition from rivals like Samsung. And there were more subjective factors. Mr. Besenius said he became uncomfortable with what he deemed Apple’s arrogance. “I loved Steve Jobs,” he said. “He built a great company. But he was one of the most arrogant C.E.O.’s I’ve ever met. The way he introduced new products was one big display of arrogance. He ridiculed Microsoft as ‘Micro who?’ That’s a good reason to be cautious. A little humility is a good thing.” (An Apple spokesman declined to comment on Mr. Besenius’s observations.)

It galls Mr. Besenius that market regulators don’t measure the performance of Wall Street’s research recommendations, and he said he believed that they should require firms to disclose the track records of stocks their analysts recommend. “They’re not being held accountable” for bad recommendations, he maintained. “Little firms like ours have to be better than the big firms. We have to prove we can add value. Otherwise, we wouldn’t have an existence.”

Apple is only one prominent example of egg on analysts’ faces, and bullish Wall Street analysts were right for years — until they were wrong. Even today, analysts remain overwhelmingly positive about Apple. This week, 44 analysts rated it a strong buy or buy, although 10 now rate it a hold, according to Thomson Reuters.

Should anyone listen?

Many brokers still rely on their analysts’ research, and offer the analysts’ reports to clients for guidance in picking stocks to buy and sell. But the Securities and Exchange Commission takes a skeptical approach. Despite the reforms it helped put in place, it warns on its Web site of continuing conflicts of interest and says flatly, “As a general matter, investors should not rely solely on an analyst’s recommendation when deciding whether to buy, hold, or sell a stock.” It notes that many brokers aren’t allowed to contradict recommendations from their own research departments.

Professor Gilson of Harvard said: “Analysts are like movie critics. Some are good and some are bad. I find some of them extraordinarily useful. I advise my students to look to them, but you have to read their recommendations smartly with a very critical eye.”

Professor Greenwald was more dismissive. “I never pay attention to them, “ he said. “When a dog barks, if the dog barks all the time, you stop paying

Video Lecture Course on Security Analysis and The Intelligent Investor

Blogger

http://www.buffettsbooks.com/value-investing-introduction.html

This course may be a good review for beginners, but I also will enjoy viewing these when I have time to breathe. Let me know if you find these lessons of value.

Introductory Lessons to Value Investing

Course 1 Lesson Plan

In this Course, you’ll learn these three course objectives:

  • Unit 1 – Intro to Value Investing – Stocks
  • Unit 2 – Intro to Value Investing – Bonds
  • Unit 3 – Intro to Value Investing – Mr. Market

Intermediate Lessons to become an Intelligent Investor

             Course 2 Lesson Plan

Course 2 Lesson Plan

In this Course, you’ll learn these five course objectives:

Unit 1 – How Intelligent Investors manage risk

Unit 2 – How Intelligent Investors pick bonds

Unit 3 – How Intelligent Investors pick stocks

Unit 4 – How Intelligent Investors pick preferred shares

Unit 5 – How Intelligent Investors pick manage cash flow

Advanced Lessons to Security Analysis

Course 3 Lesson Plan

In this Course, you’ll learn these five course objectives:

Unit 1 – When does Warren Buffett Sell

Unit 2 – Understanding the importance of Return on Equity

Unit 3 – Understanding the importance of Volume

Unit 4 – How to calculate and find financial terms

Unit 5 – How to use stock screeners

Unit 6 – What is Goodwill

Unit 7 – What is Owner’s Earnings


ValueUncovered Philosophy; Treat Everything as a Case Study

Invesment-Strategy-Blog11

Treat Everything as a Case Study (Thanks to a reader)

I was driving past a Volkswagen dealer during a 15-hour drive from Miami to New Orleans when my 9- and 10-year-old kids excitedly pointed out the old Beetle that was parked alongside a row of brand-new models. Ah, yes, I said, a clear case of brand reinforcement through product differentiation: The odd thing stands out. At another point in the trip, their $8 headsets broke at the plug. We analyzed this as a case of defective design, probably the result of poor cost analysis.

The sight of gas pumps whose nozzles were covered with bags was a case of poor demand forecasting within the supply chain. Then we got talking about the odometer on my Nissan Pathfinder: Is a car that can go 300,000 miles a case of over-engineering or TQM excellence? It was a debate worth at least 40 miles.

It might be obvious by now that I had been playing HBR podcasts practically nonstop on that journey. If you listen to 50 consecutive business podcasts, as we did, everything starts to look like a business case study. Your way of seeing is transformed forever. You develop the Case Method third eye.

You start to question everything, and your questions start to disconcert people, just as Socrates’s questions upset the targets of his inquiries. But you must persevere. Questions help you connect the dots.

The security-company technician who was troubleshooting an alarm at my house discovered that the system wasn’t reliably transmitting to the local cell tower and needed to be replaced. I questioned him: Why wasn’t it connecting? The signal was too weak, he said. Then the zinger: Why did the company not measure the signal strength before installing the alarm in the first place?

A well-known furniture company with a nationwide network of showrooms said a chair I had ordered would take 12 weeks to arrive. Why so long, when it takes just four hours to build a car?

A colleague was setting up a PowerPoint presentation at work. Why PowerPoint? Why not Prezi or Keynote or SlideRocket or some other solution with potentially greater impact?

These questions hung in the air, unanswered, as do most of those I find myself asking during the course of a day, either to myself or whoever is with me: Why don’t all phone companies use the same frequency bands so business users can take their phones abroad? Why, with the advent of in-memory big data and high-frequency trading, can’t banks clear my personal stock trades instantly?

Often, the questions lead to debates. Just ask my kids: We debated everything (and still do). Is it better to amass frequent-flier miles or use them as you collect them, in case the carrier goes out of business? Is a supermarket’s “Buy one get one free” promotion a loss-leading marketing exercise or a tactic for achieving necessary volume? Can a product placement in a movie undermine brand credibility — eg, would James Bond really drink Heineken?

Ideally, the debates lead to imaginative problem solving.

Do this on your own for a while, or with your kids, and pretty soon you’ll sharpen up your questioning and debating and imagining skills. By adopting the “Everything is a case study” mindset and seeing the world through the Case Method third eye, you’ll learn to filter out the disinformation that life throws at you and uncover startling insights.

You’ll also increase your effectiveness at questioning your company’s strategies, processes, procedures, and methods of data collection. You’ll be able to grow in your ability to think about what you don’t know, rather than accepting the business-as-usual mentality.

This will help you assist your company in finding innovative solutions. And it might be good for your career. After all, CEOs hate canned, staid, boring, predictable answers to business problems (just as business professors hate canned, staid, boring, predictable responses to business cases). They crave creative, adaptive, innovative thinking.

Would the “Everything is a case study” view of the world have helped Eastman Kodak executives think through digital technologies earlier? Would it have prevented leaders in the British motorcycle industry from ignoring the commuter-moped market in the 1970s? Would it have stopped Xerox managers from showing off the company’s innovative technologies to the world before commercializing them?

Maybe. It certainly would have made their family car trips a lot more fun.


Original Article: http://feeds.harvardbusiness.org/~r/harvardbusiness/~3/w95-3LZKmRE/treat_everything_as_a_case_study.html

Review of MCX and Past Case Study (IRDM); Arguing Clinic

Does the tooth fairy pay for capex–Warren Buffett

IRDM Maintenance Capital Expenditures Case Study

Time to check in on IRDM. Last post:http://wp.me/p2OaYY-zt

A hedge fund made a case for investing in IRDM’s growth, but we made the case that true capital expenditures were not being accounted for and thus true owner earnings were being overstated.  I repeat this case since the concept of true MCX is so important.  Look at the lost opportunity cost for this hedge fund.

A Thorough Discussion of MCX_Case Study and Capital Theory

IRDM Presentation and then Tilson on IRDM 4_11

Time to attend an argument Clinic

Moats and Floats (Buffett and Munger). Good blog on Moats

Thanks to readers for these contributions on Moats.

An excellent case study on how Buffett learned to love float from the Fundoo Professor: Floats and Moats_Munger and Buffett  Worth a study! And read more:http://fundooprofessor.wordpress.com/

An interesting blog: http://25iq.com/2012/12/06/charlie-munger-on-moats-first-of-the-four-essential-filters/

For easier reading: Blog on Moats

As you may realize, Buffett and Munger seek the stable or durable companies. Note where change is disruptive: http://www.businessinsider.com/mary-meeker-2012-internet-trends-year-end-update-2012-12#-48


Learning from Blogs

Suggestions?

I like www.greenbackd.com but new posts are few and far between.

http://brooklyninvestor.blogspot.com/

http://www.grahamanddoddsville.net/

www.marketfolly.com

www.valueinvestorsclub.com  I study the ones with high volume high recommendations–not to find ideas but to seek wisdom.

http://www.frankvoisin.com/    An entrepreneur with common sense as an investor.

http://covestreetcapital.com/Blog/?p=731 Reading material. Good for them for sharing.

Your suggestions don’t have to be of blogs that are active, just those that you think others can learn from.


Not Bullish–Individuals Have a Change of Heart

Sentiment Survey Past Results

http://www.aaii.com/sentimentsurvey

Change from last week:

Bullish: -9.7 Neutral: +0.8 Bearish: +8.9

Long-Term Average:Bullish: 39% Neutral: 31% Bearish: 30%
Reported Date Bullish Neutral Bearish
November 15: 28.82% 22.35% 48.82%
November 8: 38.50% 21.60% 39.91%
November 1: 35.74% 23.28% 40.98%
October 25: 29.25% 27.67% 43.08%
October 18: 28.66% 26.79% 44.55%
October 11: 30.58% 30.58% 38.85%
October 4: 33.86% 32.91% 33.23%
September 27: 36.10% 27.44% 36.46%
September 20: 37.50% 28.72% 33.78%
September 13: 36.46% 30.56% 32.99%
September 6: 33.06% 33.88% 33.06%
August 30: 34.72% 32.64% 32.64%
August 23: 41.96% 32.17% 25.87%
August 16: 36.84% 35.09% 28.07%
August 9: 36.47% 36.18% 27.35%
August 3: 30.45% 34.63% 34.93%
July 26: 28.12% 28.75% 43.13%
July 19: 22.19% 36.02% 41.79%
July 12: 30.23% 35.05% 34.73%
July 5: 32.64% 34.03% 33.33%
June 28: 28.67% 26.96% 44.37%
June 21: 32.89% 31.23% 35.88%

The sentiment survey measures the percentage of individual investors who are bullish, bearish, and neutral.

Perspective: The difference from bullish and bearish sentiment percentages is 20%. That figure has occurred only 7.8% of the time since 1987. The biggest bullish spread (62%) occurred on Jan. 6th, 2000 and on November 9th 2000 it was + 54%. The most bearish spread was -54% on October 19th, 1990 and -51% on March 5th, 2009.  So individual investors have soured on the market, but they are not at an extreme.


Readings and Batten Down the Hatches

Pzena   Commentary 3Q12 (1)

Regime Uncertainty: http://mises.org/daily/6245/Malinvestment-and-Regime-Uncertainty coupled with money growth http://scottgrannis.blogspot.com/2012/10/money-demand-continues-to-rise.html

Update from Stu Ostro, Senior Meteorologist, The Weather Channel

– With Sandy having already brought severe impacts to the Caribbean Islands and a portion of the Bahamas, and severe erosion to some beaches on the east coast of Florida, it is now poised to strike the northeast United States with a combination of track, size, structure and strength that is unprecedented in the known historical record there.

– Already, there are ominous signs: trees down in eastern North Carolina on Saturday, the first of countless that will be blown over or uprooted along the storm’s path; and coastal flooding in Florida, North Carolina and Virginia Saturday and Sunday, these impacts occurring despite the center of circulation being so far offshore, an indication of Sandy’s exceptional size and potency. Sustained tropical storm force winds were already measured at a buoy just offshore of New York City Sunday evening, 24 hours before the closest approach of the center.
– A meteorologically mind-boggling combination of ingredients is coming together: one of the largest expanses of tropical storm (gale) force winds on record with a tropical or subtropical cyclone in the Atlantic or for that matter anywhere else in the world; a track of the center making a sharp left turn in direction of movement toward New Jersey in a way that is unprecedented in the historical database, as it gets blocked from moving out to sea by a pattern that includes an exceptionally strong ridge of high pressure aloft near Greenland; a “warm-core” tropical cyclone embedded within a larger, nor’easter-like circulation; and moisture from the tropics and cold air from the Arctic combining to produce very heavy snow in interior high elevations. This is an extraordinary situation, and I am not prone to hyperbole.

– That gigantic size is a crucially important aspect of this storm. The massive breadth of its strong winds will produce a much wider scope of impacts than if it were a tiny system, and some of them will extend very far inland. A cyclone with the same maximum sustained velocities (borderline tropical storm / hurricane) but with a very small diameter of tropical storm / gale force winds would not present nearly the same level of threat or expected effects. Unfortunately, that’s not the case. This one’s size, threat, and expected impacts are immense.
– Those continue to be: very powerful, gusty winds with widespread tree damage and an extreme amount and duration of power outages; major coastal flooding from storm surge along with large battering waves on top of that and severe beach erosion; flooding from heavy rainfall; and heavy snow accumulations in the central Appalachians where a blizzard warning has been issued for some locations due to the combination of snow and wind. With strong winds blowing across the Great Lakes and pushing the water onshore, there are even lakeshore flood warnings in effect as far west as Chicago.

– Sandy is so large that there is even a tropical storm warning in effect in Bermuda, and the Bermuda Weather Service is forecasting wave heights outside the reef as high as 25′.

– There is a serious danger to mariners from a humongous area of high seas which in some areas will include waves of colossal height. Wave forecast models are predicting significant wave heights up to 50+ feet, and that is the average of the top 1/3, meaning that there will be individual waves that are even higher. A buoy between North Carolina and Bermuda measured significant wave heights of ~40′ Sunday evening. The Perfect Storm, originally known as the Halloween Storm because of the time of year when it occurred, peaking in 1991 on the same dates (October 28-30) as Sandy, became a part of popular culture because of the tragedy at sea. This one has some of the same meteorological characteristics and ingredients coming together, but in an even more extreme way, and slamming more directly onshore and then much farther inland and thus having a far greater scope and variety of impact.

Goodwill Hunting: Being in the Storm

http://youtu.be/HSfxl1KI6y8

Why I don’t work for the Government

http://youtu.be/UrOZllbNarw


The 15% (Growth) Delusion


Always make decisions based on what you have learned and act on the facts that you have gathered. Even if you turn out to be wrong, at least you can learn from your own mistakes.” Mark Mobius, Templeton Global Fund.

Previously I posted on the Petersburg Paradox of using high, perpetual growth rates in financial models like Discounted Cash Flow (DCF) here: http://wp.me/p2OaYY-1p6.

If next year’s owner earnings will be $1 per share or a total dividend payout of $1 with a cost of capital of 10% for the business, then we will theoretically pay $10 per share for the company. If the company will grow forever more at 5%, then we will pay $20 (10% cost of capital minus perpetual growth rate per year of 5%) divided into $1 = $20 per share. If the growth rate is 10% then we will pay “any” price. Of course, common sense should stop you right there.

Nevertheless, you often see high growth rates of 12% or 15% or more predicted by analysts. What are the probabilities of a company growing its earnings at 15% per year for decades? The article below discusses the snare of earnings management, but the article includes a study of how few (2%) of all major companies have grown their earnings at a 15% rate. This is another warning to be careful of forecasting or expecting rapid growth.

 The 15% Delusion

……That’s the problem for big companies: The growing gets hard, and we have two studies to prove it. The first was done a few years ago by Wharton School professor Jeremy Siegel for his book Stocks for the Long Run. Siegel’s primary purpose was to examine how the Nifty Fifty of 1972 would have treated investors who paid the sky-high prices then being asked for them and held on for 25 years–and the answer was “not badly.” But a secondary part of the study looked at the group’s annual growth rates in earnings per share. And only three companies out of the 50 beat 15%. They were Philip Morris, at 17.9%; McDonald’s, at 17.5%; and Merck, at 15.1%.

The second study is one FORTUNE, working with Value Line, did for this article. For three different periods–1960-80, 1970-90, and 1980-99–we examined earnings-per-share growth for 150 large companies. In our sample were the 150 publicly owned companies that (a) at the start of each period were the biggest in the FORTUNE 500 or were in the very top of the “Fifties” lists that we used to do for certain industries, such as commercial banks; and (b) were still independent beings at the end of the period being studied. The fact that we threw out any company that did not last the period (because it was acquired, perhaps, or subjected to a leveraged buyout) gives the results an upward, “survivorship” bias. Beyond that, we know retrospectively that there was no shortage of business opportunity in the years we studied: Though the companies looked big to the world as each period began, they still had plenty of room to grow.

And yet the number that managed to increase their earnings per share over the periods by 15% annually was very small, even when you include the companies that hit the mark because of an oddball situation. For example, Boeing beat 15% in two periods (1960-80 and 1970-90) because it moved from hard times in the base years to prosperity in the later years. Similarly, Fannie Mae had an extraordinary 32% growth rate for the 1980-99 years because it began the period in a near-bankrupt condition, brought on by sky-high interest rates, and later got rich.

Read more: http://money.cnn.com/magazines/fortune/fortune_archive/2001/02/05/296141/index.htm or for a PDF of the article: The 15 Percent Delusion by Carol Loomis

More articles to make you think about the investment requirements (and risks) to drive growth.

Fallacy of Growth_Goupon

Asset Growth can lead to lower stock returns_Research Darden School

Growth Illusion

Higgily Piggly Growth and Low PEs

For the next post we will read about what Graham has to say about growth investing.

Ben Graham, the Growth Stock Investor

Every investor would like to select the stocks of companies that will do better than the average over a period of year. A growth stock may be defined as one that has done this in the past and is expected to do so in the future.[1] Thus it seems only logical that the intelligent investor should concentrate upon the selection of growth stocks. Actually the matter is more complicated, as we shall try to show.

It is a mere statistical chore to identify companies that have “outperformed the averages” in the past. The investor can obtain a list of 50 or 100 such enterprises from his broker. Why, then, should he not merely pick out the 15 or 20 most likely looking issues of this group and lo! He has a guaranteed-successful stock portfolio?

There are two catches to this simple idea. The first is that common stocks with good records and apparently good prospect sell at correspondingly high prices. The investor may be right in his judgment of their prospects and still not fare particularly well merely because he has paid in full and perhaps overpaid for the expected prosperity. The second is that his judgment as to the future may prove wrong. Unusually rapid growth cannot keep up forever; when a company has already registered a brilliant expansion, its very increase in size makes a repetition of its achievement more difficult. At some point the growth curve flattens out, and in many cases it turns downward.

…to be continued


[1] A company with an ordinary record cannot , without confusing the term, be called a growth company or a “growth stock” merely because its proponent expects it to do better than the average in the future. It is just a “promising company.” Graham is making a subtle but important point: If the definition of a growth stock is a company that will thrive in the future, then that is not a definition at all, but wishful thinking. It is like calling a sports team “the champions” before the results are in.  This wishful thinking persists today, among mutual funds, “growth: portfolios describe their holdings as companies with ‘above-average growth potential” or “favorable prospects for earnings growth.” A better definition might be companies whose net earnings per share have increased by an annual average of at least 15% for at least five years running. (Meeting this definition in does not ensure that a company will meet it in the future.)


What is Wrong with Austrian Economics? 1873 and 2008; The Future in Glass; See’s Candies Case Study

“If a man has a talent and cannot use it, he has failed. If he has a talent and uses only half of it, he has partly failed. If he has a talent and learns somehow to use the whole of it, he has gloriously succeeded, and won a satisfaction and a triumph few men ever know.” — Thomas Wolfe

“Work is love made visible. And if you cannot work with love but only with distaste, it is better that you should leave your work and sit at the gate of the temple and take alms of those who work with joy.” –Kahlil Gibran

SUGAR: last mentioned http://wp.me/p1PgpH-1dr. Have a jelly donut:http://youtu.be/OhhJwJbYruA

The Future?

A day made of glass: Part 1: http://youtu.be/6Cf7IL_eZ38 Part 2: http://youtu.be/jZkHpNnXLB0

See’s Candies last discussed here: http://wp.me/p1PgpH-1bZ.

Readers did a fine job of analyzing why Buffett paid 3xs tangible book value. While cleaning out old files I came across a discussion of See’s that perhaps not many have seen, so I will post tomorrow.

What is Wrong with the Austrians?

Before you can know what is “wrong” with Austrian Business Cycle Theory (“ABCT”), you need to know about the theory.

A ten lecture series on Austrian Economic Analysis: http://mises.org/media/categories/89/Introduction-to-Austrian-Economic-Analysis

The Austrian School: http://en.wikipedia.org/wiki/Austrian_School

As a history fanatic, I am enjoying A Nation of Deadbeats: An Uncommon History of America’s Financial Disasters by Scott Reynolds Nelson. 

More on the author here:http://www.wm.edu/research/ideation/social-sciences/economic-deja-vu6543.php

The book’s author has studied the Austrian approach but finds fault with it. He weaves an interesting account of the Panics of 1792, 1819, 1837, 1857, 1873, 1907, 1920 and 1929. He says government can’t be entirely to blame for some of the overleveraging, fraud and mal-investment of the booms that lead to busts.  I lack historical knowledge to completely grasp his arguments, but after finishing this book I will take another crack.  I do believe that understanding where leverage has built up is crucial to understanding the effects of the bust. For example, the Internet boom occurred mostly in equities while the 2008 credit crisis developed in the banking system. Banking panics will most likely be much more severe due to the high (at least 10 to 1) leverage in our banking system. The credit contraction is quick to spread throughout the economy. The Internet bust primarily caused a bust in Internet and Telcom companies’ stock prices.

The Panic of 1873 as a model to understand 2008

The best model to understand the 2008 Crisis was the 1873 panic NOT 1929.

The author: “Everyone was talking about 1929, but I said in this article that the depression following the Panic of 1873 was much more like our current crash than 1929,” Nelson said. “1873 was a mortgage meltdown, then bank failure, which then led to stock market collapse.”

http://srnels.people.wm.edu/articles/realGrtDepr.html

Scott Nelson 1873 and 2008 and below are original source documents from the period. NYT on Panic of 1873, 

Workers Riot in NYC 1874

Speculation Rampant in RR in 1873

Problems with Austrian Business Cycle Theory

Another historian’s view: Jeffrey Hummel Arguments against ABCT

I will seek out the contra-arguments to Austrian theory as a way to better understand the strengths and weaknesses of various economic theories and approaches. Is Austrian theory perfect? I don’t believe so, but it has been the best construct for me to understand how booms develop and end–so far.  What do YOU think?

Business cycle theory

According to most mainstream economists, the Austrian business cycle theory is incorrect.[33]

Some mainstream economists argue that the Austrian business cycle theory requires bankers and investors to exhibit a kind of irrationality, because their theory requires bankers to be regularly fooled into making unprofitable investments by temporarily low interest rates.[5][24][117] In response, historian Thomas Woods argues that few bankers and investors are familiar enough with the Austrian business cycle theory to consistently make sound investment decisions. Austrian economists Anthony Carilli and Gregory Dempster argue that a banker or firm loses market share if it does not borrow or loan at a magnitude consistent with current interest rates, regardless of whether rates are below their natural levels. Thus businesses are forced to operate as though rates were set appropriately, because the consequence of a single entity deviating would be a loss of business.[95] Austrian economist Robert Murphy argues that it is difficult for bankers and investors to make sound business choices because they cannot know what the interest rate would be if it were set by the market.[97] Austrian economist Sean Rosenthal argues that widespread knowledge of the Austrian business cycle theory increases the amount of malinvestment during periods of artificially low interest rates.[118]

Economist Paul Krugman has argued that the theory cannot explain changes in unemployment over the business cycle. Austrian business cycle theory postulates that business cycles are caused by the misallocation of resources from consumption to investment during “booms”, and out of investment during “busts”. Krugman argues that because total spending is equal to total income in an economy, the theory implies that the reallocation of resources during “busts” would increase employment in consumption industries, whereas in reality, spending declines in all sectors of an economy during recessions. He also argues that according to the theory the initial “booms” would also cause resource reallocation, which implies an increase in unemployment during booms as well.[28] In response, Austrian economist David Gordon argues that Krugman’s argument is dependent on a misrepresentation of the theory. He furthermore argues that prices on consumption goods may go up as a result of the investment bust, which could mean that the amount spent on consumption could increase even though the quantity of goods consumed has not.[119] Furthermore, Roger Garrison argues that a false boom caused by artificially low interest rates would cause a boom in consumption goods as well as investment goods (with a decrease in “middle goods”) thus explaining the jump in unemployment at the end of a boom.[120] Many Austrians also argue that capital allocated to investment goods cannot be quickly augmented to create consumption goods.[121]

Economist Jeffery Hummel is critical of Hayek’s explanation of labor asymmetry in booms and busts. He argues that Hayek makes peculiar assumptions about demand curves for labor in his explanation of how a decrease in investment spending creates unemployment. He also argues that the labor asymmetry can be explained in terms of a change in real wages, but this explanation fails to explain the business cycle in terms of resource allocation.[122]

Hummel also argues that the Austrian explanation of the business cycle fails on empirical grounds. In particular, he notes that investment spending remained positive in all recessions where there are data, except for the Great Depression. He argues that this casts doubt on the notion that recessions are caused by a reallocation of resources from industrial production to consumption, since he argues that the Austrian business cycle theory implies that net investment should be below zero during recessions.[122] In response, Austrian economist Walter Block argues that the misallocation during booms does not preclude the possibility of demand increasing overall.[123]

Critics have also argued that, as the Austrian business cycle theory points to the actions of fractional-reserve banks and central banks to explain the business cycles, it fails to explain the severity of business cycles before the establishment of the Federal Reserve in 1913.[33] Supporters of the Austrian business cycle theory respond that the theory applies to the expansion of the money supply, not necessarily an expansion done by a central bank.[124] Historian Thomas Woods argues that the crashes were caused by various privately-owned banks with state charters that issued paper money, supposedly convertible to gold, in amounts greatly exceeding their gold reserves.[125]

In 1969, economist Milton Friedman, after examining the history of business cycles in the U.S., concluded that “The Hayek-Mises explanation of the business cycle is contradicted by the evidence. It is, I believe, false.”[26] He analyzed the issue using newer data in 1993, and again reached the same conclusion.[27] Austrian economist Jesus Huerta de Soto argued that Friedman’s conclusions are based on misleading data (such as GDP).[124] Austrian economist Roger Garrison argued that Friedman misinterpreted economic aggregates and how they related to the business cycles he reviewed.[126]

END