The above post is an excellent tutorial and case study on riding a volatile, cyclical bull market in Uranium Company, Cameco (and others) from 2000 when CCJ traded about $7 to $8 until mid-2007 or about $40 to $45 (you never get the exact high). That is about a 27% compounded return over seven years. Buying near the low and selling near the high–isn’t that a fantasy. Not if you were following the fundamentals and the sentiment. The hardest part is holding on until it is clearly time to sell.
The article was written by https://www.uraniuminsider.com/ who did a great job on this article. I don’t know him or his newsletter, but I collated his articles in a case study below. I highly recommend you study the case below even if you avoid investing in cyclical, commodity companies.
The case also gives you a condensed application of the capital cycle.
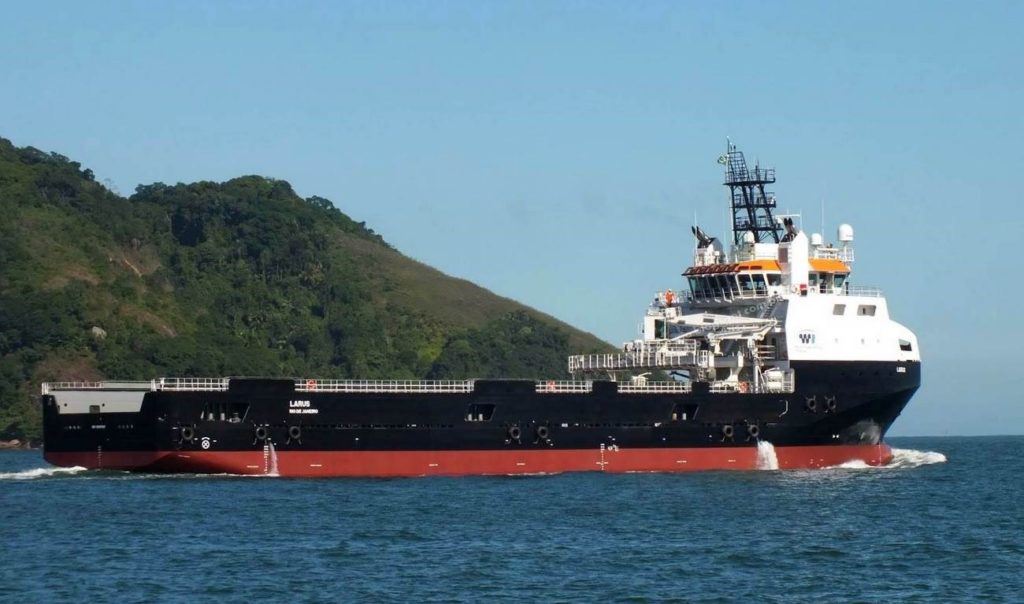
Below is a case study of the capital cycle using Tidewater as an example. This page will be updated over time. This is not an investment recommendation but an ongoing case study.
Since Tidewater has been in business since 1955, its service is needed, but this is–at best–no more than an average business with no long-term competitive advantage. Currently, there is a trade-off between a decline in intrinsic value as time progresses without economic charter rates versus Tidewater’s competitive advantage over financially distressed competitors.
Update: 4/17/20
Tidewater filed to protect its $300 million in NOLs and $388 million in foreign tax credits. As an investor, you know that the NOLs can be worth more than $0 to worth a whole lot.
Meanwhile, Hornbeck (HOSS), a competitor filed for bankruptcy.
Update: 4/21/2020 US Crude oil near-term futures trade at a negative price for the first time in history. Natural gas is rising in price as shut-in oil wells reduce natural gas supply. What we are witnessing is a massive destruction of capital and productive capacity thanks to covid-19 and negative global interest rates. The future might require far higher oil prices. Near-term one would expect more pressure on TDW’s price because of the fear in hydrocarbon markets.
Update: 4/22/2020 TDW does not seem to be declining with oil prices–a divergence that may be signaling some change–perhaps investors are looking out at the supply destruction in oil.
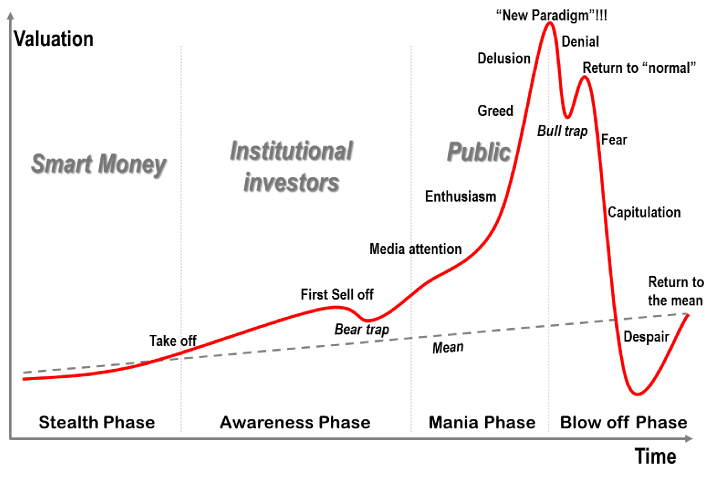
4/25/20: Siem Management in their 2019 Shareholder letter move from hopeful to despair. (A good sign for Tidewater). These are dark days for the OSV industry and what you typically hear about in the depths of a downcycle.
The Siem Offshore is exposed to a number of risks. One of the most important risk factors is the demand for its services. The OSV market is now in its 7th year of depressed conditions and it has taken longer to recover than earlier expected. It is highly uncertain as to when charter rates will offer sufficient earnings for full debt servicing. The Company has been able to reduce its debt substantially over the last five years. Principal payment of debt instalments in 2019 was USD99 million (2018: 195 million). The significant debt reduction has been possible due to good cooperation between the Company and its financing banks, significant shareholder support, good ship operations and disposal of non-strategic and older assets. However, the significant excess capacity in the worldwide offshore service vessel fleet has increased the competition amongst owners for any vessel requirements, thereby depressing charter rates. The imbalance of supply and demand for offshore vessels is expected to remain for some years and will continue to put pressure on the charter rates and our cash flows. Five vessels were in lay-up at year-end 2019.
4/22/2020 OUTLOOK from Siem Offshore’s Annual Report. Despair!
The collapse in the oil price and the effect of the COVID-19 on the world’s economies have created a very different operating environment for our fleet. Field developments offshore are being cancelled or postponed by our clients and there will be much less work offshore during the coming several years. The demand for our services will therefore reduce rather than increase. At the end of last year, we looked forward to a gradual recovery in offshore activities and the nearing of balance in supply and demand in the OSV sector. That hope is now gone and we brace ourselves for a downturn probably worse than we have experienced during the past few years.
The actions required to achieve the best possible outcome when confronted with the market difficulties include consolidations between and among debt-burdened owners, such as practically all OSV owners in Norway. This is the time when owners should work together to embrace the opportunities to survive until the end of a long, dark tunnel of slow activity in the market for all of our vessels. Only by working together can the right scheduling and layup of vessels be achieved. The cost saving would be an added benefit. Most of our lending banks are lenders to several if not all of the competing OSV owners and are in the position to influence this required development. Disappointedly, the banks do not appear willing or prepared to assume this vital role.
The financial problems are currently solved independently within each company giving the owners more time to compete fiercely with each other, all to the benefit of the clients. Owners are seen to take higher risks as the clients take advantage of the desperate situations to shift operating risks from the clients to the OSV owners. The latter accepts the risks because they have nothing more to lose. Ironically, it is the banks who are exposed to the contractual downside in this new reality. This has created an artificial, unhealthy and unsustainable competitive situation in our industry.
May 17, 2020 Update. Tidewater currently trades at $4.13 or about 24% below its scrap liquidation value if we take Hornbeck’s bankruptcy filing as a guide.
Tidewater had 157 vessels operating at the end of the year. It took 4 of its active fleet to sell. So let’s take 150 vessels times $2 million per vessel (See last page on Hornbeck Bankruptcy filing below) for 300 million sales/scrap value then minus $85 million net debt for $215 liquidation value divided by 42 million shares or $5.11 per share. At $4.13, TDW trades 24% below this value.
I realize that the next twelve to eighteen months will be extremely difficult for TDW as it races to scrap excess vessels and conserve cash, but I don’t think it is a certainty that TDW will have to restructure it debt or declare bankruptcy again, but the market is pricing for extreme events ALREADY. The issue is whether to add on weakness.
The biggest risk is if financiers continue to throw good money after bad in this OSV industry. We shall see.
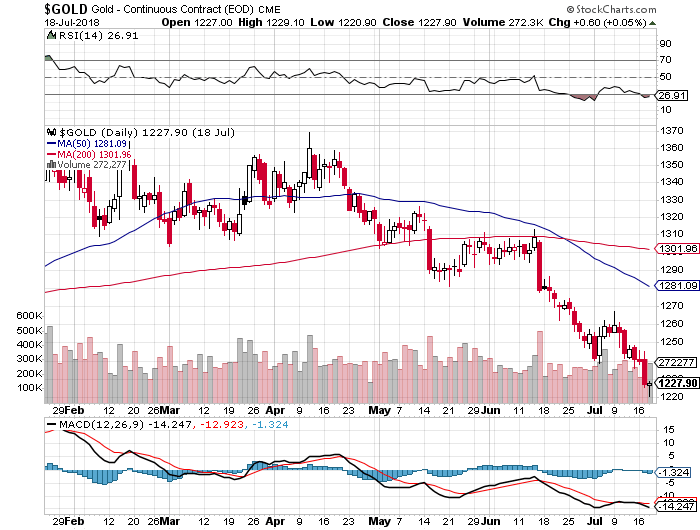
On April 11, 2018, the price of gold in US Dollars was $1,370. This morning on July 19th, the price was $1,2110.90 for a decline of $159 in 99 days. If current trends continue, then in 712 days or less than two years, the Gold price in USD terms will be about $0.00. The trend is your friend!
The single greatest mistake investors make is to extrapolate recent history out into the future. They take the financial returns of the past 5 days or 5 years or even 50 years and assume the next few days or years will look just the same without any consideration for the historical context or conditions that provided for those returns.
They forget that, while ‘history may rhyme, it doesn’t repeat itself’ (Twain). Or that, “the only thing that is constant is change” (Heraclitus). These two famous quotes apply to the financial markets as much as anything.
Ignoring these truths and instead simply extrapolating is why investors are suckered into pouring money into the stock market only after a run of great performance. They believe that the recent gains are about to repeat to their great benefit when they should be thinking about what conditions allowed for those gains to take place and analyzing whether they are still relevant or not.
This is also why they are suckered into selling only after a painful decline as they did at the lows made during the financial crisis. They believe that they are about to suffer another 50% decline on top of the one they just endured when they should really be reminding themselves that change is the only guarantee in life.
I believe this is one of the biggest problems with so-called “passive” investing. It is built upon the faulty premise that it is ‘impossible to forecast’ the future returns of any asset class over any period of time so we should just own all of them all the time. My response to this is that while ‘ignorance may be bliss’ it’s not a valid investment strategy.
In his 1992 letter to Berkshire Hathaway shareholders, Warren Buffett wrote:
We’ve long felt that the only value of stock forecasters is to make fortune tellers look good. Even now, Charlie and I continue to believe that short-term market forecasts are poison and should be kept locked up in a safe place, away from children and also from grown-ups who behave in the market like children. However, it is clear that stocks cannot forever overperform their underlying businesses, as they have so dramatically done for some time, and that fact makes us quite confident of our forecast that the rewards from investing in stocks over the next decade will be significantly smaller than they were in the last.
Much can be learned from this short passage. First, short-term stock market forecasts are, indeed, nearly worthless – essentially a guessing game. Second, long-term forecasts, on the other hand, can be made with ‘confidence.’ “How?” you ask.
It’s actually very simple. Rather than fixate on recent history and extrapolate it into the future you must abandon this natural tendency. And as I said earlier you also need to analyze the conditions that allowed for those returns to see whether they are still relevant to today’s market.
In Buffett’s example he’s referring to the wonderful returns equity investors experienced from 1982-1992. During that span investors roughly quadrupled their money. Over the coming decade they merely doubled their money so Buffett was right that the decade beginning in 1993 would fall far short of the return of the prior decade even if they were still very good.
sc-22
But Buffett made another prescient forecast in November 1999 when he wrote:
Today, staring fixedly back at the road they just traveled, most investors have rosy expectations. A Paine Webber and Gallup Organization survey released in July shows that the least experienced investors–those who have invested for less than five years–expect annual returns over the next ten years of 22.6%. Even those who have invested for more than 20 years are expecting 12.9%. Now, I’d like to argue that we can’t come even remotely close to that 12.9%… you need to remember that future returns are always affected by current valuations and give some thought to what you’re getting for your money in the stock market right now.
You probably already know that stock market returns from 1999 to 2009 were not very kind to investors.
And Buffett tells us how he was so confident that this would be the case. He examined the conditions that allowed for returns to be so wonderful from 1982-1999 but were no longer present in 1999: wonderful valuations. Stocks were so cheap in 1982 that the coming decade was virtually guaranteed to be better than the decade that preceded it. (1972-1982 was another decade that was not fun for investors.) Then in 1999 valuations were so expensive that there was almost no possibility of decent returns going forward.
So let’s take a look at Buffett’s favorite valuation yardstick which he refers to on both of those prior writings. It tracks the total value of the stock market in relation to Gross National Product.
From the chart, it’s plain to see that valuations were extremely attractive back in the early 1980’s. This is why stocks performed so well over the next 20 years. However, I find it absolutely fascinating that stock market valuations today are essentially equivalent to valuations in November 1999 when he wrote that latter passage. Yeah, go back and read that last line again. It’s a doozy and it’s absolutely fact.
This is also why the past 5 years or even the past 50 years are totally irrelevant to equity investors in today’s market. There is almost zero possibility today of achieving a return anywhere close to what those historical returns represent. So shun forecasts if you want. Plead ignorance if it makes you feel blissful. But at today’s valuations you should at least be aware of the fact that it’s exceedingly dangerous to fall into the trap of extrapolating without analyzing.
What The Buy-And-Hold Cult Doesn’t Want You To Know
Buy-and-hold, and all of its related strategies like BTFD, garnered a cult following a long time ago and it’s only gotten even more popular in recent years. (There may be no better evidence of this than the StockTwits merch store – which I love, btw). And after one of the longest and strongest equity bull markets in history this should not come as any surprise. Investors are always influenced by recency bias and prone to extrapolation.
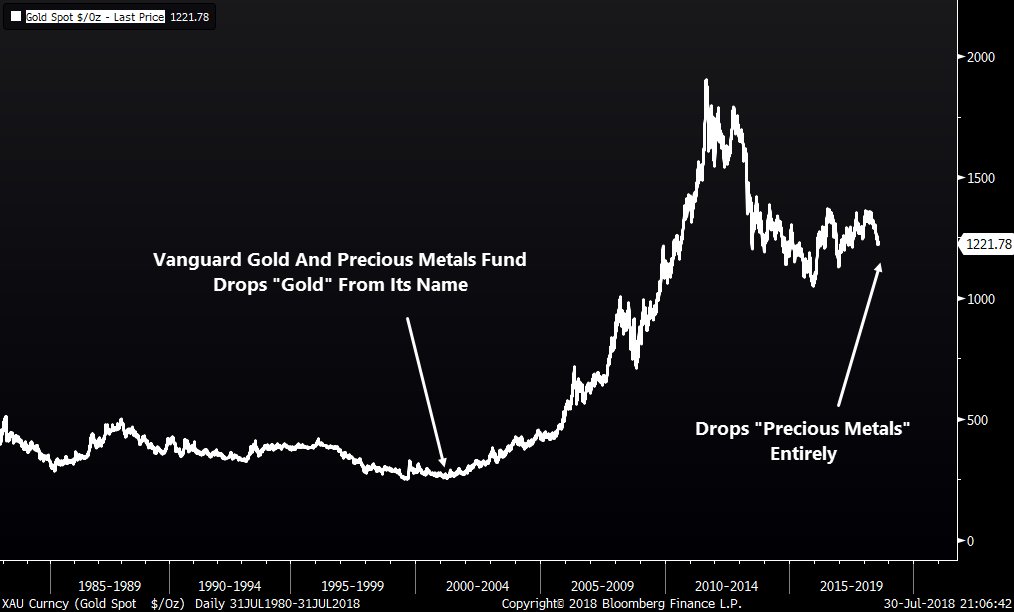
What is surprising, however, is that, despite that fact that it’s long-term (20-year) performance still crushes that of the broad stock market, gold has become so maligned among investors of all stripes, including gold bugs themselves. Yes, the past few years have favored equities over precious metals and I guess that’s where the recency bias kicks in again. But the truth is it has paid far better to be gold bug over the past two decades than to be an equity bull.
The point being to understand your time preference and time reference!
Update:
fred hickey @htsfhickey 20/July 2018 5 PM
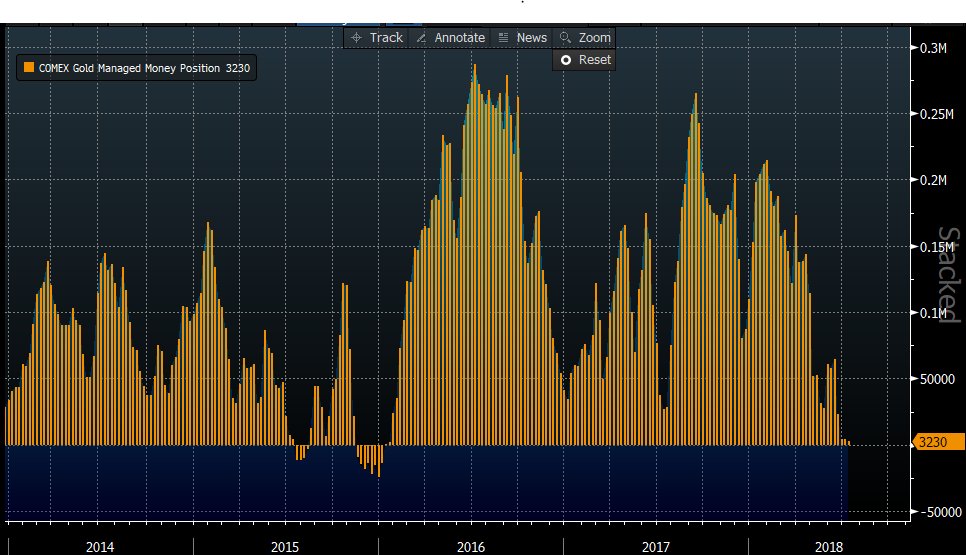
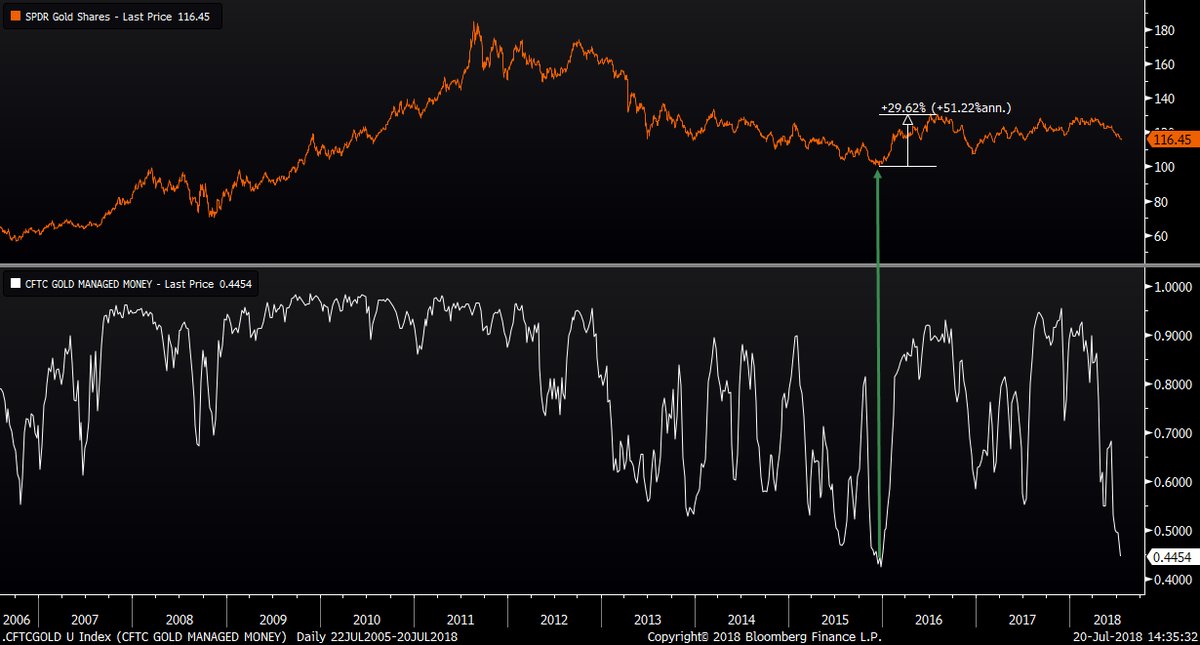
Here’s Managed Money(mostly hedge funds) COT details: 134.2K short, 11% higher than highest level (gold’s bottom) seen in 2015, so likely a record.. Net short -26.5k contracts-essentially equal to Dec. 2015 gold bottom. For comparison, at gold’s mid-2016 top they were net 270K long ago
The setup: Gold bugs totally demoralized. Gold sentiment(DSI)down to just 7% with extreme dollar bullishness(92% DSI). Trump beginning to talk $ down (will continue). FY ’19 $1T+ budget deficit. Gold seasonal demand (starts now). Managed Money (hedge funds) net short& have to cover.
It’s likely these are record level shorts. That means there are more shorts than at the bottom in late-2015 – before gold exploded 30% & miners +160% in 6 months and more shorts than at late-2008 bottom before gold soared over 75% in 1 year. Perfect setup-assuming gold’s bottomed.
Whoa Nelly! Just as I suspected it was short traders driving gold down. Thru Tuesday (likely even worse now), a slight increase in longs& another massive 27.7K jump in large spec. futures shorts. In past 5 weeks +121% jump in short contracts to 161K -highest level in at least 11yrs.
BUT, ALWAYS STUDY THE OTHER SIDE–GOLD TO KEEP FALLING.
Up close and personal interview with Kevin Clayton, CEO of Clayton Homes, the largest factory built homebuilder in the United States and a wholly owned subsidiary of Warren Buffett’s Berkshire Hathaway. For nearly one hour, author Robert Miles interviews Kevin Clayton and covers all aspects of the business from getting started, to taking over from his father, and to selling to Warren Buffett.
This video may help the viewer understand the qualitative aspects that Warren Buffett may consider when making an investment. This interview may also showcase one of the eventual successors to Warren Buffett.
Better yet, view Ken Langone’s interview below: All his investment successes came from investing in good people