Tag Archives: Vale

Contrarian Investing (Part II)

swimming-against-tide-one-man-figure-walking-contrary-to-group-crowd-walking-wooden-figures-people-d-rendering-white-35054169

“Bull markets are born on pessimism,” he declared, they“grow on skepticism, mature on optimism, and die on euphoria.” –John Templeton

John Templeton paid attention to the emotion of the stock market. The first half of his philosophy was “The time of maximum pessimism is the best time to buy.” When everyone else was selling, he bought low during the Depression and in 1939 at the onset of World War II . . . and he made millions.

The second half of his philosophy was “the time of maximum optimism is the best time to sell.” He sold high during the Dot.com boom when everyone else was still buying. Founded in the 1950s, his Templeton Growth Fund averaged 13.8% annual returns between 1954 and 2004, consistently beating the S&P 500.

I think there are a few ways to make many times (10x to 100x +) your money over a long period of time.   The first would be to own emerging growth companies that have owner-operators who are both excellent operators and capital allocators who grow the company profitably at a high rate over decades.   The business generates high returns on capital while being able to deploy capital into further growth. Think of owning Wal-Mart in the early 1970s or Amazon after its IPO or 2001.   There will be a post on 100 to 1 baggers soon. I prefer this approach.

Wal-Mart 50 Year Chart_SRC

The second way would be to buy distressed assets and then improve those assets or create efficiencies by creating economies of scale. Carlos Slim, Mexican Billionaire, would be an example of this type of investor. Think activist investing. Note that Carlos Slim has operated at times as a monopolist in a government protected market.  Most of us do not have his options.

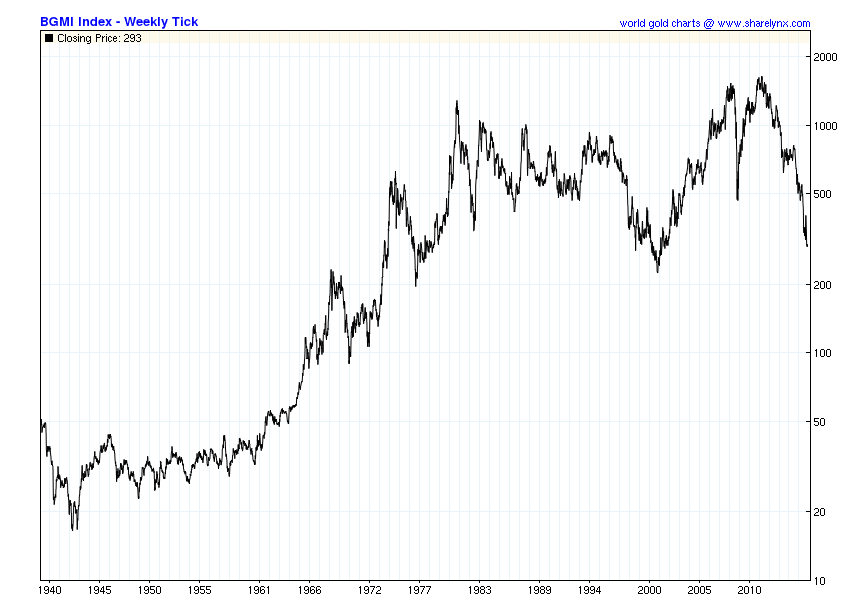
The third way would be to buy deeply-distressed, out of favor, cyclical assets and then resell upon the top of the next cycle. Gold mining is a difficult, boom/bust business, for example–see Barrons Gold Mining Index below. All businesses are somewhat cyclical, but commodity producers are hugely cyclical with long multi-year cycles due to the nature of mining-it takes years and high expense to reopen a mine and even if I gave you $2 billion and several years, you and your expert team may not be able to find an economic deposit. Note the five-to-ten year cycles below.

gold mining bgmi

We are focusing on the third way, but in no way do I suggest that this is for you. You need to be your own judge.  There is a big catch in this approach, you need to choose quality assets and/or companies with managements that do not over-leverage their firms during good times or overpay for acquisitions during the booms (or you could choose leveraged firms but be aware of the added risk and size accordingly becasue when a turn occurs, the leveraged firms rise the most). You also need to seek out a period of MAXIMUM pessimism which is difficult to do. How do you know that the market has FULLY discounted the bad news?  Finally, YOU must be prepared to invest with a five-to-ten year horizon while expecting declines of over 50%. That concept alone will make you unique.   Probably most will turn away from such requirements.

We pick up from http://csinvesting.org/2015/12/14/contrarian-dream-or-nightmare/.  Before we delve into the technical aspects of valuing cyclical companies, think about what it FEELS like to have the CONVICTION.  Here is an example:

We last studied Dave Iben, a global contrarian investor, in this post: http://csinvesting.org/tag/david-iben/.   You should read, Its Still Rock and Roll To Me at http://kopernikglobal.com/content/news-views and listen to the last few conference calls at the right side of the web-page.   Note Mr. Iben’s philosophy, approach, and Holdings. His portfolio is vastly different than most money managers or indexers. But being an contrarian takes fortitude and patience. Kopernik Global performance since inception:

koper spy

Next preview the readings below.

First you need to understand Austrian Business Cycle Theory to grasp how massive mal-investment occurs. Why does China have newly built ghost cities? Distortion of interest rates causes mal-investment (the boom) then the inevitable correction because the boom was not financed out of real savings.

Why is the bust so severe for mining/commodity producers?   Read Skousen’s book on the structure of production.  Think of a swing fifty feet off the ground and 200 feet long.   If you are sitting near the center of the swing’s fulcrum (nearest the consumer), then the ups and downs are much less than being on the end of the swing furthest from the consumer (the miners and commodity producers).

4 files were sent to you.
Read Ch. 19 Security Analysis.pdf
Boom/Bust Austrian business cycle theory.pdf
Damodaran Valuing Cyclical Commodity Companies.pdf
Must Read Structure-production.pdf

Sorry: here is the Hooke book (chapter 19 on resource companies)

Hightail
File Icon Business Valuation Methods – Jeffrey C. Hooke.pdf Download
Your file will expire on February 25, 2016

Even if you are an expert in valuation, investing in a cyclical company can be lethal: Vale: Go Where it is darkest (Damodaran)

ValeBig Vale

Then Throwing in the towel on Vale. I am not picking on Prof. Damordaran because we all make mistakes, and he graciously has provided a case study for us.  Study the posts and the comments.

Can you think of several research errors he made (BEFORE) he invested?

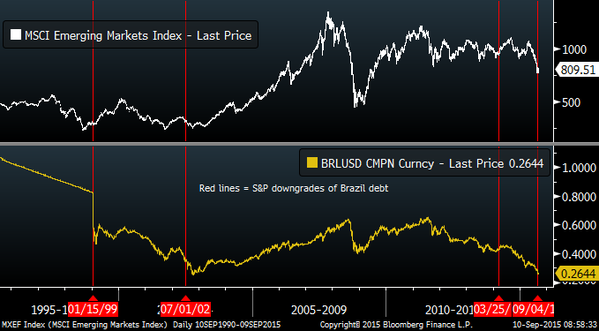
Remember in the prior post, the long-term chart of the CRB index showing commodities at 41-year lows since the CRB Index is below 175 or back to 1975 prices?  Then why, if gold is a commodity,  doesn’t gold trade at $200 or at least down to $500 to $700 as the gold chart from that time shows?monthly_dollar

Why, if gold is money, doesn’t gold trade in US Dollars at $15,000 or the estimated price to back US Dollars by 100% in gold?  You can change the amount to $10,000 or $20,000, but you get the idea.gold monetary base


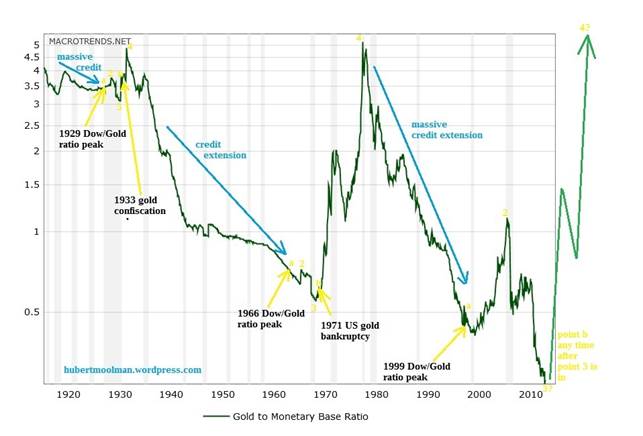
Gold during the boom of 1980 rel. to Financial Assets in 1980 the price of gold at $800 per ounce allowed for the US gold holdings to back each US dollar then outstanding.

Try thinking through those questions.  Can we use what we learned from gold to value oil?

I will continue with Part III once readers have had several days to digest the readings and at least three readers try to answer at least one question.  Until then……………………….be a contrarian not contrary.

Update on 21/Dec. 2015 http://fortune.com/2015/12/21/oil-prices-low/

BEING WRONG (VALE)

Brazil EM

Friday, September 25, 2015

No Mas, No Mas! The Vale Chronicles (Continued)!

Some of my Brazilian readers seem to be upset that I used “No Mas”, Spanish words, rather than Portuguese ones, in the title. To be honest I was not thinking about language, but instead about a boxing match from decades ago, where Roberto Duran used these words to give up in his bout with Sugar Ray Leonard.

I have used Vale as an illustrative example in my applied corporate finance book, and as a global mining company, with Brazilian roots, it allows me to talk about how financial decisions (on where to invest, how much to borrow and how dividend payout) are affected by the ups and downs of the commodity business and the government’s presence as the governance table. In November 2014, I used it as one of two companies (Lukoil was the other one) that were trapped in a risk trifecta, with commodity, currency and country risk all spiraling out of control. In that post, I made a judgment that Vale looked significantly under valued and followed through on that judgment by buying its shares at $8.53/share. I revisited the company in April 2015, with the stock down to $6.15, revalued it, and concluded that while the value had dropped, it looked under valued at its prevailing price. The months since that post have not been good ones for the investment, either, and with the stock down to about $5.05, I think it is time to reassess the company again.

vale

John Chew: At least the author has a process to reassess his investment.  I believe the critical flaw in his analysis (easy to say in hindsight) was not noting the massive mal-investment due to distorted credit markets caused by central bank policies. To normalize iron ore prices you would need pre-distortion prices going back twenty-five years.

Read more: No Mas!

R-T-M, Gross Profitability, Magic Formula

Our last lesson was in Mean Reversion (Chapter 5 in Deep Value) discussed http://wp.me/p2OaYY-2Ju  View this video on a very MEAN Reversion.

We must understand full cycles and reversion to the mean.  Let’s move on to reading Chapter 2: A Blueprint to a better Quantitative Value Strategy in Quantitative Value.

Investors should be skeptical of history-based models. Constructed by a nerdy-sounding priesthood using esoteric terms such as beta, gamma, sigma and the like, these models tend to look impressive. Too often, though, investors forget to examine the assumptions behind the symbols. Our advice: Beware of geeks bearing formulas. -Warren Buffett, Shareholder Letter, 2000.

A WONDERFUL BUSINESS

Greenblatt defined Buffett’s definition of a good business as a high Return on Capital (ROC) – EBIT/Capital

Capital is defined as fixed asses + working capital (current assets minus current liabilities) minus excess cash.

ROC measures how efficiently management has used the capital employed in the business. The measure excludes excess cash and interest-bearing assets from this calculation to focus only on those assets actually used in the business to generate the return.

A BARGAIN PRICE

High earning yield = EBIT/TEV

TEV + Market Cap. + Total debt – minus excess cash + Preferred Stock + minority interests, and excess cash means cash + current assets – current liabilities.EBIT/TEV enables and apples-to-apples comparison of stock with different capital structures.

Improving on the Magic Formula?

ROC defined as Gross profitability to total assets.

GPA = (Revenue – Cost of Goods Sold)/Total Assets

GPA is the “cleanest” measure of true economic profitability.

See this study Gross Profitability a Better Metric and see pages 46-49 in Quant. Value. (the book was sent to deep-value group on Google)

The authors found GPA outperformed as a quality measure the magic formula.  Note on page 48, Table 2.3: Performance Stats for Common Quality Measures (1964 – 2011) that most simple quality measures do NOT provide any differentiation from the market!

FINDING PRICE, Academically–Book value/Market Price

The authors found that analyzing stocks along price and quality contours using the Magic Formula and its generic academic brother Quality and Price can produce market beating results 

The authors: “Our study demonstrates the utility of a quantitative approach to investing. Relentlessly pursuing a small edge over a long period of time, through booms and busts, good economies and bad, can lead to outstanding investment results.”

Ok, let’s come back to quality and avoiding value/death traps in the later chapters (3 and 4) in Quantitative Value.  We are just covering material in Chapter 2. 

INVESTORS BEHAVING BADLY

Investors and the Magic Formula

Adding Your Two Cents May Cost a Lot Over the Long Term by Joel Greenblatt
01-18-2012  (Full article: Adding Your Two Cents

Gotham Asset Management managing partner and Columbia professor Joel Greenblatt explains why investors who ‘self-managed’ his Magic Formula using pre-approved stocks underperformed the professionally managed systematic accounts.

So, what happened? Well, as it turns out, the self-managed accounts, where clients could choose their own stocks from the pre-approved list and then follow (or not) our guidelines for trading the stocks at fixed intervals didn’t do too badly. A compilation of all self-managed accounts for the two-year period showed a cumulative return of 59.4% after all expenses. Pretty darn good, right? Unfortunately, the S&P 500 during the same period was actually up 62.7%.

“Hmmm….that’s interesting”, you say (or I’ll say it for you, it works either way), “so how did the ‘professionally managed’ accounts do during the same period?” Well, a compilation of all the “professionally managed” accounts earned 84.1% after all expenses over the same two years, beating the “self managed” by almost 25% (and the S&P by well over 20%). For just a two-year period, that’s a huge difference! It’s especially huge since both “self-managed” and “professionally managed” chose investments from the same list of stocks and supposedly followed the same basic game plan.

Let’s put it another way: on average the people who “self-managed” their accounts took a winning system and used their judgment to unintentionally eliminate all the outperformance and then some! How’d that happen?

1. Self-managed investors avoided buying many of the biggest winners.

How? Well, the market prices certain businesses cheaply for reasons that are usually very well-known (The market is a discounting mechanism). Whether you read the newspaper or follow the news in some other way, you’ll usually know what’s “wrong” with most stocks that appear at the top of the magic formula list. That’s part of the reason they’re available cheap in the first place! Most likely, the near future for a company might not look quite as bright as the recent past or there’s a great deal of uncertainty about the company for one reason or another. Buying stocks that appear cheap relative to trailing measures of cash flow or other measures (even if they’re still “good” businesses that earn high returns on capital), usually means you’re buying companies that are out of favor.

These types of companies are systematically avoided by both individuals and institutional investors. Most people and especially professional managers want to make money now. A company that may face short-term issues isn’t where most investors look for near term profits. Many self-managed investors just eliminate companies from the list that they just know from reading the newspaper face a near term problem or some uncertainty. But many of these companies turn out to be the biggest future winners.

2. Many self-managed investors changed their game plan after the strategy under-performed for a period of time.

Many self-managed investors got discouraged after the magic formula strategy under-performed the market for a period of time and simply sold stocks without replacing them, held more cash, and/or stopped updating the strategy on a periodic basis. It’s hard to stick with a strategy that’s not working for a little while. The best performing mutual fund for the decade of the 2000’s actually earned over 18% per year over a decade where the popular market averages were essentially flat. However, because of the capital movements of investors who bailed out during periods after the fund had underperformed for a while, the average investor (weighted by dollars invested) actually turned that 18% annual gain into an 11% LOSS per year during the same 10 year period.[2]

3. Many self-managed investors changed their game plan after the market and their self-managed portfolio declined (regardless of whether the self-managed strategy was outperforming or underperforming a declining market).

This is a similar story to #2 above. Investors don’t like to lose money. Beating the market by losing less than the market isn’t that comforting. Many self-managed investors sold stocks without replacing them, held more cash, and/or stopped updating the strategy on a periodic basis after the markets and their portfolio declined for a period of time. It didn’t matter whether the strategy was outperforming or underperforming over this same period. Investors in that best performing mutual fund of the decade that I mentioned above likely withdrew money after the fund declined regardless of whether it was outperforming a declining market during that same period.

4. Many self-managed investors bought more AFTER good periods of performance.

You get the idea. Most investors sell right AFTER bad performance and buy right AFTER good performance. This is a great way to lower long-term investment returns.

Luck-versus-skill-in-mutual-fund-performance by Fama

….We will finish the chapter with a study of checklists in the next post.

Interesting reading: The Crescent Fund (note reversion to the mean)  Oil Crash Pzena and http://aswathdamodaran.blogspot.com/

Go-where-it-is-darkest-when-company.html (Vale-Brazilian Iron Ore Producer).   Prof. Damordaran values Vale and Lukoil on Nov. 20, 2015.  I am looking at Vale because they have some of the lowest cost assets of Iron Ore in the world.  They have good odds of surviving the downturn but where the trough is–who knows. 

Valuing Cyclical Companies:

Valuing Cyclical Commodity Companies

CS on a Cyclical Business or Thinking About Cypress Stock

Letter to Cypress Shareholders about Price vs Value

download_t_j__rodgers__cdc_2002_keynote_presentation

CY_VL

39_studie_value_creation_in_chemical_industry

vale

I think the author at least knew of the risks, but underestimated the extent of the cycle due to massive distortions caused by the world’s central banks.  It did get darker..as iron prices fell another 10% and still falling. 

Month Price Iron Ore Change
Aug 2014 92.63
Sep 2014 82.27 -11.18 %
Oct 2014 80.09 -2.65 %
Nov 2014 73.13 -8.69 %
Dec 2014 68.80 -5.92 %
Jan 2015 67.39 -2.05 %
Feb 2015 62.69 -6.97

vale

Damodaran: I have not updated my valuation of Vale (as of Feb. 20th), but I have neither sold nor added to my position. It is unlikely that I will add to my position for a simple reason. I don’t like doubling down on bets, even if I feel strongly, because I feel like I am tempting fate. 

Prof. Damodaran is responding to a poster who is asking about Vale’s plummeting stock price.  If you are a long-term bull you want declining prices to bankrupt weak companies in the industry so as to rationalize supply.

HAVE A GREAT WEEKEND!