Tag Archives: Reversion to the Mean

The Wheel of Fortune: Mean Reversion (Part 1)

graves

Last post on Chapter 4 in Quantitative Valuehttp://csinvesting.org/?p=10730 . Let’s get back to our course on Deep Value.

Let’s go back to DEEP VALUE, Chapter 5: A Clockwork Market: Mean reversion and the Wheel of Fortune.

As a value investor you are doing either:

  1. Buying a franchise, where barriers to entry allow for profitable growth, before mean reversion sets in or
  2. Buying assets where the normalized earnings’ power of those assets is below norm (Asset value = Earnings Power Value) and earnings’ power will mean revert to normal.

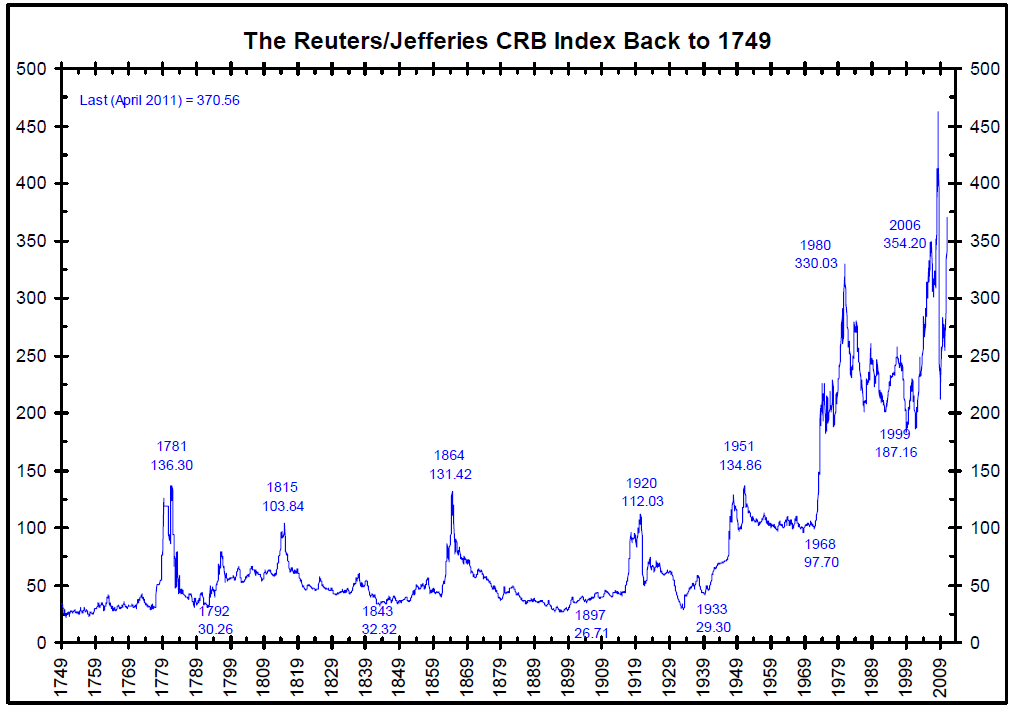
Therefore the concept of Regression to the Mean is powerful.  By putting the words, “Many shall be restored that now are fallend and many shall fall that now are in honor” on the facing page of Security Analysis, Graham gave the most prominent position in his seminal text to the idea that Fortuna’s wheel turns too for securities, lowering those that have risen and lifting those that have fallen.  The line, from Horace’s Ars Poetica, echoes the phrase spoken by the wise men of legend who boiled down the history of mortal affairs into the four words, “This too will pass.”  This is regression toward the mean. (p. 79).

The more extreme the initial price movement, the greater will be the subsequent adjustment in the opposite direction. There tends to be a price trend before reversal. The reasons are manifold, but the most obvious is that the trials aren’t independent—our own trading decisions are affected by the buying or selling preceding our trade.

Keynes discussed this phenomenon here:

https://www.marxists.org/reference/subject/economics/keynes/general-theory/ch12.htm or John Maynard Keynes and his life as an investor, Keynes as an investor

Two economists known for research into both market behavior and individual decision-making, Werner De Bondt and Richard Thaler, theorized that it is this overreaction to meaningless price movements that creates the conditions for mean reversion. Note page 800 in the link Does Stock Market Overreact—  the loser and winner portfolios.  Losers win out.

In a second study, Further Evidence of Inv Overreaction Thaler, Thaler and De Bondt revisited the research from a new perspective.  They hypothesized that the mean reversion they obserbed in stock prices in the first study might have been caused by investors focusing too much on the short-term. this fixation on the recent past and failure to look beyond the immediate future would cause investors to miscalculate future earnings by failing to account for mean reversion.  If earnings were also mean reversing, then extreme stock price increases and decreases might, paradoxically, be predictive of mean-reversion not just in stock prices, but in earnings too.  A stock price that has fallen a great deal becomes a good candidate for subsequent earnings growth, a vice versa for a stock price that has gone up a lot.  As you can see from the two research reports that the undervalued portfolio delivered better earnings and price performance.

The above research stand the conventional wisdom on its head and show compelling evidence for mean reversion in stocks in a variety of forms.

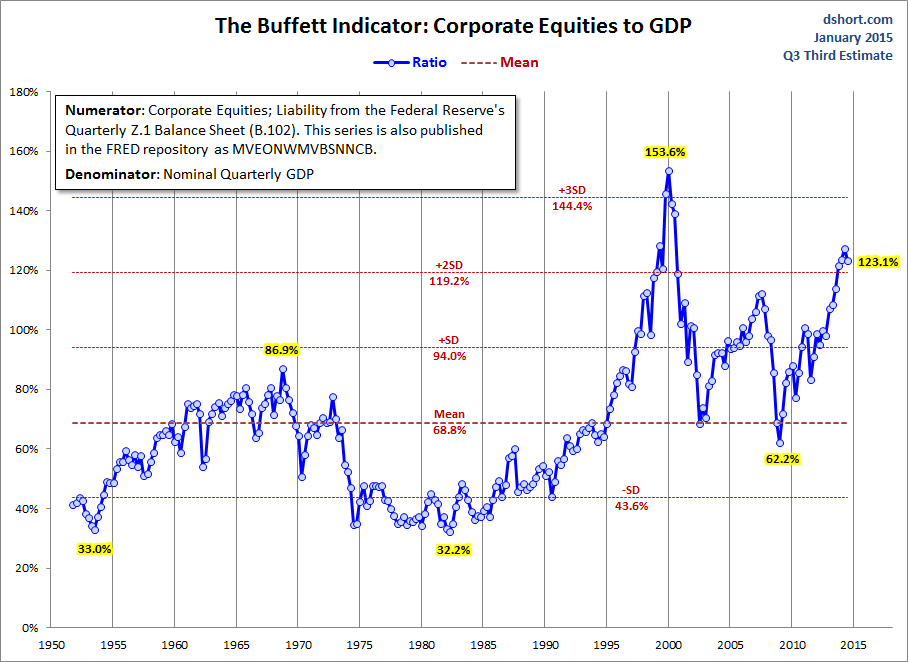
Buffett Discusses Mean Reversion in the Stock Market

Buffett_on_1999_Stock_Market_-_Fortune_Article & 2008 Market Call and a MUST READ: A Study of Market History through Graham Babson Buffett and Others

In the 1964 to 1981 period, Buffett wrote, U.S. GNP almost quintuples, rising 373 percent. The market, by contrast, went nowhere.

The evidence is that valuation, rather than economic growth, determines investment returns at the market and country level. Research suggests that chasing growth economies is akin to chasing overvalued stocks, and generates disappointing results. See

The growth illusion

Alas, this is not the case. Work done by Elroy Dimson, Paul Marsh and Mike Staunton at the London Business School established this back in 2005. Over the 17 countries they studied, going back to 1900, there was actually a negative correlation between investment returns and growth in GDP per capita, the best measure of how rich people are getting.  In a second test, they took the five-year growth rates of the economies and divided them into quintiles. The quintle of countries with the highest growth rate over the previous five years, produced average returns over the following year of 6%; those in the slowest-growing quintile produced returns of 12%. In a third test, they looked at the countries and found no statistical link between one year’s GDP growth rate and the next year’s investment returns.

Why might this be? One likely explanation is that growth countries are like growth stocks; their potential is recognised and the price of their equities is bid up to stratospheric levels. The second is that a stockmarket does not precisely represent a country’s economy – it excludes unquoted companies and includes the foreign subsidiaries of domestic businesses. The third factor may be that growth is siphoned off by insiders – executives and the like – at the expense of shareholders.

Paul Marson, the chief investment officer of Lombard Odier, has extended this research to emerging markets. He found no correlation between GDP growth and stockmarket returns in developing countries over the period 1976-2005. A classic example is China; average nominal GDP growth since 1993 has been 15.6%, the compound stockmarket return over the same period has been minus 3.3%. In stodgy old Britain, nominal GDP growth has averaged just 4.9%, but investment returns have been 6.1% per annum, more than nine percentage points ahead of booming China.

What does work? Over the long run (but not the short), it is valuation; the higher the starting price-earnings ratio when you buy a market, the lower the return over the next 10 years. That is why buying shares back in 1999 and 2000 has provided to be such a bad deal.

High Growth Depresses Future Stock Returns

Why does high growth seem to depress stock market returns and low growth seem to generate high stock market returns?  The market ALREADY recognizes the high growth nation’s potential, and bids the price of its equities too high. Market participants become overly optimistic during periods of high growth, driving up the prices of stocks and lowering long term returns, and become too pessimistic during busts, selling down stocks and creating e conditions for high long-term returns.  More research on that here:

  1. Jay_Ritter_paper_14_August Economic Growth and Stock Returns
  2. value-vs-glamour-a-global-phenomenon
  3. Blinded by Growth

I will finish this chapter in the next post. If you do not have DEEP VALUE or Quantitative Value, then join the deep value group found here: http://csinvesting.org/2015/01/14/deep-value-group-at-google/ and I will send.

If you only understand one concept besides Margin of Safety in investing then let it be Reversion to the Mean.

Commodities Carnage; Reversion to the Mean and the Growth Illusion; Net/Nets

Reuters

CRBSearch Strategy: Go where the outlook is bleakest (John Templeton). Keep his wisdom by your side: Sixteen Rules for Investment Success_Templeton

Commodities (CRB Index) fall back to a 40-year support zone ($185/$205)

while:Commodities-Sentiment

As global commodities prices plummet, it’s incredibly convenient to pronounce the commodities super-cycle dead, isn’t it?  Yet banks from Goldman Sachs to Citigroup to Deutsche Bank are on record as saying it’s over.   http://www.wallstreetdaily.com/2014/12/08/jim-rogers-commodities-interview/

The point is not to follow the “experts” but search where there is carnage. I am looking at Templeton’s Russian and Eastern Europe Fund TRF Semi Annual Report because:

  • Hated Countries (Russia, Ukraine)
  • Currencies Down,
  • Commodity Exporters and
  • trading at a 10% discount so the 1.4% management fee is covered for six years.
  • Poor performance for the past few years

Things can and will probably get worse. So please don’t follow the blind (me) off the cliff. This is meant as an example of a SEARCH STRATEGY.

More on Reversion to the Mean and the Growth Illusion

We are beating this subject to death but you can’t understand how investing in bargains works without grasping these concepts.

Contrarian Strategy Extrapolation and Risk  Abstract: Value strategies yield higher returns because these strategies exploit the sub-optimal behavior of the typical investor and not because these strategies are fundamentally riskier.  Yes, this is an academic paper, but worth reading to understand WHY and HOW value (buying stocks with low expectations/and low price to business metrics like earnings, cash flow, EBITDA, etc.) provide better returns.

Growth Illusion

The Two Percent Dilution It is widely believed that economic growth is good for stockholders. However, the cross-country correlation of real stock returns and per capita GDP growth over 1900–2002 is negative. Economic growth occurs from high personal savings rates and increased labor force participation, and from technological change. If increases in capital and labor inputs go into new corporations, these do not boost the present value of dividends on existing corporations. Technological change does not increase profits unless firms have lasting monopolies, a condition that rarely occurs. Countries with high growth potential do not offer good equity investment opportunities unless valuations are low.

value-vs-glamour-a-global-phenomenon (Brandes Institute)

Thick as a Bric by Efficient Frontier

Does the Stock Market Over React

Discussion of Does the Stock Market Over React

Criticism of the Over Reaction Theory

The above is meant to supplement your reading in Deep Value Chapter 5, A Clockwork Market


Ben Graham’s Net-Net Strategy Revisited

Ben Graham Net Current Asset Values A Performance Update

R-T-M, Gross Profitability, Magic Formula

Our last lesson was in Mean Reversion (Chapter 5 in Deep Value) discussed http://wp.me/p2OaYY-2Ju  View this video on a very MEAN Reversion.

We must understand full cycles and reversion to the mean.  Let’s move on to reading Chapter 2: A Blueprint to a better Quantitative Value Strategy in Quantitative Value.

Investors should be skeptical of history-based models. Constructed by a nerdy-sounding priesthood using esoteric terms such as beta, gamma, sigma and the like, these models tend to look impressive. Too often, though, investors forget to examine the assumptions behind the symbols. Our advice: Beware of geeks bearing formulas. -Warren Buffett, Shareholder Letter, 2000.

A WONDERFUL BUSINESS

Greenblatt defined Buffett’s definition of a good business as a high Return on Capital (ROC) – EBIT/Capital

Capital is defined as fixed asses + working capital (current assets minus current liabilities) minus excess cash.

ROC measures how efficiently management has used the capital employed in the business. The measure excludes excess cash and interest-bearing assets from this calculation to focus only on those assets actually used in the business to generate the return.

A BARGAIN PRICE

High earning yield = EBIT/TEV

TEV + Market Cap. + Total debt – minus excess cash + Preferred Stock + minority interests, and excess cash means cash + current assets – current liabilities.EBIT/TEV enables and apples-to-apples comparison of stock with different capital structures.

Improving on the Magic Formula?

ROC defined as Gross profitability to total assets.

GPA = (Revenue – Cost of Goods Sold)/Total Assets

GPA is the “cleanest” measure of true economic profitability.

See this study Gross Profitability a Better Metric and see pages 46-49 in Quant. Value. (the book was sent to deep-value group on Google)

The authors found GPA outperformed as a quality measure the magic formula.  Note on page 48, Table 2.3: Performance Stats for Common Quality Measures (1964 – 2011) that most simple quality measures do NOT provide any differentiation from the market!

FINDING PRICE, Academically–Book value/Market Price

The authors found that analyzing stocks along price and quality contours using the Magic Formula and its generic academic brother Quality and Price can produce market beating results 

The authors: “Our study demonstrates the utility of a quantitative approach to investing. Relentlessly pursuing a small edge over a long period of time, through booms and busts, good economies and bad, can lead to outstanding investment results.”

Ok, let’s come back to quality and avoiding value/death traps in the later chapters (3 and 4) in Quantitative Value.  We are just covering material in Chapter 2. 

INVESTORS BEHAVING BADLY

Investors and the Magic Formula

Adding Your Two Cents May Cost a Lot Over the Long Term by Joel Greenblatt
01-18-2012  (Full article: Adding Your Two Cents

Gotham Asset Management managing partner and Columbia professor Joel Greenblatt explains why investors who ‘self-managed’ his Magic Formula using pre-approved stocks underperformed the professionally managed systematic accounts.

So, what happened? Well, as it turns out, the self-managed accounts, where clients could choose their own stocks from the pre-approved list and then follow (or not) our guidelines for trading the stocks at fixed intervals didn’t do too badly. A compilation of all self-managed accounts for the two-year period showed a cumulative return of 59.4% after all expenses. Pretty darn good, right? Unfortunately, the S&P 500 during the same period was actually up 62.7%.

“Hmmm….that’s interesting”, you say (or I’ll say it for you, it works either way), “so how did the ‘professionally managed’ accounts do during the same period?” Well, a compilation of all the “professionally managed” accounts earned 84.1% after all expenses over the same two years, beating the “self managed” by almost 25% (and the S&P by well over 20%). For just a two-year period, that’s a huge difference! It’s especially huge since both “self-managed” and “professionally managed” chose investments from the same list of stocks and supposedly followed the same basic game plan.

Let’s put it another way: on average the people who “self-managed” their accounts took a winning system and used their judgment to unintentionally eliminate all the outperformance and then some! How’d that happen?

1. Self-managed investors avoided buying many of the biggest winners.

How? Well, the market prices certain businesses cheaply for reasons that are usually very well-known (The market is a discounting mechanism). Whether you read the newspaper or follow the news in some other way, you’ll usually know what’s “wrong” with most stocks that appear at the top of the magic formula list. That’s part of the reason they’re available cheap in the first place! Most likely, the near future for a company might not look quite as bright as the recent past or there’s a great deal of uncertainty about the company for one reason or another. Buying stocks that appear cheap relative to trailing measures of cash flow or other measures (even if they’re still “good” businesses that earn high returns on capital), usually means you’re buying companies that are out of favor.

These types of companies are systematically avoided by both individuals and institutional investors. Most people and especially professional managers want to make money now. A company that may face short-term issues isn’t where most investors look for near term profits. Many self-managed investors just eliminate companies from the list that they just know from reading the newspaper face a near term problem or some uncertainty. But many of these companies turn out to be the biggest future winners.

2. Many self-managed investors changed their game plan after the strategy under-performed for a period of time.

Many self-managed investors got discouraged after the magic formula strategy under-performed the market for a period of time and simply sold stocks without replacing them, held more cash, and/or stopped updating the strategy on a periodic basis. It’s hard to stick with a strategy that’s not working for a little while. The best performing mutual fund for the decade of the 2000’s actually earned over 18% per year over a decade where the popular market averages were essentially flat. However, because of the capital movements of investors who bailed out during periods after the fund had underperformed for a while, the average investor (weighted by dollars invested) actually turned that 18% annual gain into an 11% LOSS per year during the same 10 year period.[2]

3. Many self-managed investors changed their game plan after the market and their self-managed portfolio declined (regardless of whether the self-managed strategy was outperforming or underperforming a declining market).

This is a similar story to #2 above. Investors don’t like to lose money. Beating the market by losing less than the market isn’t that comforting. Many self-managed investors sold stocks without replacing them, held more cash, and/or stopped updating the strategy on a periodic basis after the markets and their portfolio declined for a period of time. It didn’t matter whether the strategy was outperforming or underperforming over this same period. Investors in that best performing mutual fund of the decade that I mentioned above likely withdrew money after the fund declined regardless of whether it was outperforming a declining market during that same period.

4. Many self-managed investors bought more AFTER good periods of performance.

You get the idea. Most investors sell right AFTER bad performance and buy right AFTER good performance. This is a great way to lower long-term investment returns.

Luck-versus-skill-in-mutual-fund-performance by Fama

….We will finish the chapter with a study of checklists in the next post.

Interesting reading: The Crescent Fund (note reversion to the mean)  Oil Crash Pzena and http://aswathdamodaran.blogspot.com/

Go-where-it-is-darkest-when-company.html (Vale-Brazilian Iron Ore Producer).   Prof. Damordaran values Vale and Lukoil on Nov. 20, 2015.  I am looking at Vale because they have some of the lowest cost assets of Iron Ore in the world.  They have good odds of surviving the downturn but where the trough is–who knows. 

Valuing Cyclical Companies:

Valuing Cyclical Commodity Companies

CS on a Cyclical Business or Thinking About Cypress Stock

Letter to Cypress Shareholders about Price vs Value

download_t_j__rodgers__cdc_2002_keynote_presentation

CY_VL

39_studie_value_creation_in_chemical_industry

vale

I think the author at least knew of the risks, but underestimated the extent of the cycle due to massive distortions caused by the world’s central banks.  It did get darker..as iron prices fell another 10% and still falling. 

Month Price Iron Ore Change
Aug 2014 92.63
Sep 2014 82.27 -11.18 %
Oct 2014 80.09 -2.65 %
Nov 2014 73.13 -8.69 %
Dec 2014 68.80 -5.92 %
Jan 2015 67.39 -2.05 %
Feb 2015 62.69 -6.97

vale

Damodaran: I have not updated my valuation of Vale (as of Feb. 20th), but I have neither sold nor added to my position. It is unlikely that I will add to my position for a simple reason. I don’t like doubling down on bets, even if I feel strongly, because I feel like I am tempting fate. 

Prof. Damodaran is responding to a poster who is asking about Vale’s plummeting stock price.  If you are a long-term bull you want declining prices to bankrupt weak companies in the industry so as to rationalize supply.

HAVE A GREAT WEEKEND!

ROIC and Reversion to the Mean

Buffett-Indicator

Buffett-Indicator-with-Wilshire-5000

If women ran the world we wouldn’t have wars, just intense negotiations every 28 days. –Robin Williams

Return Measures by Damordaran 2007 (More on ROIC)

REGRESSION TO THE MEAN

This is a key concept to learn along with EV/EBITDA, MCX, and cheapness wins.

REGRESSION TO THE MEAN  A good read by an Australian Graham & Dodd-like Investor.

When an investor turns to the research on regression to the mean and investors overreacting to poor company performance/bad news in Richard Thaler research, he or she sees that prices of the winner and loser portfolios take three-to-seven years to revert.  See also The New Finance: The Case Against Efficient Markets by Robert A. Haugen and Inefficient Markets by Andrei Schleifer.

RTM vs EMT

Illustration by S of Reversion to the Mean

t is it a Goode value

We next progress to Chapter 5: A Clockwork Market, Mean Reversion and the Wheel of Fortune in Deep Value.

From there we will read chapters 3 and 4 in Quantitative Value.

DIA-2002

Questions on Chapter 4

ABOOK-Feb-2015-Buybacks (1)

The Acquirer’s Multiple Ch 4 in DEEP VALUE  is where we left off in discussing Chapter 4.

Imagine diligently watching those stocks each day as they do worse than the market average over the course of many months or even years….The magic formula portfolio fared poorly relative to the market average in five out of every 12 months tested. For full-year period…failed to beat the market average once every four years. Joel Greenblatt discusses the role that loss aversion plays in deterring investors from following his ‘magic formula’. (Montier)

A Summary

Greenblatt reinterpreted Buffett’s return on equity capital measure as RETURN ON CAPITAL, which he construed as the ratio of pre-tax operating earnings (earnings before interest and taxes, or EBIT or EBITDA-MCX or operating earnings that are sustainable) to tangible capital employed in the business (Net Working Capital + Net Fixed Assets) defined as:

Return on Capital = EBIT divided by (Net Working Capital (NWC) + Net Fixed Assets)

The use of EBIT makes the return on capital ratio comparable across different capital structures. EBIT makes an apples-to-apples comparison possible.

For tangible capital Greenblatt uses NWC + Net Fixed Assets rather than total assets to determine the amount of capital each company actually requires to conduct its business.

The higher the return on capital ratio, the more wonderful the company.

To determine a fair price, Greenblatt uses earnings yield, which he defines as follows:

Earnings Yield = EBIT divided by Enterprise Value (EV).

EV gives a more full picture of the actual price an acquirer must pay than market capitalization alone.  EBIT is agnostic to capital structure so we can compare companies on a like-for-like basis.

The higher operating earnings are in relation to enterprise value, the higher the earning yield, and the better the value.

Greenblatt has quantified Buffett’s wonderful company at a fair price strategy.

Enterprise Multiple (EV) = EBITDA divided by EV or (EBITDA – Maintenance Capital Expenditures) divided by EV.

BEWARE!

The EV to EBITDA ratio is useless without a discussion on asset lives, capital intensity, technological progress or revenue recognition.

EBITDA, or any of its derivatives (EBDIT, EBITDAR, etc.) is simply a crude measure of gross cash flow.

The gross cash flow margin is simply a measure of the capital intensity of the business.   A manufacturing business will have a significantly higher gross cash margin than, say, a retailer, because it needs to pay for the capital (via in the accounting sense the depreciation charge) of all its plant and equipment which consumes more of it than a superstore.

What matters is not gross cash flow but net of free cash flow, which is the amount of cash available after reinvestment.

Case Study:

In the heyday of the technology bubble, the EV to EBITDA ratio was a favorite among telecom analysts.   Sadly, as new entrants came into the system and pushed up the price of the UMTS licenses (the third generation of mobile networks) to insane levels, the cost of replacement went sky-rocketing; expected free cash flow plummeted, and the telecom shares got more and more ‘attractive’ on an EBITDA basis, which could not capture any of this.   Eventually, some went bankrupt, some had to undergo a debt rescheduling exercise or issue new capital, and all saw their share price collapse.

James Murray Wells, a 21-year-old law student in Bristol, UK, needed a pair of glasses, and was faced with a bill of 150 stg.   He found that the manufacturing cost off standard spectacles (frame and glasses) was less than 10 stg.   This prompted Mr. Murray Wells to set up an Internet-based company to challenge what he claimed was a lack of price competition among the four major high street opticians in England.  Three months into his venture, he was selling hundreds of pairs for as little as 15 stg to apparently delighted customers.

The replacement value of the asset, ‘making spectacles and selling them’ is rather low.   A 21-year old student with no expertise in the field is apparently able to replicate it from his student room, with a few thousand pounds borrowed from his father.   On the other hand, the market value is enormous because, as previously discussed, it equals the net present value of free cash flow discounted to infinity.

The market value is a direct function of the economic profitability of the asset in question and, in this example with a cost of goods sold at 10 and sales at $150, it is plain that economic value added is truly staggering.   Making spectacles and selling them has a high ROIC, and an equally impressive asset multiple—the ratio of market value to the replacement value of invested capital.

If the entrepreneur is successful in his venture, he will collapse the marginal return on capital invested of the industry by accepting a lower margin than his competitors.   The entrepreneur made an arbitrage between the market value of existing capacity and the replacement value of new capacity, which he found cheaper to create.

Investors in incumbent firms my find out that they have paid too much for the economic value of their asset in the belief that a very high economic return on capital invested was sustainable.   Investors who ignore the workings of the capital cycle, the ultimate driver of share prices, do so to their disadvantage.

Investment should just be a replication of the process of arbitrage between market value and replacement value. Good stock pickers are brilliant strategy analysts.   They understand the business case for the company. (TATOO that to your forehead!)

Questions:

Why is the EV so good at identifying undervalued stocks?

What drives the returns of the magic formula? What Metric?  What does this mean for us as Deep Value Investors?

Assuming you read the entire chapter, what two main points about investing did you learn?  Anything surprise you?

Supplementary Readings:

What Has Worked in Investing by Tweedy Browne   Why do low price-to-book, low price to cash flows, etc tend to generate higher returns than a market average?  What is the principle behind the returns?  Also, note the Richard Thaler link below for a hint.

When an investor turns to the research on regression to the mean and investors overreacting to poor company performance/bad news in Richard Thaler research, he or she sees that prices of the winner and loser portfolios take three-to-seven years to revert.  See also The New Finance: The Case Against Efficient Markets by Robert A. Haugen and Inefficient Markets by Andrei Schleifer.

Next, we will focus on Mean Reversion and ROIC.

Death Taxes and Reversion To The Mean (Mauboussin)

ROIC

Dale Wettlaufer on ROIC and MROIC  a series of Fool.com articles

EconomicModel of DFC_ROIC The author uses NOPAT (after-taxes). I placed this here for those who wanted to see how others determine value.

We will review the second half of the chapter next.


Corporate Profits and Reversion to the Mean

Stein was the formulator of “Herbert Stein’s Law,” which he expressed as “If something cannot go on forever, it will stop,” by which he meant that if a trend (balance of payments deficits in his example) cannot go on forever, there is no need for action or a program to make it stop, much less to make it stop immediately; it will stop of its own accord.[2] It is often rephrased as: “Trends that can’t continue, won’t.”


Go read the full post on corporate profits here: http://scottgrannis.blogspot.com/2012/03/corporate-profits-continue-to-impress.html

Perhaps the market is already anticipating a reversion to the mean:


James Montier of GMO emphatically says reversion is inevitable. However, does that mean stocks will decline?

https://www.gmo.com/America/CMSAttachmentDownload.aspx?target=JUBRxi51IIBtbYEu0yy2D233

Qql0krF9YIWDpyU9bC1DsIW9OxrQN38JW598obIegPVL5Vm43jTd74

zJ0R1rY2lRRYvkFggPe%2bdZF4oUF%2bEun279ii1ThA%3d%3d

Efficient Market Theory

Does anyone think EMT–say it fast five times as loud as you can, what do you hear–is like the BLACK KNIGHT?http://www.youtube.com/watch?v=dhRUe-gz690

No matter what the evidence or facts against the theory, it is only a flesh wound?