Category Archives: Uncategorized

The History of Trading in the Pits; Much More

Trading Pits

The successful investor is a master of paradox. He expects the unexpected, distrusts the experts and loves what the majority hates. He believes that, in markets as in heaven, the first shall be last and the last shall be first.

There’s fool’s gold–pyrite–and then there’s fools’ gold owned by idiots who will trade it for worthless dollars.

History of the trading pits: http://www.tradingpitblog.com/ Great blog!

What is money? What is money_ TTMYGH_17_Feb_2014

Assessing Long-Term Account Performance

http://www.tocquevillefunds.com/insights/secular-lessons

Hard wired for bubbles (Dan Ariely)

http://www.peakprosperity.com/podcast/84804/dan-ariely-why-humans-hard-wired-create-asset-bubbles?

Thinking properly about “cash sitting on the sidelines.” Or how to think properly. http://www.acting-man.com/?p=28594

Rick Rule on Gold Miners and Gold (Of course, when you ask a barber if you need a haircut…..But, he has a lot of experience in these markets.  Survival is proof enough of competence in the miners!

AUDIOhttp://kingworldnews.com/kingworldnews/Broadcast/Entries/2014/2/16_Rick_Rule_files/Rick%20Rule%202%3A16%3A2014.mp3

Rick Rule: We’ve said on your interviews, ‘You’ve suffered through the pain, why not hang around for the gain?’  I think we’re in the beginning of the gain session.  Your readers and listeners, at least those who are new to the sector, need to understand that we are in a rising channel, but we are in a rising channel that is going to have higher highs and higher lows….

It’s going to be volatile.  You are going to see 15% declines, and you are going to see 20% gains for seemingly no reason.  The important thing to note is that I certainly believe the precious metals sector and the precious metals shares have bottomed and they are moving up.

We’re tempted to say that the bottom was reached and the recovery in the junior shares began in July of last year.  Certainly, November, December, and January have seen pretty good rises — 40% share price escalations have not been uncommon.

It is not uncommon for well-constructed portfolios in a precious metals market recovery to experience five-fold or ten-fold gains.  So for those people who went through the downturn and are now beginning to experience the upturn, firstly, congratulations.  And second, keep your seatbelt on.  It’s going to be very volatile but I think we are higher, probably substantially higher from here.” 


Eric King:  “William Kaye, the outspoken hedge fund manager from Hong Kong, was telling King World News that demand (for gold) out of China is just ‘insatiable.’  Your thoughts on the physical demand we’ve seen around the globe — it’s been quite stunning.”

Rule:  “He would know better than I with regard to Hong Kong demand, but certainly we’ve seen very strong physical demand from around the world.  A lot of the physical demand has taken place right here in the United States.

What’s interesting about his (Kaye’s) statement is the dichotomy between the private physical markets and the long-term markets.  I can’t help going back to an announcement about 12 months ago, when the Germans wanted to repatriate their 1,500 tons of gold, and they were told by the US government that it would take seven years (to get back only 300 tons of gold) that was theirs.

At the same time, over 30 days, in the physical market, Chinese retail buyers bought and took delivery of 1,120 tons of gold.  One of the things that this points out is the very, very odd dichotomy between central bank and multilateral institutional holdings of gold, and the paper gold market on one side, and the honesty of the physical market on the other side.  

My suspicion is that the physical market is prevailing and will continue to prevail over the paper market.  And the subtext of this is that the documented large (gold) short positions that exist in the paper market may get their long awaited religious experience as they are unable to deliver against futures obligations.”

from www.kingworldnews.com

Seth Klarman on investing vs speculating:

Mark Twain said that there are two times in a man’s life when he should not speculate: when he can’t afford it and when he can. Because this is so, understanding the difference between investment and speculation is the first step in achieving investment success.

To investors stocks represent fractional ownership of underlying businesses and bonds are loans to those businesses. Investors make buy and sell decisions on the basis of the current prices of securities compared with the perceived values of those securities. They transact when they think they know something that others don’t know, don’t care about, or prefer to ignore. They buy securities that appear to offer attractive return for the risk incurred and sell when the return no longer justifies the risk.

Investors believe that over the long run security prices tend to reflect fundamental developments involving the underlying businesses. Investors in a stock thus expect to profit in at least one of three possible ways: from free cash flow generated by the underlying business, which eventually will be reflected in a higher share price or distributed as dividends; from an increase in the multiple that investors are willing to pay for the underlying business as reflected in a higher share price; or by a narrowing of the gap between share price and underlying business value.

Speculators, by contrast, buy and sell securities based on whether they believe those securities will next rise or fall in price. Their judgment regarding future price movements is based, not on fundamentals, but on a prediction of the behavior of others. They regard securities as pieces of paper to be swapped back and forth and are generally ignorant of or indifferent to investment fundamentals. They buy securities because they “act” well and sell when they don’t. Indeed, even if it were certain that the world would end tomorrow, it is likely that some speculators would continue to trade securities based on what they thought the market would do today.

Speculators are obsessed with predicting – guessing – the direction of stock prices. Every morning on cable television, every afternoon on the stock market report, every weekend in Barron’s, every week in dozens of market newsletters, and whenever businesspeople get together, there is rampant conjecture on where the market is heading. Many speculators attempt to predict the market direction by using technical analysis – past stock price fluctuations – as a guide. Technical analysis is based on the presumption that past share price meanderings, rather than underlying business value, hold the key to future stock prices. In reality, no one knows what the market will do; trying to predict it is a waste of time, and investing based upon that prediction is a speculative undertaking.

Market participants do not wear badges that identify them as investors or speculators. It is sometimes difficult to tell the two apart without studying their behavior at length. Examining what they own is not a giveaway, for any security can be owned by investors, speculators, or both. Indeed, many “investment professionals” actually perform as speculators much of the time because of the way they define their mission, pursuing short-term trading profits from predictions of market fluctuations rather than long-term investment profits based on business fundamentals. As we shall see, investors have a reasonable chance of achieving long-term investment success; speculators, by contrast, are likely to lose money over time. www.shortsideoflong.com

A True Contrarian: John M. Templeton


What is your investment approach? John Templeton, “I search for bargains.” “Buy at the point of maximum pessimism. Go where the outlook is the worst.”

The above video is worth viewing if you want to understand how important personality and values are for the type of investor you become. Templeton’s thrifty ways and contrary streak were embedded in his approach. He is seldom studied. Too bad. 

The Templeton Way A book synopsis

Templeton on Investor Attitude

Criticism is the fertilizer of learning. –John Templeton.

A Great Individual Investor’s Investment Letter; A Reader’s Questions

NSA-Santa

A successful individual investor recaps 2013 (Must Read) David Collum_2013_year_in_review  

Note how few long-term decisions he made. Owning long-term bonds from 1980 to 1988, etc.  Buying precious metals in 2001 and STILL holding on through 2013–now that is long-term investing! 2013 was only his second losing year in several decades thanks to gold and silver being down 39% and 55% this year.

Video

A Reader’s Question

I have a couple of valuation questions that I have been wrestling with recently.  I would love to hear your take.

First, do you ever use a PE ratio for valuation?  I have always used a EV to EBIT or something ratio whether pre-tax or after-tax.  (I have an idea of the multiples that interest me in both cases.)  Sometimes I come across something that has a low PE but not so low EV/EBIT.  I think this is when the company has financial leverage and is paying an interest rate substantially below the earnings yield.  If it’s a high quality business and the leverage does not harm the company is it sometimes better to use a PE?
John Chew: No, I would use EV (enterprise value which includes net debt) rather than “P” or market cap because debt is part of the price that you pay. Also, look at the terms and conditions of the debt. Note the quality as well as the quantity of the debt. Bank debt is more onerous than say company-issued bonds. 
Also, if you are normalizing earnings, and current earnings are depressed and may be for a while, do you account for this in the valuation, perhaps as a liability?  Or is this an effort to be overly precise?  This quote from Jean-Marie Eveillard in The Value Investors suggests that the former method is overly precise because the future is uncertain:
  “There is no point asking about a company’s earnings outlook because if we are investing for the long-term, then short-term earnings never affect our intrinsic value calculation. Asking management about long-term plans is also pointless to me because the world changes. No one can predict what will happen, and so what is important for us as analysts is to discover the underlying strengths and weaknesses of the business ourselves.”
John Chew: You do not count this as a liability when you normalize earnings.  You look back over a long enough history 12 to 15 years (including the 2008/09 credit crisis) to sense what normal earnings are.  Part of normalizing earning would be assessing the competitive advantage of the business or the uniqueness of the assets.  For example, you should be able to have confidence in the earnings power of the assets owned by Compass Minerals (rock salt positioned near the Great Lakes giving a cost advantage). 
Finally, I want to share a quote from Dylan Grice that I recently found and thought you may find interesting:
Dylan Grice in the July 17, 2012, Popular Delusions
The power of a discounted cashflow model is that it allows us to achieve a value which is objective. With a model based on discounted future cashflow we can arrive at intrinsic value.
But is this correct? Can cash flows be objectively valued? Suppose I’m a fund manager worried that if I underperform the market over a twelve-month period I’ll be out of a job. What value would I attach to a boring business with dependable and robust cash flows, and therefore represents an excellent place to allocate preserve and grow my client’s capital over time but which, nevertheless, is unlikely to ‘perform’ over the next twelve months? The likelihood is that I will value such cash flows less than an investor who considers himself the custodian of his family’s wealth, who attached great importance to the protection of existing wealth for future generations, values permanence highly, and is largely uninterested in the next twelve months.
In other words, an institutional fund manager might apply a ‘higher discount rate’ to those same expected cash flows than the investor of family wealth. They arrive at different answers to the same problem. The same cash flows are being valued subjectively and there is no such thing as an objective or ‘intrinsic value’ embedded in the asset, even though it has cash flows.
John Chew: Well, I agree that investors have different discount rates. You need to use one that fits your situation.  We are discussing human beings making decisions under uncertainty or human action.  All value is subjective. To learn more go to: http://mises.org/austecon/chap4.asp
Thanks for the questions and to all a Happy, Healthy and Prosperous New Year in 2014


What is the Trend Telling Us? Robert Mundell’s Monetary History

longtermAUBasket1718

 Does anyone sense a trend over the past three hundred years?

The severing of the dollar link to gold in 19171 and the movement to flexible exchange rates in 1973 removed constraints on monetary expansion. The dollar emerged as the only international money and, in the words of Robert Mundell:

The U.S. Federal Reserve could now pump out billions and billions of dollars that would be taken up and used as reserves by the rest of the world. Not only that, but US government Treasury bills and bonds became a new form of international money. Dollars became the reserves of new international banks producing money in the Eurodollar market and other offshore outlets for international money. The newly elastic international monetary supply was now made to order to accommodate the supply shock of the oil price spike at the end of 1973. The quadrupling of oil prices created deficits in Europe and Japan which were financed by Eurodollar credits, in turn fed by US monetary expansion. The Fed argued that its policy was not inflationary because the money supply in the United States did not rise unduly. The fact is that it had been exported to build the base for inflation abroad. As I showed in an article published in 1971 (IMS in the 21st Century Robert Mundell and mundell-lecture), it is the world, not the national dollar base that governs inflation. Prices rose 3.9 times in the quarter century after 1971, by far the most inflation than at any other time in the nation’s history.

Our Current Situation

debtchart

Our choices are to restructure the debt, grow our way to repayment and/or print. What choice will the Fed make?Money-TMS-2

US money supply TMS-2 (components by legal categorization) since 1960 – by Michael Pollaro.

If there were a free market for money, unexpected sudden increases in the demand for money (due to exogenous events like e.g. the threat of war) would likely also see a reaction from the supply side.  However, the increase in resources devoted to obtaining a larger supply of the money commodity (in a free market, money would be a commodity with a pre-existing use value) would be strictly guided by the wishes of consumers. Moreover, even if the money supply were completely fixed, a demand for higher cash balances would simply lead to adjustment by raising money’s purchasing power until the higher demand was satisfied (we are assuming that if a free market in money were to obtain, the entire economy would likely be unhampered; prices and wages would be free to adjust).

Given the enduring popularity of inflationary policies, we suspect that lessons that should have been learned long ago will have to be relearned – the hard way.

Read the article on why many hope for a return of inflation: http://www.acting-man.com/?p=26808t

Meanwhile the market sets up with its Fed induced distortion: http://www.cnbc.com/id/101137648

Value Vault Videos and Book Folders

ARROW Oct 23


VALUE VAULT VIDEOS AND BOOKS

 
Books

View Folder

Bruce Greenwald Valuation and VI Videos 2005

View Folder

Bruce Greenwald Value Investing Class Videos 2010

View Folder


                     Bruce Greenwald Videos Part two

View Folder

Greenblatt Videos

View Folder

Corp. Finance

View Folder

Distressed_1

View Folder


VV_CS_Inv

View Folder

HAVE A GOOD WEEKEND!

Plenty here to keep anyone busy. Post your notes/thoughts/questions.


Regional Econ. of Scale with Govt. Privileges: The Bunny Ranch


The Economics:

1207-jimi-lynn-document-1

http://www.tmz.com/2012/12/23/bunny-ranch-prostitute-jimi-lynn-lawsuit-brothel-contract-lube/

http://www.tmz.com/2012/12/23/bunny-ranch-prostitute-jimi-lynn-lawsuit-brothel-contract-lube/


Economic Indicator: Whore house traffic is down by 40%. Times are tough!

Visiting the Bunny Ranch: http://anotherworldblog.wordpress.com/2011/02/01/trapped-at-the-bunny-ranch-part-2-interview-with-a-prostitute/

Treasure Chest! Many Quality Investment Books

Books

Dropbox Links

Editor: It seems as though the traffic crashed the links, so I will need to find another storage/sharing method. Patience while I work on it.

This leads me to wonder if starting a private web-site/blog with a csinvesting analyst manual would be an improvement. A person could have a book with links to videos/case studies and books in an organized fashion to become a knowledgeable investor–more learning materials than any other web-site/university times ten!  Imagine a private library/study area/discussion lounge for learning value investing.  The site could be self-sustaining with a nominal fee per annum. It would weed out the people who are not very committed.

Also, sharing info would be easier.         Thoughts for the future………

Meanwhile I will try to find another way to share those books. 

REMS of a stock operator

Reminiscences of a Stock Operator (A Classic)

Next post………


Reader’s Question: How to Weight My Investments?

 POKER

Bet big on a winning hand!

A Reader: Do you have any recommendation on sizing of holdings? It is not a topic much covered in the investment world. In general the focus is on what to buy/sell, but not how much of it.

My reply: This is an excellent question! Many investors just blindly diversify and they never study the quality of their opportunity. In fact, you should have a question like that on your pre-investment check-list.

Obviously, the answer depends upon your assessment of the opportunity. This is where the “art” or hard-won experience comes into play. In fact, I believe a large part of Joel Greenblatt’s returns were created through heavily weighted investments at certain times vs. just consistently performing outstanding security analysis. Prof. Greenblatt knew when to push his chips out onto the table.

For example, if you read, You Can Be A Stock Market Genius (Greenblatt’s book on special situations). Please buy, read and memorize this book. There is a chapter on the Sears spin-off. In class, as well as, in the book. Prof. Greenblatt explains how Sears was going to be spun-off at about the equivalent of 1/10th the price of J.C. Penney as shown through a comparative analysis of the two companies. Also, J.C. Penney had much more debt then Sears at the time. In other words, the valuation discrepancy was so big you could drive a truck through it (see pages 104 to 106 in his book.  A student asked, “How much did you invest in Sears?” Prof. Greenblatt’s response, “Let’s just say I loaded up the truck and then some…..”

Don’t hold me to this, but I estimate Joel put in 25% to 50% of his portfolio into Sears. The stock proceeded to go up 50% in the next few months. Joel weighted his investment.

The size of your margin of safety and risk of loss determines your bet.  If you look down below in the example of the Kelly Formula, a 60% chance of winning vs. 40% chance of losing with an even pay-off means you bet 20% of your bank roll.  I like to have at worse case a 40% chance of a 50% loss vs. a 60% chance of a double, I bet 10%–I under-bet.  But when Enstar (ESGR) trade near $40 back in 2009, I bet 30% of my portfolio because the company was liquid, under-leveraged and growing its book value at 20% per year and the worse the financial crisis the better for its business of acquiring insurance in run-off.  A very rare opportunity.

You must develop your own method but see below…………

Conclusions from a book review of Fortune’s Formula (See Below)

Fortune’s Formula is vastly better researched than your typical popsci book: Poundstone extensively cites and quotes academic literature, going so far as to unearth insults and finger-pointing buried in the footnotes of papers. Pounstone clearly understands the math and doesn’t shy away from it. Instead, he presents it in a detailed yet refreshingly accessible way, leveraging fantastic illustrations and analogies. For example, the figure and surrounding discussion on pages 197-201 paint an exceedingly clear picture of how objectives #1 and #2 compare and, moreover, how #1 “wins” in the end. There are other gems in the book, like

  • Kelly’s quote that “gambling and investing differ only by a minus sign” (p.75)
  • Louis Bachelier’s discovery of the efficient market hypothesis in 1900, a development that almost no one noticed until after his death (p.120)
  • Poundstone’s assertion that “economists do not generally pay much attention to non-economists” (p.211). The assertion rings true, though to be fair applies to most fields and I know many glaring exceptions.
  • The story of the 1998 collapse of Long-Term Capital Management and ensuing bailout is sadly amusing to read today (p.290). The factors are nearly identical to those leading to the econalypse of 2008: leverage + correlation + too big to fail. (Poundstone’s book was published in 2005.) Will we ever learn? (No.)

Fortune’s Formula is a fast, fun, fascinating, and instructive read. I highly recommend it.

http://blog.oddhead.com/2010/03/01/fortunes-formula/


There are currently only two major books about the Kelly Criterion on the market that I am aware of.1) “Fortune’s Formula”  by William Poundstone
2) “The Kelly Capital Growth Investment Criterion” by Leonard C. MacLean, Edward O. Thorp and William T. ZiembaFortune’s Formula, written by William Poundstone is the easier read. The second book, “The Kelly Capital Growth Investment Criterion”, that got just recently published is a much bigger workload to read. I would compare this duo of books with the twin sets of Graham’s “The Intelligent Investor” and “Security Analysis”. Whereby the “Intelligent Investor” is an easier read for the novice investor, and “Security Analysis” for the more advanced financial reader. The two available Kelly books should also be read in the same order, Poundstones book for the starter as an appetizer and William Ziemba’s book as the main and advanced course.Fortune’s Formula – web site for the book
http://www.fortunesformula.com/William Poundstone’s – homepage
http://home.williampoundstone.net/
Kelly explained @ William Poundstone’s  homepage
http://home.williampoundstone.net/Kelly/Kelly.htmlWilliam Poundstone’s page @ Amazon
http://www.amazon.com/William-Poundstone/e/B000APFI2K/ref=ntt_athr_dp_pel_1
« Last Edit: September 05, 2011, 08:28:39 PM by berkshiremystery »

Kelly criterion

From Wikipedia, the free encyclopedia

In probability theory, the Kelly criterionKelly strategy Kelly formula, or Kelly bet, is a formula used to determine the optimal size of a series of bets. In most gambling scenarios, and some investing scenarios under some simplifying assumptions, the Kelly strategy will do better than any essentially different strategy in the long run. It was described by J. L. Kelly, Jr in 1956.[1] The practical use of the formula has been demonstrated.[2][3][4]

Although the Kelly strategy’s promise of doing better than any other strategy seems compelling, some economists have argued strenuously against it, mainly because an individual’s specific investing constraints may override the desire for optimal growth rate.[5] The conventional alternative is utility theory which says bets should be sized to maximize the expected utility of the outcome (to an individual with logarithmic utility, the Kelly bet maximizes utility, so there is no conflict). Even Kelly supporters usually argue for fractional Kelly (betting a fixed fraction of the amount recommended by Kelly) for a variety of practical reasons, such as wishing to reduce volatility, or protecting against non-deterministic errors in their advantage (edge) calculations.[6]

In recent years, Kelly has become a part of mainstream investment theory[7] and the claim has been made that well-known successful investors including Warren Buffett[8] and Bill Gross[9] use Kelly methods. William Poundstone wrote an extensive popular account of the history of Kelly betting.[5] But as Kelly’s original paper demonstrates, the criterion is only valid when the investment or “game” is played many times over, with the same probability of winning or losing each time, and the same payout ratio.[1]

Statement

For simple bets with two outcomes, one involving losing the entire amount bet, and the other involving winning the bet amount multiplied by the payoff odds, the Kelly bet is:
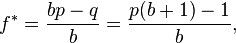
 f^{*} = \frac{bp - q}{b} = \frac{p(b + 1) - 1}{b}, \!

where:

  • f* is the fraction of the current bankroll to wager;
  • b is the net odds received on the wager (“b to 1″); that is, you could win $b (plus the $1 wagered) for a $1 bet
  • p is the probability of winning;
  • q is the probability of losing, which is 1 − p.

As an example, if a gamble has a 60% chance of winning (p = 0.60, q = 0.40), but the gambler receives 1-to-1 odds on a winning bet (b = 1), then the gambler should bet 20% of the bankroll at each opportunity (f* = 0.20), in order to maximize the long-run growth rate of the bankroll.

If the gambler has zero edge, i.e. if b = q / p, then the criterion recommends the gambler bets nothing. If the edge is negative (b < q / p) the formula gives a negative result, indicating that the gambler should take the other side of the bet. For example, in standard American roulette, the bettor is offered an even money payoff (b = 1) on red, when there are 18 red numbers and 20 non-red numbers on the wheel (p = 18/38). The Kelly bet is -1/19, meaning the gambler should bet one-nineteenth of the bankroll that red will not come up. Unfortunately, the casino doesn’t allow betting against red, so a Kelly gambler could not bet.

The top of the first fraction is the expected net winnings from a $1 bet, since the two outcomes are that you either win $b with probability p, or lose the $1 wagered, i.e. win $-1, with probability q. Hence:

 f^{*} = \frac{\text{expected net winnings}}{\text{net winnings if you win}} \!

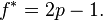
For even-money bets (i.e. when b = 1), the first formula can be simplified to:

 f^{*} = p - q . \!

Since q = 1-p, this simplifies further to

 f^{*} = 2p - 1 . \!

A more general problem relevant for investment decisions is the following:

1. The probability of success is p.

2. If you succeed, the value of your investment increases from 1 to 1+b.

3. If you fail (for which the probability is q=1-p) the value of your investment decreases from 1 to 1-a. (Note that the previous description above assumes that a is 1).

In this case, the Kelly criterion turns out to be the relatively simple expression

 f^{*} = p/a - q/b . \!

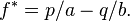
Note that this reduces to the original expression for the special case above (f^{*}=p-q) for b=a=1.

Clearly, in order to decide in favor of investing at least a small amount (f^{*}>0), you must have

 p b >  q a . \!

which obviously is nothing more than the fact that your expected profit must exceed the expected loss for the investment to make any sense.

The general result clarifies why leveraging (taking a loan to invest) decreases the optimal fraction to be invested , as in that case a>1. Obviously, no matter how large the probability of success, p, is, if a is sufficiently large, the optimal fraction to invest is zero. Thus using too much margin is not a good investment strategy, no matter how good an investor you are.

Proof

Heuristic proofs of the Kelly criterion are straightforward.[10] For a symbolic verification with Python and SymPy one would set the derivative y'(x) of the expected value of the logarithmic bankroll y(x) to 0 and solve for x:

>>> from sympy import *
>>> x,b,p = symbols('xbp')
>>> y = p*log(1+b*x) + (1-p)*log(1-x)
>>> solve(diff(y,x), x)
[-(1 - p - b*p)/b]

For a rigorous and general proof, see Kelly’s original paper[1] or some of the other references listed below. Some corrections have been published.[11]

We give the following non-rigorous argument for the case b = 1 (a 50:50 “even money” bet) to show the general idea and provide some insights.[1]

When b = 1, the Kelly bettor bets 2p – 1 times initial wealth, W, as shown above. If he wins, he has 2pW. If he loses, he has 2(1 – p)W. Suppose he makes N bets like this, and wins K of them. The order of the wins and losses doesn’t matter, he will have:

 2^Np^K(1-p)^{N-K}W \! .

Suppose another bettor bets a different amount, (2p – 1 + \Delta)W for some positive or negative \Delta. He will have (2p + \Delta)W after a win and [2(1 – p)- \Delta]W after a loss. After the same wins and losses as the Kelly bettor, he will have:

 (2p+\Delta)^K[2(1-p)-\Delta]^{N-K}W \!

Take the derivative of this with respect to \Delta and get:

 K(2p+\Delta)^{K-1}[2(1-p)-\Delta]^{N-K}W-(N-K)(2p+\Delta)^K[2(1-p)-\Delta]^{N-K-1}W\!

The turning point of the original function occurs when this derivative equals zero, which occurs at:

 K[2(1-p)-\Delta]=(N-K)(2p+\Delta) \!

which implies:

 \Delta=2(\frac{K}{N}-p) \!

but:

 \lim_{N \to +\infty}\frac{K}{N}=p \!

so in the long run, final wealth is maximized by setting \Delta to zero, which means following the Kelly strategy.

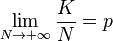
This illustrates that Kelly has both a deterministic and a stochastic component. If one knows K and N and wishes to pick a constant fraction of wealth to bet each time (otherwise one could cheat and, for example, bet zero after the Kth win knowing that the rest of the bets will lose), one will end up with the most money if one bets:

 \left(2\frac{K}{N}-1\right)W \!

each time. This is true whether N is small or large. The “long run” part of Kelly is necessary because K is not known in advance, just that as N gets large, K will approach pN. Someone who bets more than Kelly can do better if K > pN for a stretch; someone who bets less than Kelly can do better if K < pN for a stretch, but in the long run, Kelly always wins.

The heuristic proof for the general case proceeds as follows.[citation needed]

In a single trial, if you invest the fraction f of your capital, if your strategy succeeds, your capital at the end of the trial increases by the factor 1-f + f(1+b) = 1+fb, and, likewise, if the strategy fails, you end up having your capital decreased by the factor 1-fa. Thus at the end of N trials (with pN successes and qN failures ), the starting capital of $1 yields

C_N=(1+fb)^{pN}(1-fa)^{qN}.

Maximizing \log(C_N)/N, and consequently C_N, with respect to f leads to the desired result

f^{*}=p/a-q/b .

For a more detailed discussion of this formula for the general case, see http://www.bjmath.com/bjmath/thorp/ch2.pdf.

Reasons to bet less than Kelly

A natural assumption is that taking more risk increases the probability of both very good and very bad outcomes. One of the most important ideas in Kelly is that betting more than the Kelly amount decreases the probability of very good results, while still increasing the probability of very bad results. Since in reality we seldom know the precise probabilities and payoffs, and since overbetting is worse than underbetting, it makes sense to err on the side of caution and bet less than the Kelly amount.

Kelly assumes sequential bets that are independent (later work generalizes to bets that have sufficient independence). That may be a good model for some gambling games, but generally does not apply in investing and other forms of risk-taking.

The Kelly property appears “in the long run” (that is, it is an asymptotic property). To a person, it matters whether the property emerges over a small number or a large number of bets. It makes sense to consider not just the long run, but where losing a bet might leave one in the short and medium term as well. A related point is that Kelly assumes the only important thing is long-term wealth. Most people also care about the path to get there. Kelly betting leads to highly volatile short-term outcomes which many people find unpleasant, even if they believe they will do well in the end.

The criterion assumes you know the true value of p, the probability of the winning. The formula tells you to bet a positive amount if p is greater than 1/(b+1). In many situations you cannot be sure p is the true probability. For example if you are told there are just 100 tickets ($1 each) to a raffle, and the prize for winning is $110, then Kelly will tell you to bet a positive fraction of your bank. However, if the information of “100 tickets” was a lie or mis-estimate, and if the true number of tickets was 120, then any bet needs to be avoided. Your optimal investement strategy will need to consider the statistical distribution for your estimate for p.

Bernoulli

In a 1738 article, Daniel Bernoulli suggested that when one has a choice of bets or investments that one should choose that with the highest geometric mean of outcomes. This is mathematically equivalent to the Kelly criterion[citation needed], although the motivation is entirely different (Bernoulli wanted to resolve the St. Petersburg paradox). The Bernoulli article was not translated into English until 1956,[12] but the work was well-known among mathematicians and economists.

Many horses[edit]

Kelly’s criterion may be generalized [13] on gambling on many mutually exclusive outcomes, like in horse races. Suppose there are several mutually exclusive outcomes. The probability that the k-th horse wins the race is p_k, the total amount of bets placed on k-th horse is B_k, and

\beta_k=\frac{B_k}{\sum_i B_i}=\frac{1}{1+Q_k} ,

where Q_k are the pay-off odds. D=1-tt, is the dividend rate where tt is the track take or tax, \frac{D}{\beta_k} is the revenue rate after deduction of the track take when k-th horse wins. The fraction of the bettor’s funds to bet on k-th horse is f_k. Kelly’s criterion for gambling with multiple mutually exclusive outcomes gives an algorithm for finding the optimal set S^o of outcomes on which it is reasonable to bet and it gives explicit formula for finding the optimal fractions f^o_k of bettor’s wealth to be bet on the outcomes included in the optimal set S^o. The algorithm for the optimal set of outcomes consists of four steps.[13]

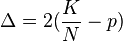
Step 1 Calculate the expected revenue rate for all possible (or only for several of the most promising) outcomes: er_k=\frac{D}{\beta_k}p_k=D(1+Q_k)p_k.

Step 2 Reorder the outcomes so that the new sequence er_k is non-increasing. Thus er_1 will be the best bet.

Step 3 Set  S = \varnothing  (the empty set), k = 1R(S)=1. Thus the best bet er_k = er_1 will be considered first.

Step 4 Repeat:

If er_k=\frac{D}{\beta_k}p_k > R(S) 
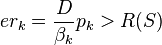
then insert k-th outcome into the set:
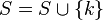
 S = S \cup \{k\}, recalculate R(S) according to the formula:
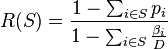
 R(S)=\frac{1-\sum_{i \in S}{p_i}}{1-\sum_{i \in S } \frac{\beta_i}{D}} and then set k = k+1 ,

Else set S^o=S and then stop the repetition.

If the optimal set S^o is empty then do not bet at all. If the set S^o of optimal outcomes is not empty then the optimal fraction f^o_k to bet on k-th outcome may be calculated from this formula: f^o_k=\frac{er_k - R(S^o)}{\frac{D}{\beta_k}}=p_k-\frac{R(S^o)}{\frac{D}{\beta_k}}.

One may prove[13] that

R(S^o)=1-\sum_{i \in S^o}{f^o_i}

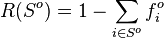
where the right hand-side is the reserve rate[clarification needed]. Therefore the requirement er_k=\frac{D}{\beta_k}p_k > R(S) may be interpreted[13] as follows: k-th outcome is included in the set S^o of optimal outcomes if and only if its expected revenue rate is greater than the reserve rate. The formula for the optimal fraction f^o_k may be interpreted as the excess of the expected revenue rate of k-th horse over the reserve rate divided by the revenue after deduction of the track take when k-th horse wins or as the excess of the probability of k-th horse winning over the reserve rate divided by revenue after deduction of the track take when k-th horse wins. The binary growth exponent is

G^o=\sum_{i \in S}{p_i\log_2{(er_i)}}+(1-\sum_{i \in S}{p_i})\log_2{(R(S^o))} ,

and the doubling time is

T_d=\frac{1}{G^o}.

This method of selection of optimal bets may be applied also when probabilities p_k are known only for several most promising outcomes, while the remaining outcomes have no chance to win. In this case it must be that \sum_i{p_i} < 1 and \sum_i{\beta_i} < 1.

Application to the stock market

Consider a market with n correlated stocks S_k with stochastic returns r_kk= 1,...,n and a riskless bond with return r. An investor puts a fraction u_k of his capital in S_k and the rest is invested in bond. Without loss of generality assume that investor’s starting capital is equal to 1. According to Kelly criterion one should maximize \mathbb{E}\left[ \ln\left((1 + r) + \sum\limits_{k=1}^n  u_k(r_k -r) \right) \right]
Expanding it to the Taylor series around \vec{u_0} = (0, \ldots ,0) we obtain
\mathbb{E} \left[ \ln(1+r) + \sum\limits_{k=1}^{n} \frac{u_k(r_k - r)}{1+r} -<br /><br /><br /><br /><br /><br /><br />
\frac{1}{2}\sum\limits_{k=1}^{n}\sum\limits_{j=1}^{n} u_k u_j \frac{(r_k<br /><br /><br /><br /><br /><br /><br />
-r)(r_j - r)}{(1+r)^2} \right]
Thus we reduce the optimization problem to the Quadratic programming and the unconstrained solution is <br /><br /><br /><br /><br /><br /><br />
\vec{u^{\star}} = (1+r) (  \widehat{\Sigma} )^{-1} ( \widehat{\vec{r}}  )<br /><br /><br /><br /><br /><br /><br />
where \widehat{\vec{r}} and \widehat{\Sigma} are the vector of means and the matrix of second mixed noncentral moments of the excess returns.[14] There are also numerical algorithms for the fractional Kelly strategies and for the optimal solution under no leverage and no short selling constraints.

See also[edit]

References

  1. a b c d Kelly, J. L., Jr. (1956), “A New Interpretation of Information Rate”Bell System Technical Journal 35: 917–926
  2. ^ Thorp, E. O. (January 1961), “Fortune’s Formula: The Game of Blackjack”, American Mathematical Society
  3. ^ Thorp, E. O. (1962), Beat the dealer: a winning strategy for the game of twenty-one. A scientific analysis of the world-wide game known variously as blackjack, twenty-one, vingt-et-un, pontoon or Van John, Blaisdell Pub. Co
  4. ^ Thorp, Edward O.; Kassouf, Sheen T. (1967), Beat the Market: A Scientific Stock Market System, Random House, ISBN 0-394-42439-5[page needed]
  5. a b Poundstone, William (2005), Fortune’s Formula: The Untold Story of the Scientific Betting System That Beat the Casinos and Wall Street, New York: Hill and Wang, ISBN 0-8090-4637-7
  6. ^ Thorp, E. O. (May 2008), “The Kelly Criterion: Part I”, Wilmott Magazine
  7. ^ Zenios, S. A.; Ziemba, W. T. (2006), Handbook of Asset and Liability Management, North Holland, ISBN 978-0-444-50875-1
  8. ^ Pabrai, Mohnish (2007), The Dhandho Investor: The Low-Risk Value Method to High Returns, Wiley, ISBN 978-0-470-04389-9
  9. ^ Thorp, E. O. (September 2008), “The Kelly Criterion: Part II”, Wilmott Magazine
  10. ^ Press, WH; Teukolsky, SA; Vetterling, WT; Flannery, BP (2007), “Section 14.7 (Example 2.)”Numerical Recipes: The Art of Scientific Computing (3rd ed.), New York: Cambridge University Press, ISBN 978-0-521-88068-8
  11. ^ Breiman, L. (1961) “Optimal Gambling Systems for Favorable Games”Proc. Fourth Berkeley Symp. on Math. Statist. and Prob., Vol. 1 (Univ. of Calif. Press), 65-78. MR0135630
  12. ^ Bernoulli, Daniel (1956) [1738], “Exposition of a New Theory on the Measurement of Risk”, Econometrica (The Econometric Society) 22 (1): 22–36, JSTOR 1909829
  13. a b c d Smoczynski, Peter; Tomkins, Dave (2010) “An explicit solution to the problem of optimizing the allocations of a bettor’s wealth when wagering on horse races”, Mathematical Scientist”, 35 (1), 10-17
  14. ^ Nekrasov, Vasily(2013) “Kelly Criterion for Multivariate Portfolios: A Model-Free Approach”

Please Ignore Any Emails from Aldridge56@aol.com (HACKED)

Dear Readers:


I am working on fixing the problem. Please ignore the bogus email (asking for money).

I am sorry for the abuse.

my new email is jac007csi@gmail.com

Cisco (CSCO) Case Study; The Lord of Dark Matter

SLAP

Next the statesmen will invent cheap lies, putting the blame upon the nation that is attacked (Syria), and every man will be glad of those conscience-soothing falsities, and will diligently study them, and refuse to examine any refutation of them; and thus he will by and by convince himself that the war is just, and will thank God for the better sleep he enjoys after this process of grotesque self-deception.” –Mark Twain

“When the rich make war, it is the poor that die.”–Jean-Paul Sartre

Case Study of Cisco:

CSCO Chart

Case Study on Cisco Third Quarterly Earnings  (includes 2012 for comparison purposes).  Instructions and questions in the document.

CSCO_VL   (for reference) CSCO March 2013 Qtr Report

Please explain what you see.

The Lord of Dark Matter

Fleckenstein:  “Probably anyone who listens to your wonderful interviews already understands that money printing can’t solve anything … Most recently the housing bubble led to the collapse in 2008/2009, and now we’ve got QE of biblical proportions being foisted upon us by the Fed, BOJ (Bank of Japan), Swiss National Bank, and probably the BOE (Bank of England) soon, etc.

The irony of it all is that 5 years into zero rates, and America alone (with) $5 or $6 trillion of deficit spending, the economy is still crummy.  No one ever says, ‘Why is that?’  Well, the reason is because money printing doesn’t work.”

….Everybody and his brother is bearish.  I get sent two articles a day about some knucklehead who’s bearish on gold.  Well, you know what?  They are all bearish for the same two reasons:  The chart looks bad, and the price is wrong.  Like they know what the price (should be).  How do any of us know what the price is supposed to be?  It’s just a price.

Click the link below to hear the twelve-minute interview:

http://www.kingworldnews.com/kingworldnews/Broadcast/Entries/2013/6/6_Bill_Fleckenstein.html

HUI CHART

Serial Bubbles: 

http://www.zerohedge.com/news/2013-06-06/why-serial-asset-bubbles-are-now-new-normal


P.S. I have been a bit swamped with work, so I will post next week. Be well and BE CAREFUL!