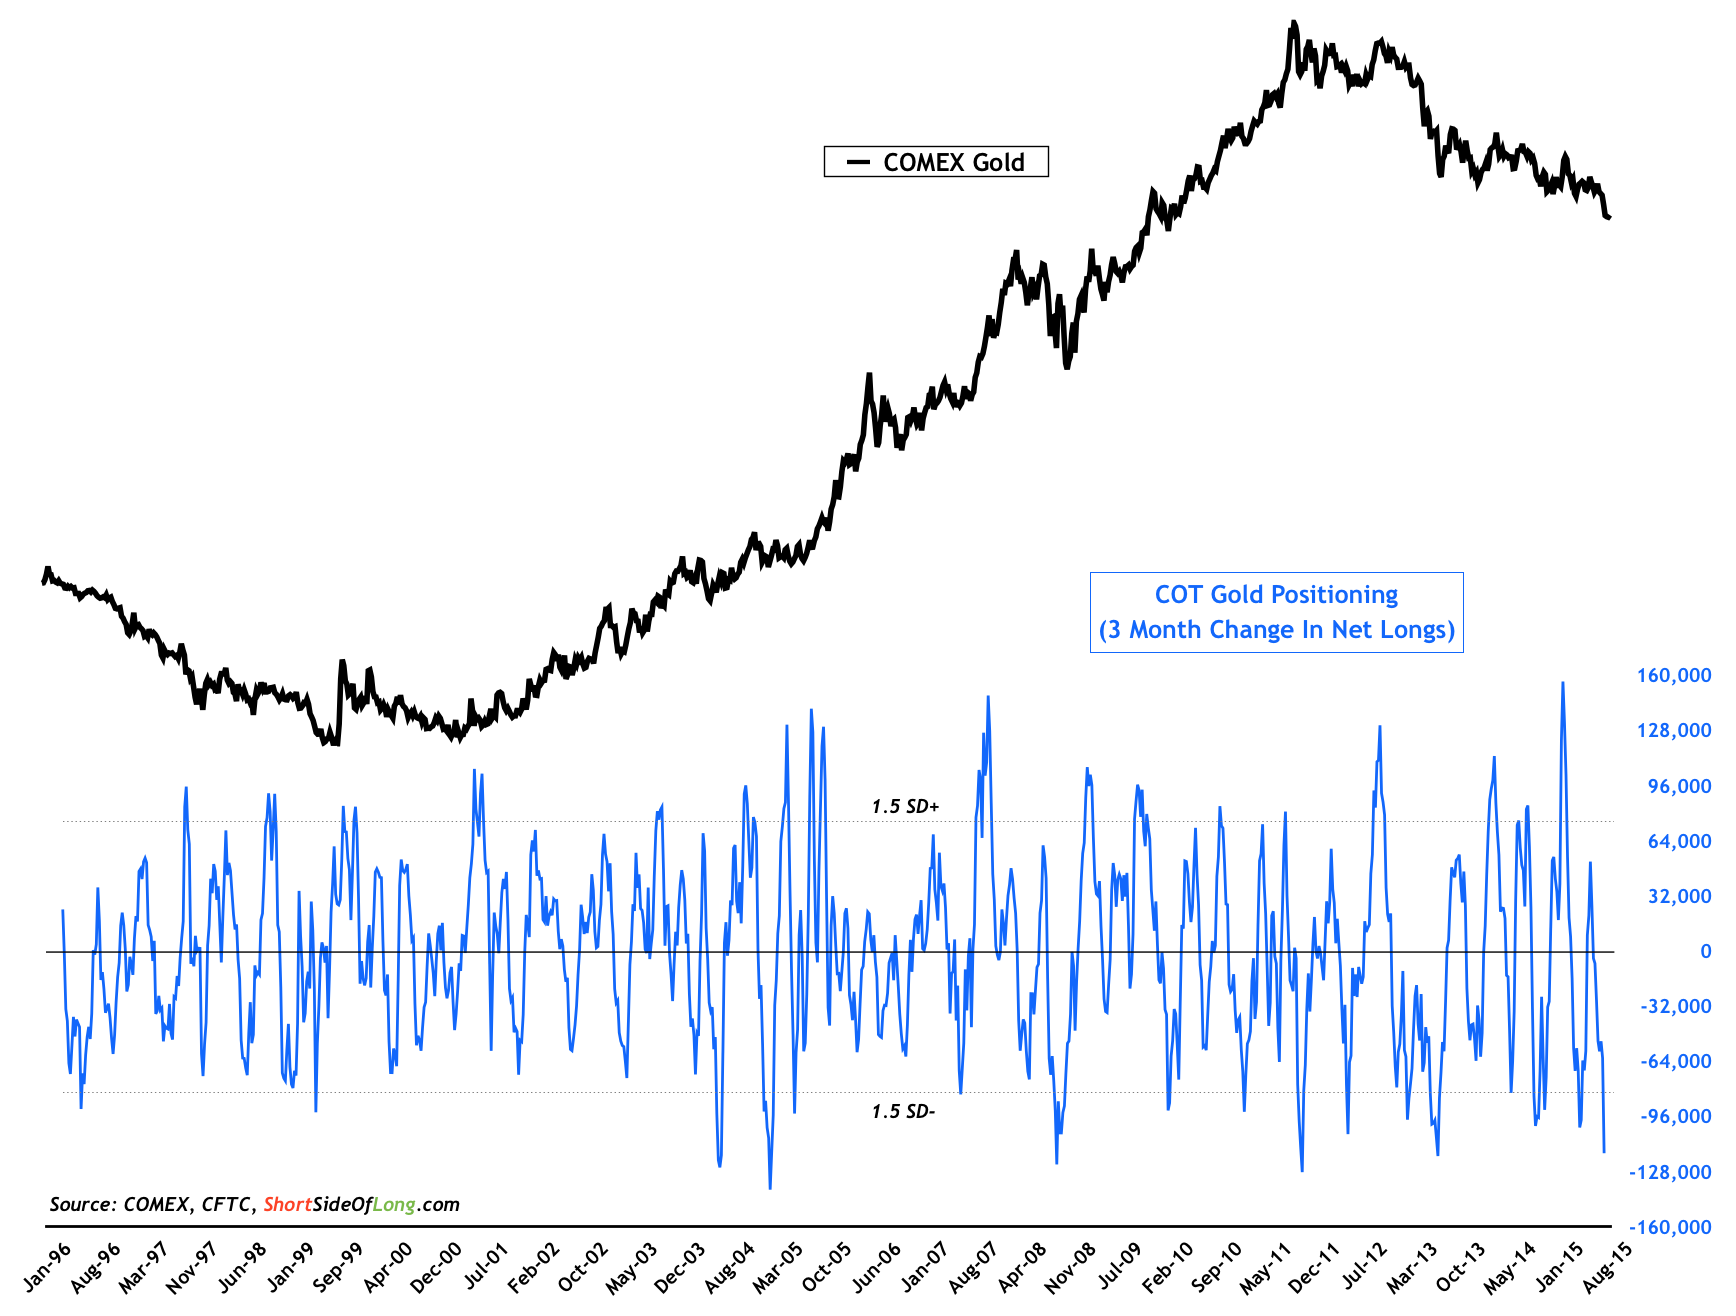
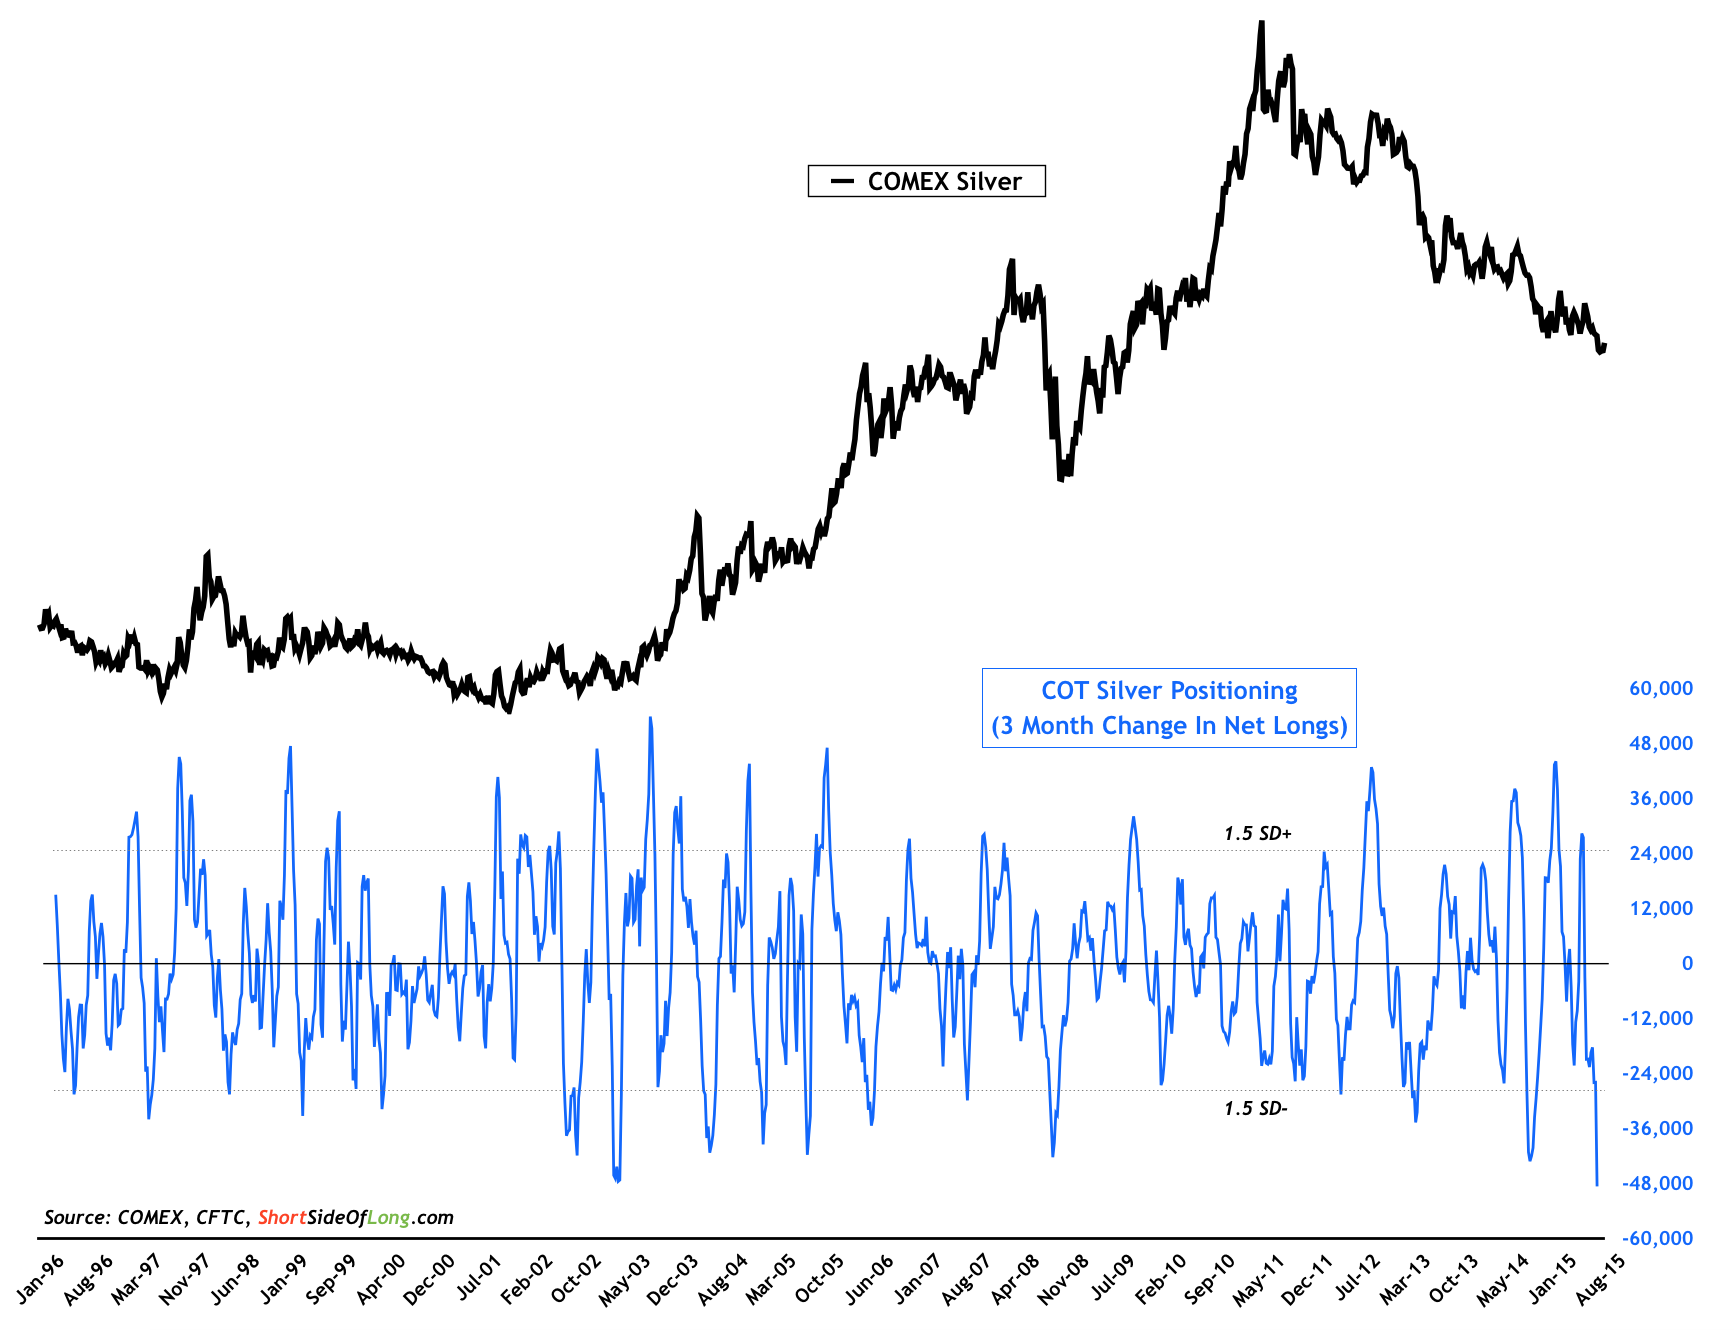
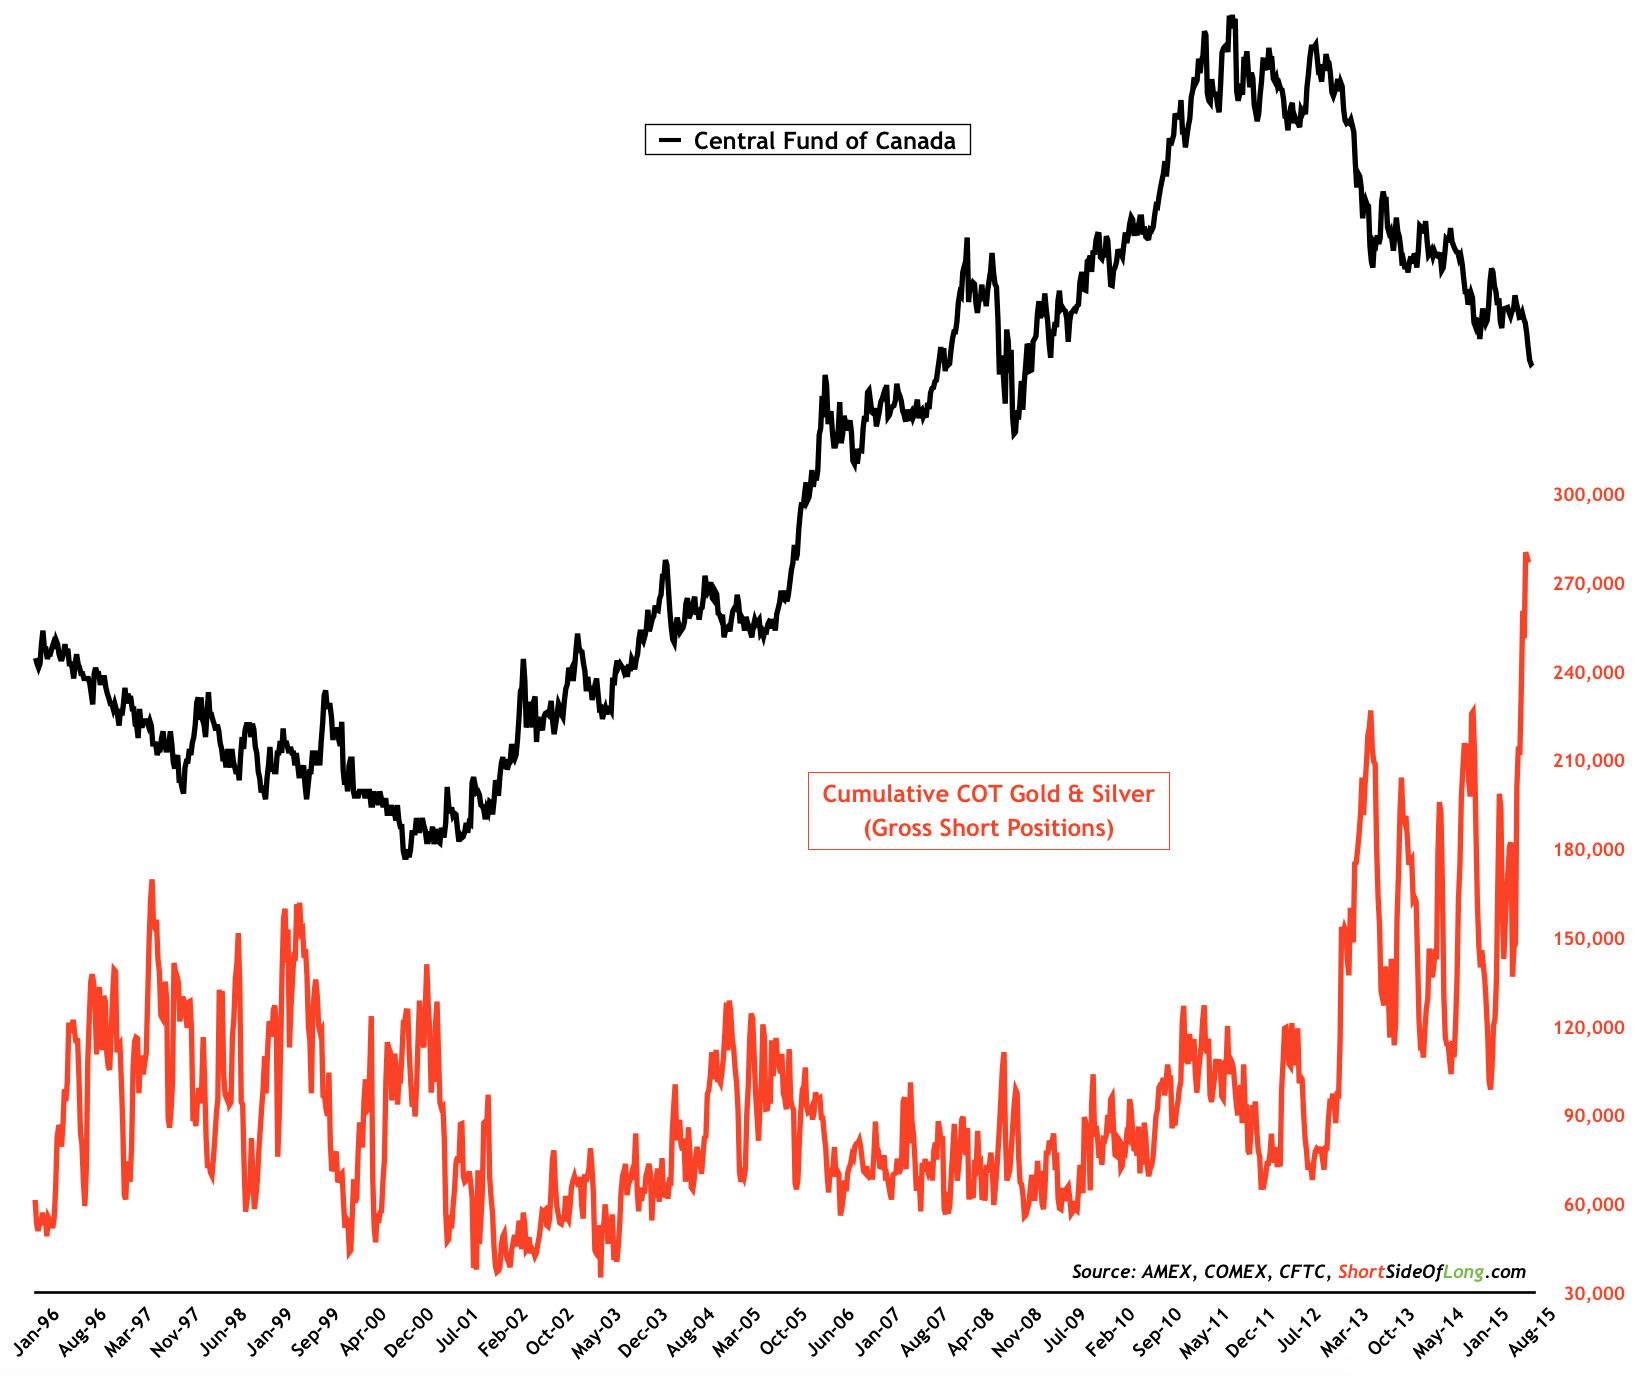
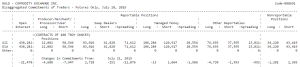
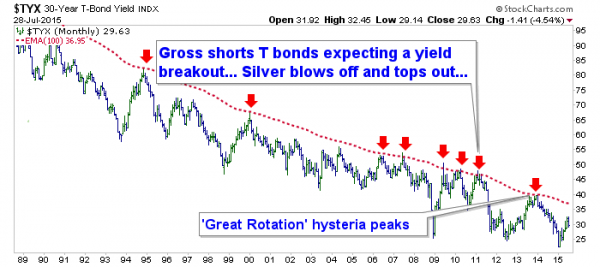
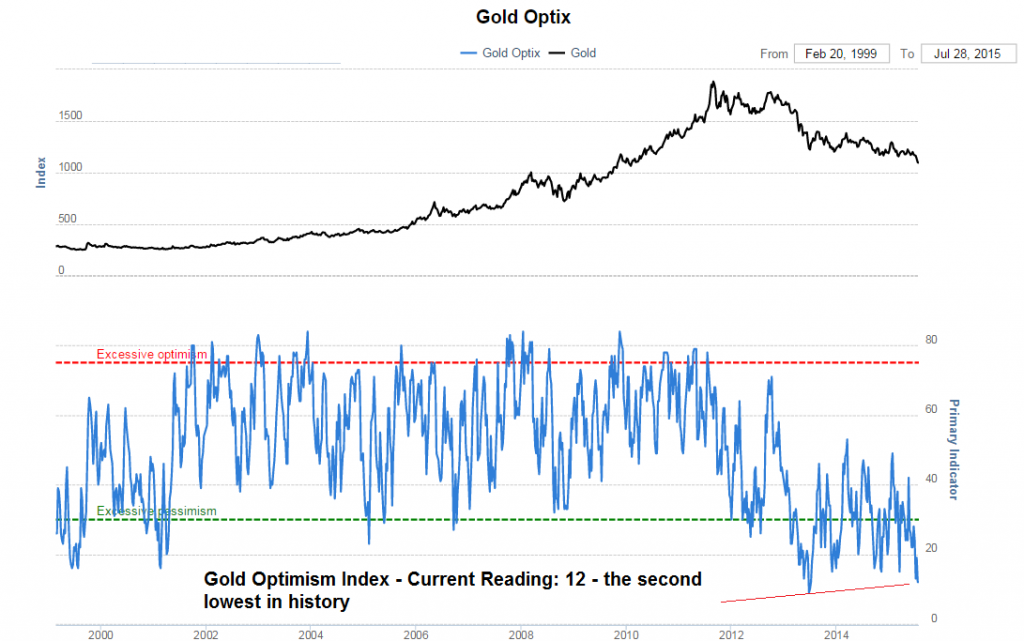
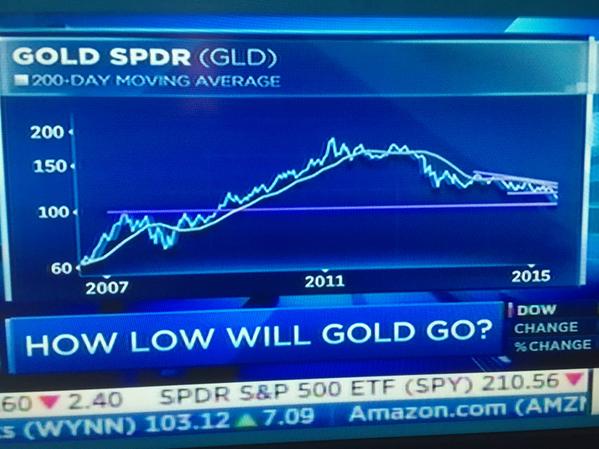
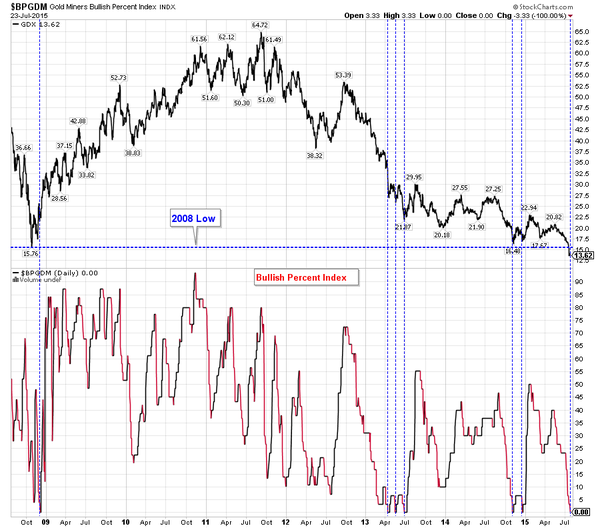
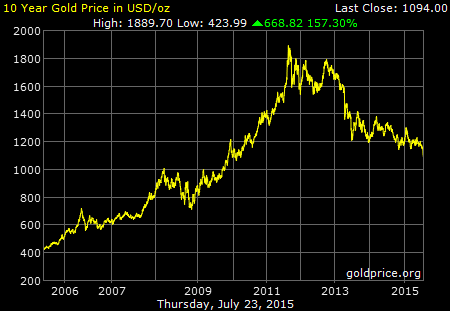
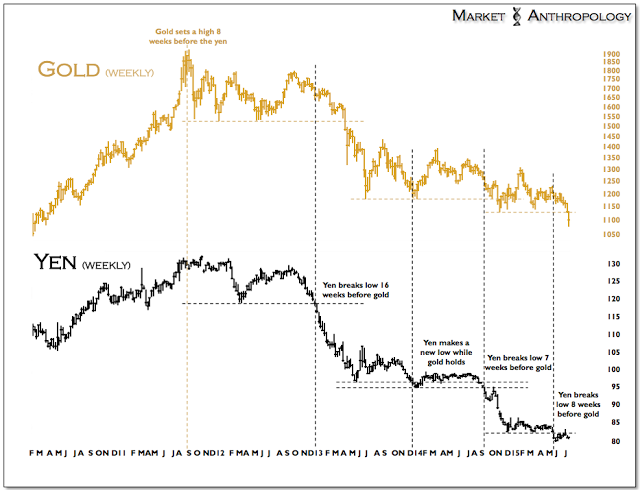
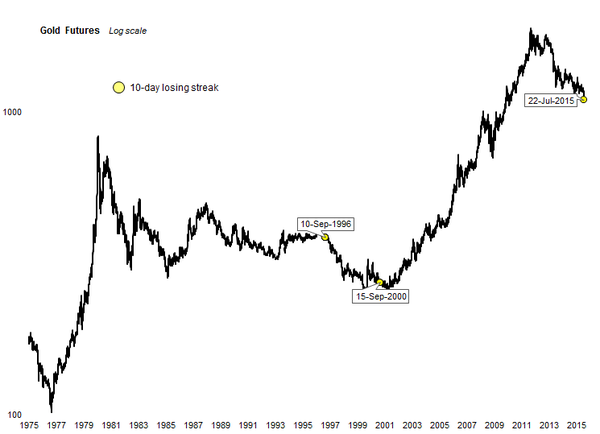
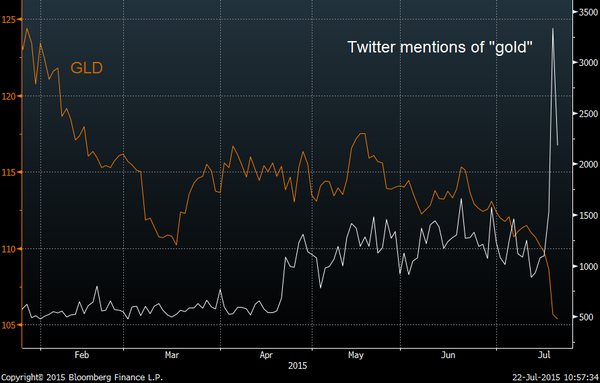
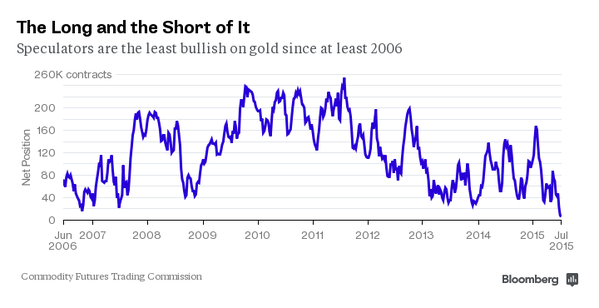
The above charts show the massive swing in sentiment as speculators moved from long to short expecting gold to fall INEVITABLY to $1,000 or so the pundits say:
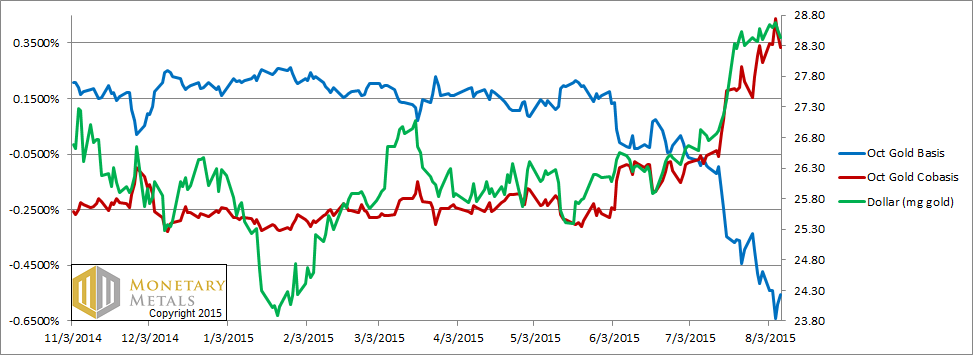
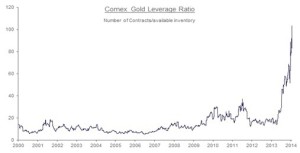
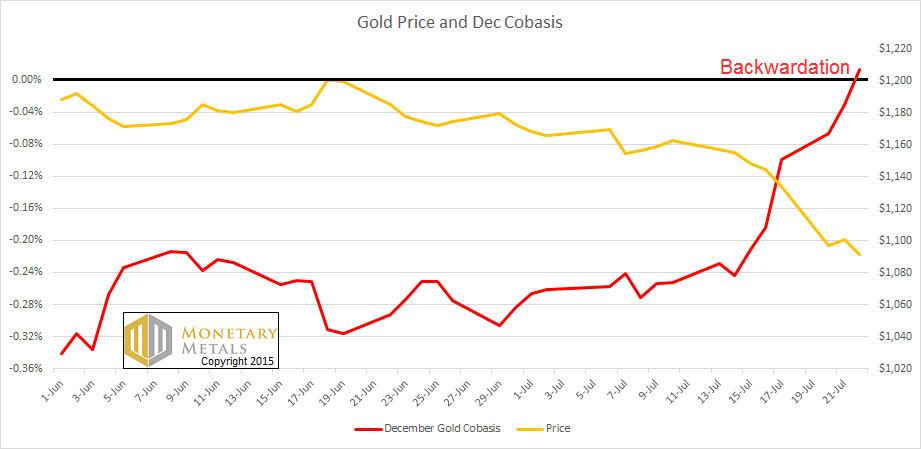
Demand for gold bullion remains stronger than the supply offered through the futures market–the co-basis is rising:
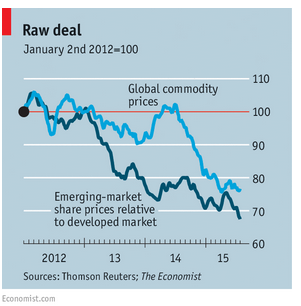
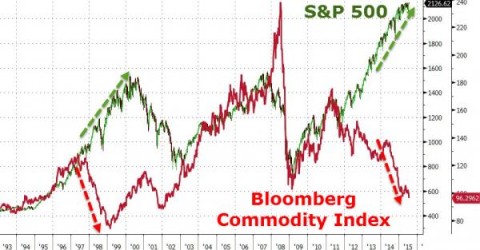
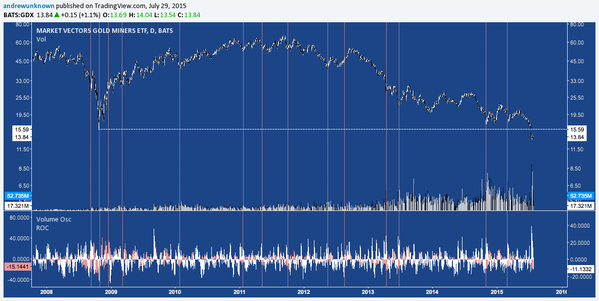
Meanwhile, could divergences be developing in miners vs. gold? Note prior bottoms in 1986 (bear market rally) and 2000, the beginning of a major rally.
http://thefelderreport.com/2015/07/21/its-time-to-get-greedy-in-the-gold-market/John Chew: Don’t ever just concentrate in one gold stock since the company and operational risks can be high. SDGJ by Sprott offers diversification and sensible companies. Sprott Junior ETF Mining. Why even consider investing in such a bad industry? Because of price and the counter-cyclical nature of these stocks. You buy when the industry is losing money and hated and sell when the pundits recommend it and the trend is forever extrapolated higher. There is no law that miners won’t go lower; miners are extremely volatile moving up and down 10% in one day.
What Happens When You Buy Assets Down 80%? farber
We’ve done a lot of articles on value and drawdowns on the blog before (search the archives). I was curious what happens when you bought the US equity sectors back when they were really hammered (French Fama to 1920s).
Average 3 year nominal returns when buying a sector down since 1920s:
60% = 57%
70% = 87%
80% = 172%
90% = 240% The average of 80% to 90% down is a triple.
Average 3 year nominal returns when buying an industry down since 1920s:
60% = 71%
70% = 96%
80% = 136%
90% = 115%
Average 3 year nominal returns when buying a country down since 1970s:
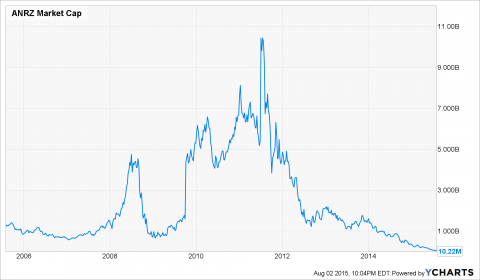
If you want a cogent metaphor for the central bank enabled crack-up boom now underway on a global basis, look no further than today’s scheduled chapter 11 filling of met coal supplier Alpha Natural Resources (ANRZ). After becoming a public company in 2005, its market cap soared from practically nothing to $11 billion exactly four years ago. Now it’s back at the zero bound.
This article by David Stockman perfectly illustrates that capital DESTRUCTION or mal-investment occurs DURING the boom phase. The bust which is what Alpha and the entire coal industry are going through creates the healing process as assets are redeployed to their higher uses and supply is re-balanced to meet changed demand.
From 2006 to today during the greatest coal boom in history, Alpha has lost almost $5 billion for its shareholders. At the peak of its earnings, the market cap (not including debt) traded at 25 times and during the insanity at over 50 times. Investors were destroying their capital and the company was mis-allocating its shareholder’s capital DURING the boom phase. Now is the cleansing process. Ditto for many coal companies. So ask yourself why do reasonably intelligent management teams and Board of Directors make such a CLUSTER of errors and why do investors pay stupid multiples on peak earnings? A combination of central bank distortion and psychology and momentum chasing?
Yes, bankruptcies happen, and this is most surely a case of horrendous mismanagement. But the mismanagement at issue is that of the world’s central bank cartel.
The latter have insured that there will be thousands of such filings in the years ahead because since the mid-1990s the central banks has engulfed the global economy in an unsustainable credit based spending boom, while utterly disabling and falsifying the financial system that is supposed to price assets honestly, allocate capital efficiently and keep risk and greed in check.
Accordingly, the ANRZ stock bubble depicted above does not merely show that the boys, girls and robo-traders in the casino got way too rambunctious chasing the “BRICs will grow to the sky” tommyrot fed to them by Goldman Sachs. What was actually happening is that the central banks were feeding the world economy with so much phony liquidity and dirt cheap capital that for a time the physical economy seemed to be doing a veritable jack-and-the-beanstalk number.
In fact, the central banks generated a double-pumped boom——first in the form of a credit-fueled consumption spree in the DM economies that energized the great export machine of China and its satellite suppliers; and then after the DM consumption boom crashed in 2008-2009 and threatened to bring the export-mercantilism of China’s red capitalism crashing down on Beijing’s rulers, the PBOC unleashed an even more fantastic investment and infrastructure boom in China and the rest of the EM.
During the interval between 1992 and 1994 the world’s monetary system—–which had grown increasingly unstable since the destruction of Bretton Woods in 1971——took a decided turn for the worst. This was fueled by the bailout of the Wall Street banks during the Mexican peso crisis; Mr. Deng’s ignition of export mercantilism in China and his discovery that communist party power could better by maintained from the end of the central bank’s printing presses, rather than Mao’s proverbial gun; and Alan Greenspan’s 1994 panic when the bond vigilante’s dumped over-valued government bonds after the Fed finally let money market rates rise from the ridiculously low level where Greenspan had pegged them in the interest of re-electing George Bush Sr. in 1992.
From that inflection point onward, the global central banks were off to the races and what can only be described as a credit supernova exploded throughout the warp and woof of the world’s economy. To wit, there was about $40 trillion of debt outstanding in the worldwide economy during 1994, but this figure reached $85 trillion by the year 2000, and then erupted to $200 trillion by 2014. That is, in hardly two decades the world debt increased by 5X.
To be sure, in the interim a lot of phony GDP was created in the world economy. This came first in the credit-bloated housing and commercial real estate sectors of the DM economies through 2008; and then in the explosion of infrastructure and industrial asset investment in the EM world in the aftermath of the financial crisis and Great Recession. But even then, the growth of unsustainable debt fueled GDP was no match for the tsunami of debt itself.
At the 1994 inflection point, world GDP was about $25 trillion and its nominal value today is in the range of $70 trillion—-including the last gasp of credit fueled spending (fixed asset investment) that continues to deliver iron ore mines, container ships, earth-movers, utility power plants, deep sea drilling platforms and Chinese airports, highways and high rises which have negligible economic value. Still, even counting all the capital assets which were artificially delivered to the spending (GDP) accounts, and which will eventually be written-down or liquidated on balance sheets, GDP grew by only $45 trillion in the last two decades or by just 28% of the $160 trillion debt supernova.
Here is what sound money men have known for decades, if not centuries. Namely, that this kind of runaway credit growth feeds on itself by creating bloated, artificial demand for materials and industrial commodities that, in turn, generate shortages of capital assets like mines, ships, smelters, factories, ports and warehouses that require even more materials to construct. In a word, massive artificial credit sets the world digging, building, constructing, investing and gambling like there is no tomorrow.
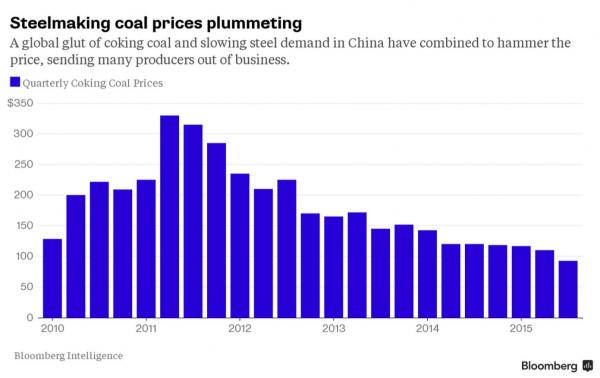
In the case of Alpha Natural Resources, for example, the bloated demand for material took the form of met coal. And the price trend shown below is not at all surprising in light of what happened to steel capacity in China alone. At the 1994 inflection point met coal sold for about $35/ton, but at that point the Chinese steel industry amounted to only 100 million tons. By the time of the met coal peak in 2011, the Chinese industry was 11X larger and met coal prices had soared ten-fold to $340 per ton.
And here is where the self-feeding dynamic comes in. That is, how we get monumental waste and malinvestment from a credit boom. In a word, the initial explosion of demand for commodities generates capacity shortages and therefore soaring windfall profits on in-place capacity and resource reserves in the ground.
These false profits, in turn, lead speculators to believe that what are actually destructive and temporary economic rents represents permanent value streams that can be capitalized by equity owners.
—
Jeremy Grantham points out the unusual increase in China’s coal demand:
After every historical major rally in commodity prices, there has been the predictable reaction whereby capacity is increased. Given the uncertainties of guessing other firms’ expansion plans, the usual result is a period of excess capacity and weaker prices as everyone expands simultaneously. The 2000 to 2008 price rally was the biggest in history, above even World War II. It was therefore not surprising that the reflex this time was the mother of all expansions and excess capacity. This was further exaggerated by a sustained slowdown in demand from China, which is still playing through. The most dramatic example of this was in China’s use of coal, which had grown from 4% of world use in 1970 to 8% in 1988 and to 50% in 2013, the world’s most remarkable expansion in the use of anything since time began. And yet this remarkable surge was followed in 2014 by a reduction in China’s use of coal! And that in a year in which China was still growing at over 6%. See:price-insensitive-sellers-and-ten-quick-topics-to-ruin-your-summer
—
Continued…..But as shown below, eventually the credit bubble stops growing, materials demand flattens-out and begins to rollover, thereby causing windfall prices and profits to disappear. This happens slowly at first and then with a rush toward the drain.
ANRZ is thus rushing toward the drain because it got capitalized as if the insanely uneconomic met coal prices of 2011 would be permanent.
Needless to say, an honest equity market would never have mistaken the peak met coal price of $340/ton in early 2011 as indicative of the true economics of coking coal. After all, freshman engineering students know that the planet is blessed (cursed?) with virtually endless coal reserves including grades suitable for coking.
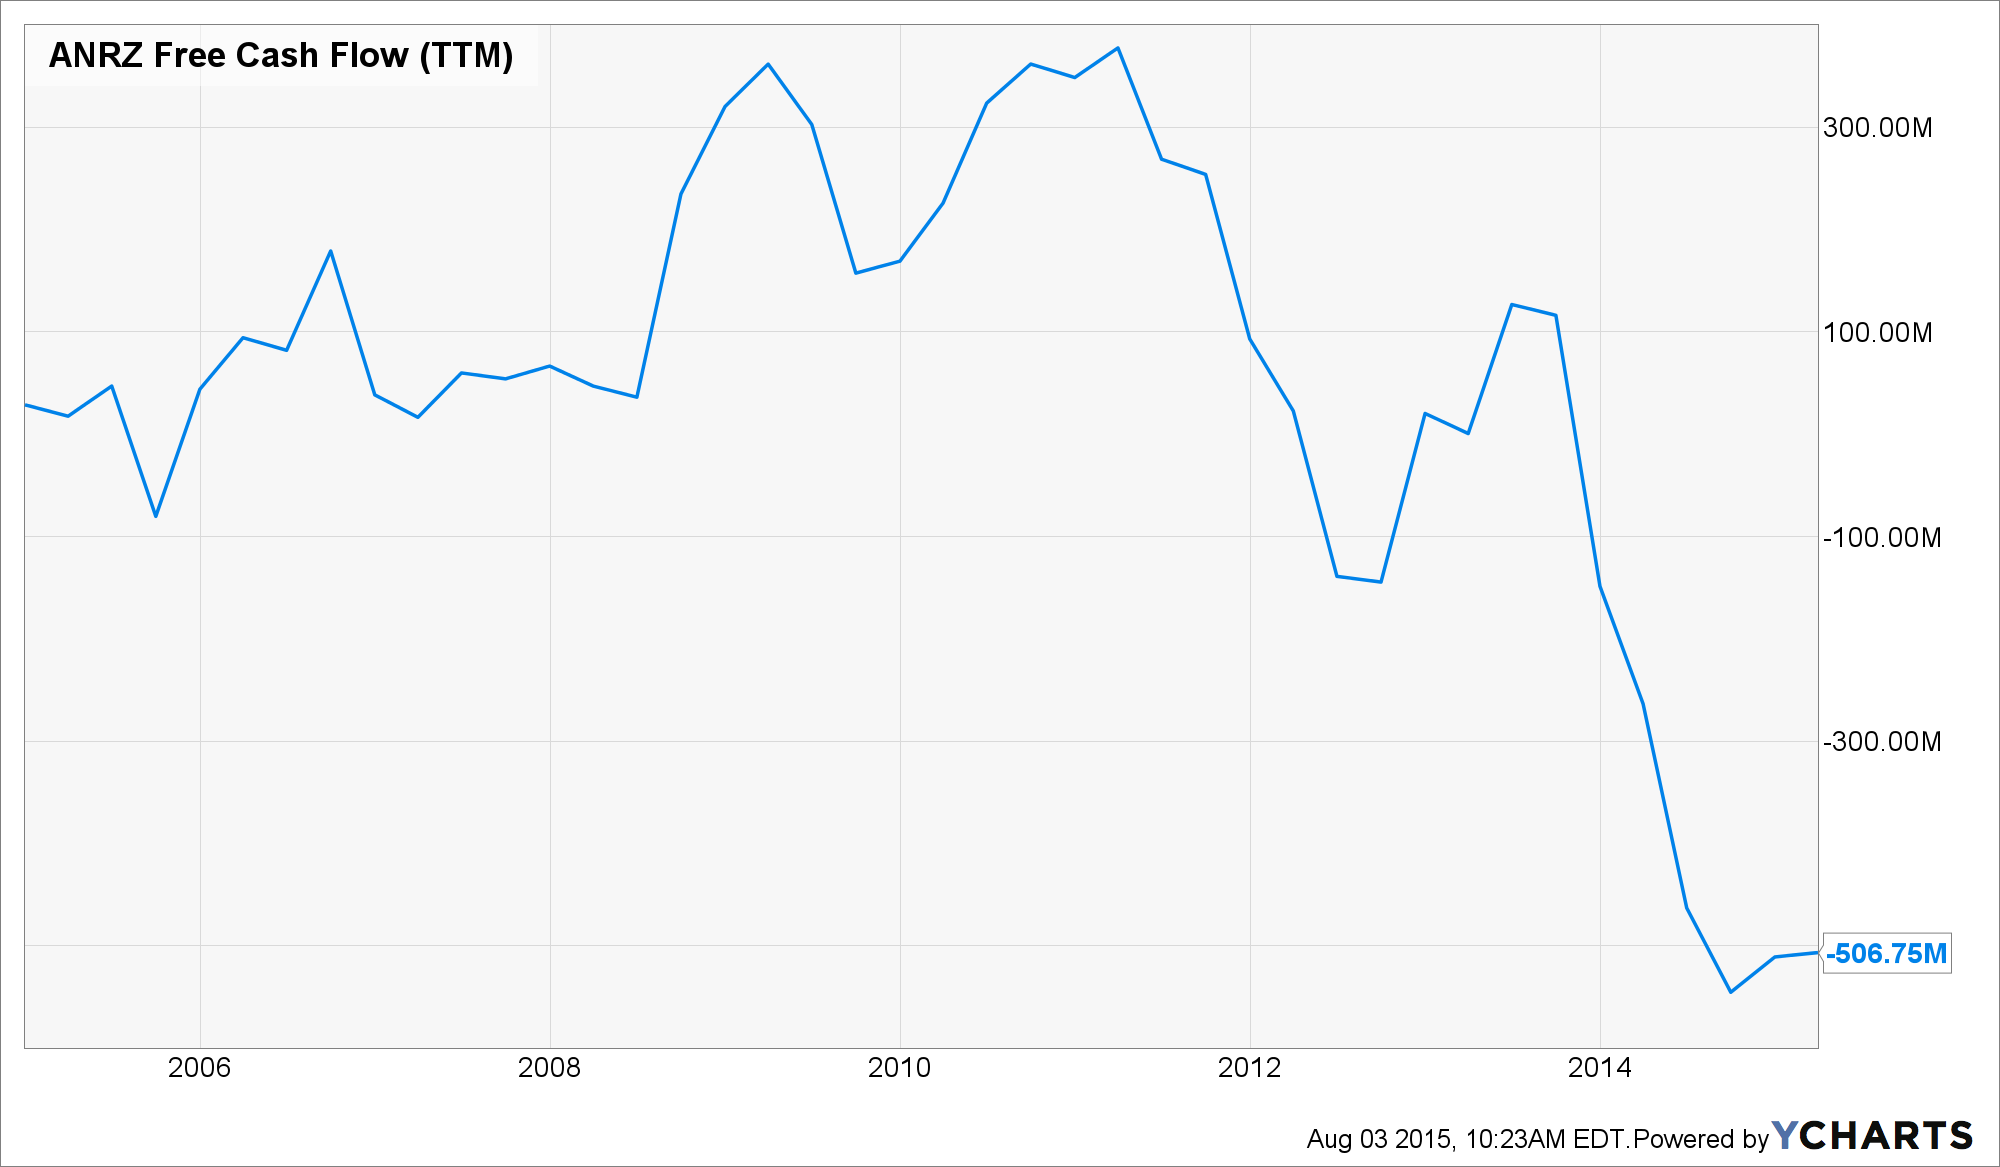
Yet in markets completely broken and falsified by central bank manipulation and repression, the fast money traders know nothing accept the short-run “price action” and chart points. In the case of ANZR, this led its peak free cash flow of $380 million in early 2011 to be valued at 29X.
Self-evidently, a company that had averaged $50 to $75 million of free cash flow in the already booming met coal market of 2005-2008 was hardly worth $1 billion. The subsequent surge of free cash flow was nothing more than windfall rents on ANZR’s existing reserves, and, accordingly, merited no increase in its market capitalization or trading multiple at all.
In fact, even superficial knowledge of the met coal supply curve and production economics at the time would have established that even prices of $100 per ton would be hard to sustain after the long-term capacity expansion than underway came to fruition.
This means that ANRZ’s sustainable free cash flow never exceeded about $80 million, and that at its peak 2011 capitalization of $11 billion it was being traded at 140X. In a word, that’s how falsified markets go completely haywire in a central bank driven credit boom.
As it happened, the full ANZR story is far worse. During the last 10 years it generated $3.2 billion in cash flow from operations——including the peak cycle profit windfalls embedded in its reported results. Yet it spent $5 billion on CapEx and acquisitions during the same period, while spending nearly another $750 million that it didn’t have on stock buybacks and dividends.
Yes, it was the magic elixir of debt that made ends appear to meet in its financial statements. Needless to say, the climb of its debt from $635 million in 2005 to $3.3 billion presently was reported in plain sight and made no sense whatsoever for a company dependent upon the volatile margins and cash flows inherent in the global met coal trade.
So when we insist that markets are broken and the equities have been consigned to the gambling casinos, look no farther than today’s filing by Alpha Natural Resources.
Markets which were this wrong on a prominent name like ANRZ at the center of the global credit boom did not make a one-time mistake; they are the mistake.
As it now happens, the global credit boom is over; DM consumers are stranded at peak debt; and the China/EM investment frenzy is winding down rapidly.
Now comes the tidal wave of global deflation. The $11 billion of bottled air that disappeared from the Wall Street casino this morning is just the poster boy—–the foreshock of the thundering collapse of inflated asset values the lies ahead. See: Pop Goes the Alpha Bubble.
So I have bought coal companies like FELP, CLD, HNRG, BTU because IF there exists a coal industry, the best reserves, lowest costs, and well-capitalized companies should thrive on the other side of this HEALTHY bust. Yes, BTU does have a heavy balance sheet but it does have world-class reserves, operations and low-cost structure. However, Austrian economics teaches that the bigger the boom, the greater the bust. The TIME and DEPTH of the depression in coal will probably be underestimated by all, including me. One has to keep your positions diversified and small enough to sleep at night. I don’t see a turn before the next 18 to 24 months at least. Cyclical stock require a five to seven year horizon, perhaps longer. But NO ONE really knows until well after the bust when it is over. We must live with uncertainty.
Where is the next BUST. Capital is BEING DESTROYED TODAY:
The same phenomenon that is driving Biotech to unsustainable valuations (ON THE WHOLE) is what has caused coal stocks to collapse:
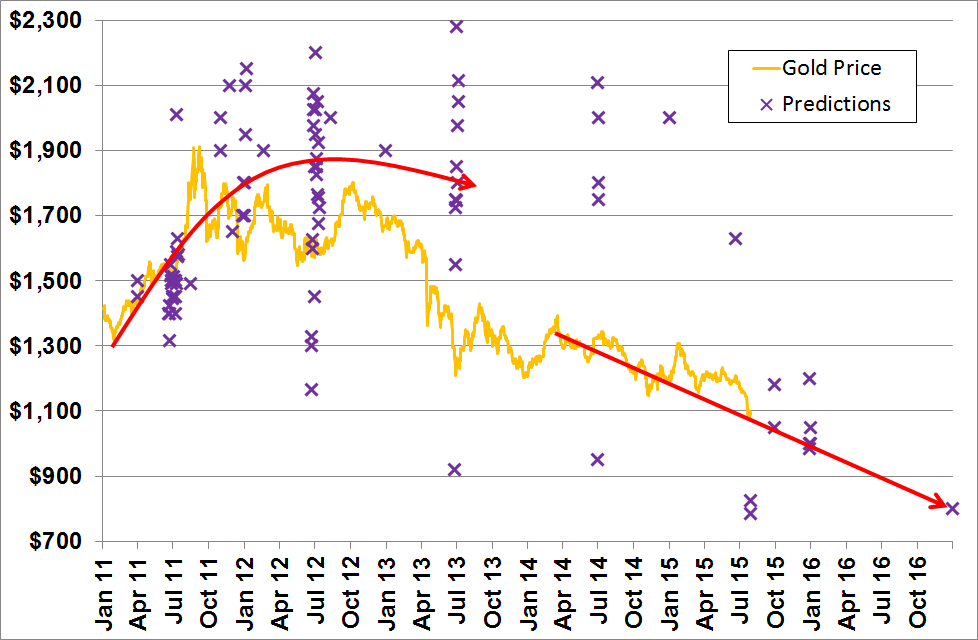
UBS– $1,180 average price over second half of 2015
Towards the end of 2010 I (Bron Suchecki) started recording forecasts in a spreadsheet, as I noticed many analysts revised their forecasts frequently in response to moves in the gold price. By 2012 I had given up as it was a lot of work to make one point – that in general analysts were just following or projecting the trend.
The chart below shows the forecasts I accumulated from late 2010 to early 2012 (the clustering around July are yearly average forecasts) and I’ve added in the recent ones above.
—
Continued….on recent gold “smash”
When the gold price has a big move the news agencies ring up traders for a comment. When I read these articles I’m looking for two things: why do traders think it happened and what do they think about gold going forward. Understanding these consensus narratives around gold is useful as they control large amounts of money and their views influence others.
Before I go on to discuss the comments, please note that narratives (see Ben Hunt) are not about truth, they are about what everyone thinks is the truth. For many finance professionals, the truth is less important (if at all) than being in the herd – most are not interested in the career risk of taking a position contra to the consensus view.
In terms of the why, here are some of the more sensible comments:
Ross Norman: They choose the optimal moment in the early morning and when Japan was closed for a holiday to get the biggest bang for the buck. It was clearly ‘short’ traders using leverage to trigger (technical) stops” he said. The price later regained some of its ground, allegedly as the profiteers cashed in jackpot gains on options that they also had. “It was a trade within a trade”. (link)
Marex Spectron: no coincidence that this happened in the quietest, thinnest period of the week … they deliberately want to move it in a big way (link)
“Traders”: Gold also fell in the Chinese derivatives market, which, traders said, added to the impression of an orchestrated attempt to push the price down, triggering others to sell their positions. (link)
Martin Armstrong: many rumors floating around from China off-loading because wrong storage figures were released, to a large spec investor who sold 6 tonnes and has taken a huge loss on a leveraged trade! (link)
“Traders and Analysts”: attributed the massive move to high-frequency trading algorithms as well as stop-loss selling. (link)
Societe Generale: It was just a bit of a bear raid and there was nobody on the other side to mop up the selling (link)
Chuck Butler: maybe the gold sale on the SGE was “margin influenced,” which would mean that large investors use gold as collateral on stock trades, and as the Chinese stock market has dropped the margin calls have come in (link)
“Market Participant”: The fact that it was done in Asian hours and in a loud, messy manner suggests it may be done by people not directly under European and US regulation (link)
The general view seems to be that it was a deliberate tactical move to push the price down, trigger stops, and try to get gold down to the technically important level of $1080, but with the real objective of making money on another derivative position.
On to the narratives around gold after this price smash. Here are a selection:
Singapore-based trader: “We do see a lot of people in China selling gold to get fast cash to go back into the equity market” (link)
Phillip Securities: “It looks like the end of an era for gold, China has been grappling with oversupply after importing a record volume in 2013.” (link)
Societe Generale: “We have breached significant support levels, we know U.S. rate hikes are coming, there is no inflation and there is no catalyst to hold gold when other markets are doing better” (link)
Momentum Holdings Ltd: “With low global inflation and an improving U.S. economy, I doubt we’ll see big economic shocks, which is not good for gold” (link)
KBC Asset Management: “Gold is a hedge against everything that can go wrong. But at the moment it appears that not a lot is going wrong. We have an Iran deal, a Greece deal and we have good news from European and U.S. economies. There is no real reason for us to invest in gold and gold companies.” (link)
Deutsche Bank: “the “fair value” for gold is around $750. … “All the ducks are now aligned for a gold slide: real interest rates are rising, the dollar is getting stronger and the risk premium on equities is going down” (link)
So no change in the “improving US economy” and “Fed raise rates” story, indeed I feel that market participants see this price smash as confirmation of this narrative. That is not good for gold as it will give them confidence to test gold again. I’m not as confident as they are that everything is looking rosy and all the problems have been solved so I find myself agreeing with Adrian Ash that just like in 1999, this is a case of “peak hubris of policy-makers thinking they had abolished the boom-bust cycle” and that “gold continues to do what it does, rising when you need it and slipping when the financial world thinks it’s just a useless commodity”.
From Bloomberg(Bloomberg belongs to a limousine socialist, and is well-known for its pro-central banking/ pro-money printing and anti-gold editorial line. Some of the most ludicrous articles about gold ever published have appeared on Bloomberg):
Gold Is Only Going to Get Worse (“Our survey shows a majority of traders and investors aren’t optimistic”) – indeed, Bloomberg seems to be blissfully unaware of contrarian sentiment analysis.
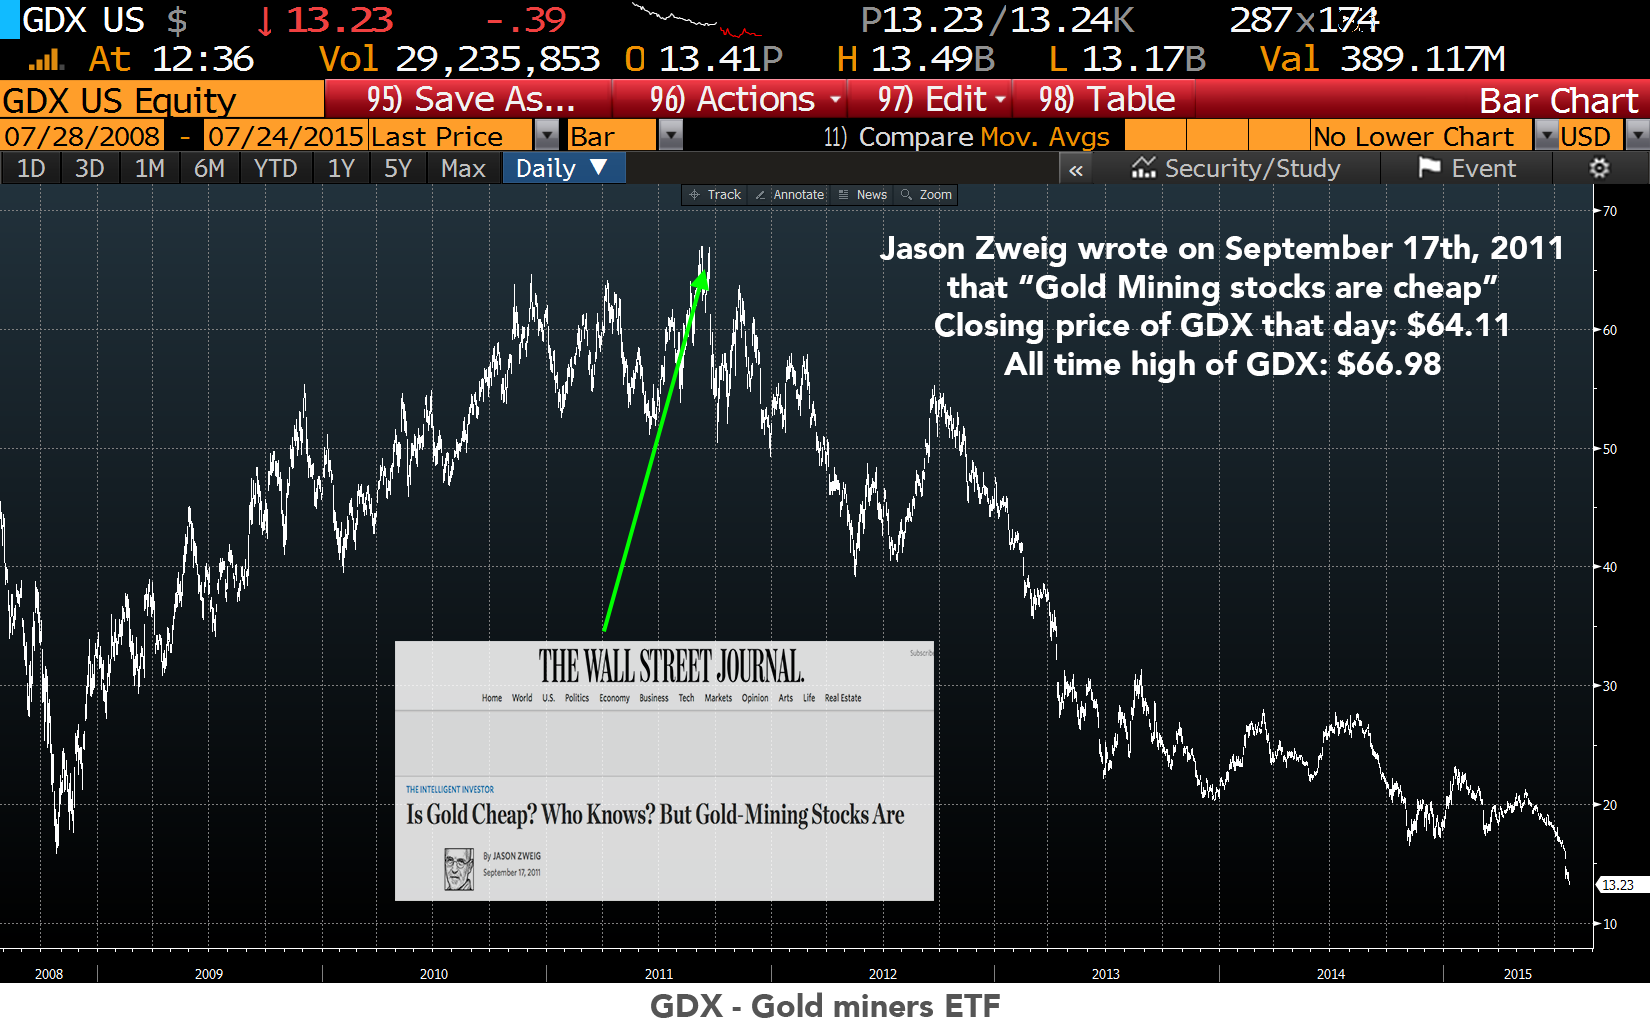
Let’s Get Real About Gold: It’s a Pet Rock – actually, as we have previously pointed out, it’s a door stop, not a pet rock. We should perhaps mention here what Jason Zweig, the author of this WSJ article, wrote in 2011 right at gold’s peak. From Mr. Zweig’s WSJ Article of September 17, 2011:
“Growing numbers of investing experts have been declaring that gold is a bubble: an insanely overvalued asset whose price is bound to burst. There is no basis for that opinion.”
With respect to gold miners (which since then are down by more than 80%) he opined:
“But there is one aspect of gold investing where it is possible to make rational estimates of value: the stocks of gold-mining companies. And, by historical standards, they seem cheap—based not on subjective forecasts of continuing fiscal apocalypse, but on objective measures of stock-market valuation.”
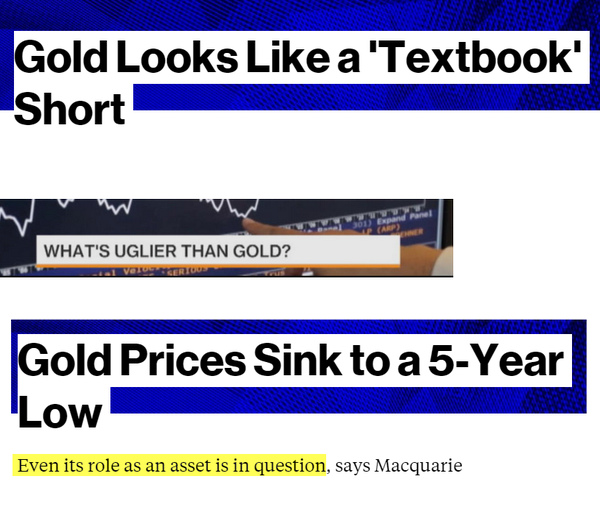
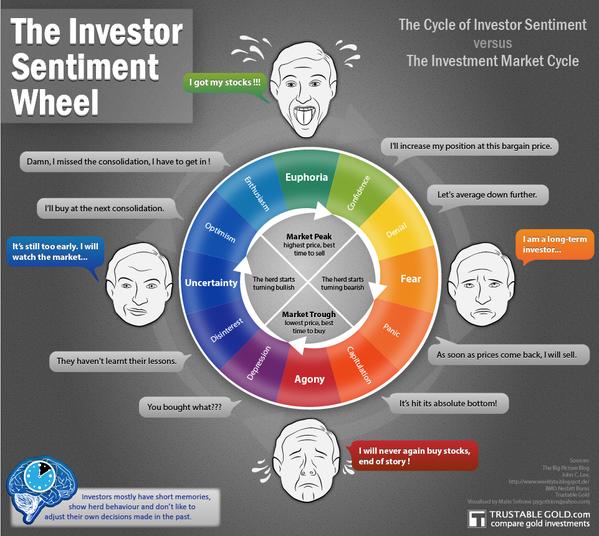
This is really a textbook example of how market sentiment works.
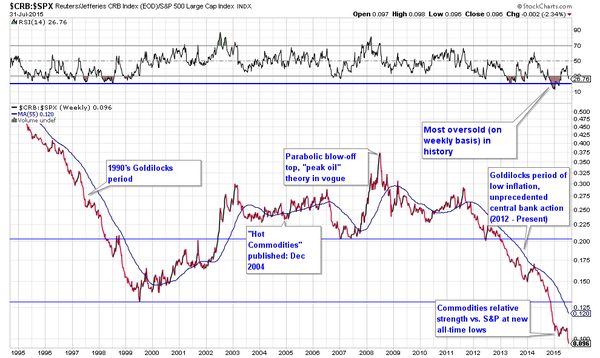
Study predicts gold could plunge to $350 an ounce (i.e., here come the extreme predictions, the inverse of the vast bullish consensus and the extreme bullish predictions that were made at the peak by gold bulls)
And all of this was finally crowned with the following pronouncement in the Washington Post:
Interestingly the author of this article, Matt O’Brian, actually gets one thing right, although his conclusion remains utterly wrong – he writes:
“When you think about it, a bet on gold is really a bet that the people in charge don’t know what they’re doing.”
That’s exactly what it is Mr. O’Brian. The wrong conclusion he comes to is this one:
”But economists do, for the most part, know what they’re doing.”
Yes, in some parallel universe perhaps. That people can profess such beliefs after the twin debacles of the tech and housing bust and after yet another giant asset bubble has been blown by these “economists who know what they are doing” is truly stunning. How blind and naïve can one possibly be? This article is a good example of statist propaganda. Our wise leaders know what they are doing! How can anyone doubt it!
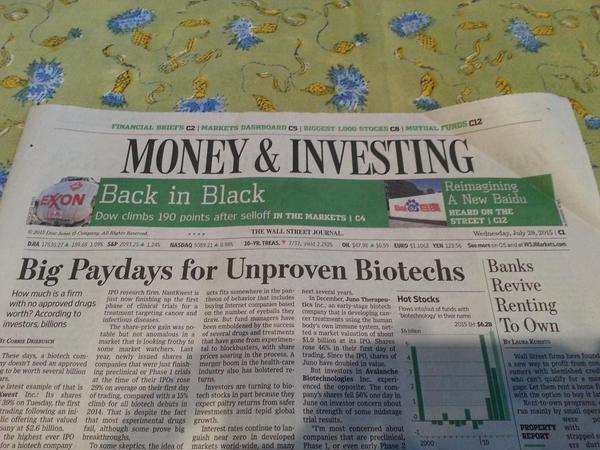
Meanwhile, the mirror image of bearishness, we see:
2015 has seen the largest amount ever raised in a biotech IPO, as well as the largest valuation for bio IPO with no drugs. via @IPOtweet. Can anyone guess how those investments will do over the next five years?
Additional Reading
A reader contributes: http://www.buffettfaq.com/ The blog has questions and answers of Buffett and Munger categorized by different parts of investing.
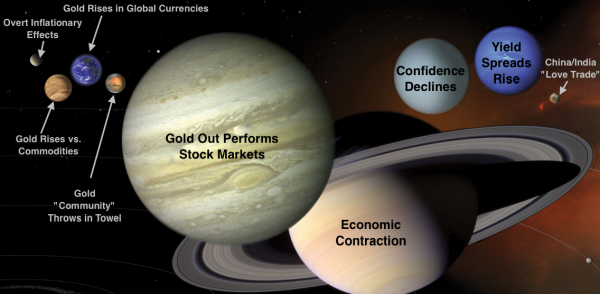
There is no stand-alone Narrative regarding gold today (June 2013), as there was in 1895. Today gold is understood from a Common Knowledge perspective only as a shadow or reflection of a powerful stand-alone Narrative regarding central banks, particularly the Fed … what I will call the Narrative of Central Banker Omnipotence. Like all effective Narratives it’s simple: central bank policy WILL determine market outcomes. There is no political or fundamental economic issue impacting markets that cannot be addressed by central banks. Not only are central banks the ultimate back-stop for market stability (although that is an entirely separate Narrative), but also they are the immediate arbiters of market outcomes. Whether the market goes up or down depends on whether central bank policy is positive or negative for markets. The Narrative of Central Banker Omnipotence does NOT imply that the market will always go up or that central bank policy will always support the market. It connotes that whatever the central bank policy might be, it will drive a market outcome; whatever the market outcome, it was driven by a central bank policy.
The stronger the Narrative of Central Banker Omnipotence, the more likely it is that the price of gold goes down. The weaker the Narrative – the less established the Common Knowledge that central bank policy determines market outcomes – the more likely it is that the price of gold will go up. In other words, it’s not central bank policy per se that makes the price of gold go up or down, it’s Common Knowledge regarding the ability of central banks to control economic outcomes that makes the price of gold go up or down.
Instead, the focus of the mainstream Narrative effort moved almost entirely towards what open-ended QE signaled for the Fed’s ability and resolve to create a self-sustaining economic recovery in the US. And it won’t surprise you to learn that this Narrative effort was overwhelmingly supportive of the notion that the Fed could and would succeed in this effort, that the Fed’s policies had proven their effectiveness at lifting the stock market and would now prove their effectiveness at repairing the labor market. Huzzah for the Fed!
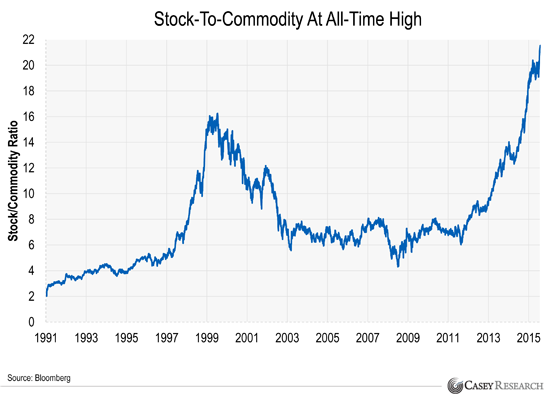
Investors above flee tangible assets for financial assets. Taken to an extreme, input costs for companies will go to zero and profit margins to infinity. Reality?
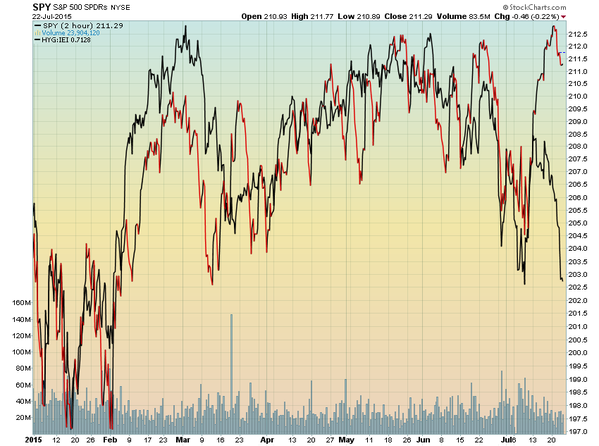
It actually seems, at times, as though there is this mysteriously large buyer that suddenly appears whenever the equity market most “needs it”…and the subsequent buying is so aggressive and so desperate…not the style of the mostly steady “hands” I personally know. It just seems too good to be true and the Sortino Ratio numerically reflects that belief. Plus, we all know that the economic fundamentals are not as smooth as the weekly or monthly charts of the S&P 500 would suggest.
Remember that equities typically offer the most risk of any asset class…not the lowest risk as the above data set suggests. Nevertheless, Yellen and Bernanke must be “psyched” as their “wealth effect” model has been so effective…actually too effective as the market distortions grow ever larger…and more market bears become contorted “road-kill”.
To be sure these distorting effects may be entirely assigned to The Fed…the debt monetizing, interest rate suppressing “Masters of the Universe” who always get what they want while answering to nobody.
They’ve literally trounced and expectorated on the concept of “moral hazard” and, it seems, purposely reconfigured and redefined its meaning into: We have no economic moralsand this poses an enormous hazard to the performance of hedged money managers. The spoils go to the ignorant only – the Fed’s true heroes. What Risk?
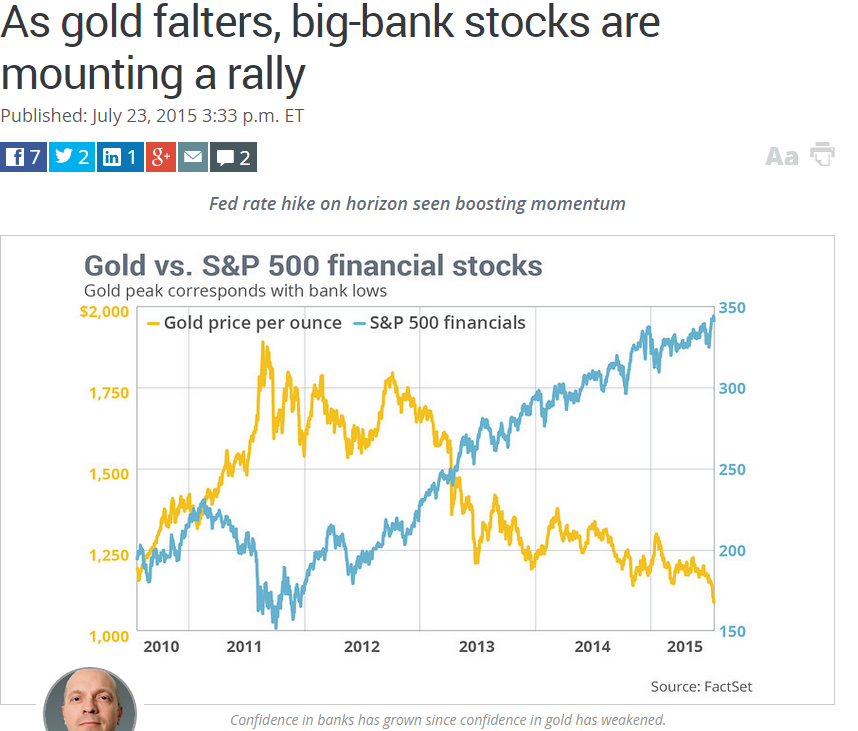
Grant on gold July 22 2015 Zweig The same analyst who suggested buying miners within 1% of the all-time top in Sept. 17, 2011 now says gold is a “doorstop” in July 17, 2015. NOW, he tells me! Journalists chase price and sentiment.
The headlines reported that AMZN’s sales were up 20% year over year for Q2 and that net income had swung from a loss of $123mm to a profit of $92 million yr/yr for Q2. While those numbers are what they are, sales growth from Q1 to Q2 was a mere 2.9% – pretty much in-line with the rate of inflation.
The media propagandists attributed AMZN’s highly “surprising” quarter to big gains in its AWS business segment, which is its cloud-computing business. However, if we drill down into the numbers made available in its 8-K, we find that the AWS segment represents just 7.7% of AMZN’s revenue stream vs. 6.6% of revenues in Q1. Sure seems like a lot of manic hype over well less than 10% of AMZN’s business model.
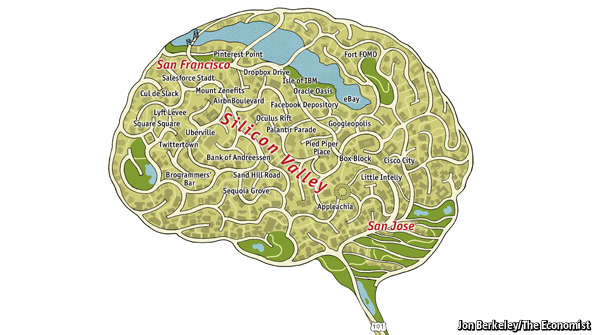
As it turns out, AMZN’s AWS business model, like everything else it does, is seeded in low quality sources of revenue that will ultimately prove to be unsustainable. Why? See this comment sent to me by someone who read my Amazon research report and who used to specialize in high tech accounting for Silicon Valley start-ups:
I audited many of the high fliers that crashed and burned, took companies public & was at the printers the day the bubble really burst which ultimately tabled that IPO…Amazon Web Services is growing by leaps and bounds and a significant amount of those $’s are coming from venture backed start-ups. Almost the entire Silicon Valley and other startups outside the Valley use AWS. Venture backed startups have exploded just as AWS revenues have exploded…That segment of their business will get walloped which right now seems to be a main source of their operating income.


