From James Grant: Money is information, says Gilder. It’s a measuring stick, not a magic wand.” Wealth is knowledge and growth is learning. Prices should always trend down over the long-term in a capitalist economy to reflect continuous improvements in the technique of production. ….Researchers in Bitcoin and other digital currencies have shown that the real source of the value of any money is its authenticity and reliability as a measuring stick of economic activity. A measuring stick cannot be part of what it measures.
For more than a century, the U.S. Federal Reserve has manipulated the money supply, ostensibly with the goal of steering the economy away from extreme booms and busts. In practice, however, central banks exacerbate the very problems they purport to fix, spurring the misallocation of capital in the wrong sectors of the economy, inflating speculative bubbles, and doubling down on their mistaken strategy after the inevitable collapse and ongoing stagnation. At a recent event hosted by Atlas Network partner the American Principles Project (APP), renowned author George Gilder presented a strong case for replacing Fed meddling with a 21st century gold standard.“Government efforts to control money destroy wealth by inhibiting learning,” Gilder explained, noting that money serves as a channel that carries information about supply and demand to every market participant in every corner of the economy. Gilder’s new book, The 21st Century Case for Gold: A New Information Theory of Money, expands on that theme.“Manipulating the value of money, whether by printing currency or artificially suppressing interest rates, does not create wealth,” Gilder wrote. “Instead, it is the equivalent of manipulating the data of a scientific experiment after it takes place, distorting the information economic actors need to create new wealth. Understanding the new economic paradigm of information theory leads us to recognize that inflation is only one of many bad economic results of monetary policy that distorts the value of money.”
Atlas Advisory Council member and APP Chairman Sean Fieler introduced Gilder’s remarks and helped to frame the ensuing discussion, which also included financial publishers Steve Forbes and Jim Grant. The event highlighted how Gilder’s fresh take on the currency debate could help make the need for sound money politically salient in the coming year.
Buying Distress and Falling Knives or the “No Hope” Portfolio.
Symbol
Company
Price
Shares
Amount
Comm.
Total
Date
CLD
Cloud Peak Energy
4.66
1071
$ 4,991
8
$ 4,999
6/14/2015
BTU
Peabody Energy
2.47
2020
$ 4,989
8
$ 4,997
6/14/2015
CNX
Consol Energy
25.51
196
$5,000
8
$ 5,008
6/14/2015
Completed 1:14 EST
$15,004.00
6/14/2015
I am buying a basket of coal miners today with different characteristics. CNX is not a pure coal company. Peabody is more of a stub stock since its market cap is about 1/10th its debt–scary! I will add on a further 25% decline. Holding period: five years. I recommend that anyone reading this NOT follow me. Do your own thinking or mis-thinking as the case may be.
We also don’t want to confuse low nominal prices or declining prices with “cheapness.” There are plenty of junior resource stocks trading for pennies that are worth $0. Microcap_stock_fraud
A Mechanical Investment Plan Using The Acquirer’s Multiple
Bruce Murison* contacted me (Toby Carlisle of www.Greenbackd.com) at the start of June with an interesting proposition: He would open a dedicated account to trade the Acquirer’s Multiple All Investable Stocks Screen and post his strategy and results on the site. He thought knowing there was a public eye keeping him on the straight and narrow might assist with his discipline (the same reason I launched Greenbackd in 2008). He wondered if a real time, real money account tracking the acquirer’s multiple’s performance would be interesting to readers of the site. I of course leapt at the opportunity. Bruce hopes that his project might encourage outside the box thinking and maybe lead to others posting their strategies and ideas that could become an interactive community of users. Here begins Bruce’s first post in what I hope will be a long series:
—
I am dedicating a $25,000 real money account to trade stocks ranked favorably according to The Acquirers Multiple (TAM). Every stock will be chosen and traded according to these rules:
Thanks to the GREAT Toby Carlisle whose books, videos and dark sense of humour are an inspiration to all.
—
QUESTION to all:
Will screening out the companies that may or could go bankrupt (the ones with the worst financial metrics) but are the cheapest hurt performance. Why are money losing net/nets generate better returns AS A GROUP than money making net/nets. Example: Energold (EGDFF).
We skip Chapter Six (for now) and focus on Chapter 7 in DEEP VALUE: Catch a Falling Knife: The Anatomy of a Contrarian Value Strategy
In Search of Un-Excellence
The authors identified 36 publicly traded “excellent companies” on the basis of out-performance in six criteria, measured from 1961 to 1980.
Asset growth
Equity growth
Return on total capital
Return on equity
Return on sales
Market to book value
Then an investment analysts, Michelle Clayman, identified 39 publicly traded “un-excellent companies” which ranked in the bottom third of all Peters and Waterman’s criteria from 1976 to 1980. These “in search of disaster” companies outperformed 24.4% pa over five years vs. 12.7% for the “excellent” companies.
The good companies under-perform because the market overestimates their future growth and future return on equity and, as a result, accords the stocks overvalued price-to-book ratios; the converse is true of the poor companies.
Over time, company results have a tendency to regress to the mean as underlying economic forces attract new entrants to attractive markets and encourage participants to leave low-return businesses. Because of this tendency, companies that have been good performers in the past may prove to be inferior investments, while poor companies frequently provide superior investment returns in the future.”
Note pages 128 to 136 in DEEP VALUE: Tables 7.1 to 7.9
Stocks in the Contrarian Value portfolios were cheaper than the comparable Glamour portfolios on every metric but on a Price-to-Earnings basis, possibly because the earnings in those portfolios were so weak.
First, valuation is more important than growth in constructing portfolios.
Cheap, low growth portfolios systematically outperform expensive, high-growth portfolios, and by wide margins. It seems that the uglier the stock, the better the return, even when the valuations are comparable. Oppenheimer found in a study on Ben Graham Net/Nets that loss making and non-dividend paying net/nets outperform profitable, dividend-paying net/nets. Ben Graham Net Current Asset Values A Performance Update
In almost any study, the cheap, hated, ugly, least-admired, and poorly performing stock outperforms the high-growth, glamour stocks.
What these studies demonstrate is that mean reversion is a pervasive phenomenon, and one that we don’t intuitively recognize. Our untrained instinct is to pursue the glamorous stock, the high-growth stock, the story stock, the excellent stock, the admired stock, the A+ stock, or even the profitable net net, but study after study shows that this instinct leads us to under-perform. Buying well-run companies with good businesses at bargain prices seems to make even more sense. The research shows , however, that the better investment–rather than the better company–the value stock, the scorned, the unexcellent, the Ds, the loss-making net nets. And the better value stock, according to Lakonishok, Shleifer, and Vishny’s research is the low-no-growth value stock, what they describe as “contrarian value,”
What is clear is that value investing in general, and deep value (buying the ugliest of ugly) in particular, is exceedingly behaviorally difficult. It is counter-intuitive and against instinct, which is why many investors shy away from it.
Lecture by Toby Carlisle on Deep Value Investing
Next Lesson:
We will finish up this chapter by covering The Broken-Leg Problem. Please give this chapter a close study–the conclusions are extremely COUNTER-INTUITIVE and the opposite of what most investors look for. We are at the heart of deep value investing.
In 1982, working as a 26-year-old money manager, I passed on Berkshire Hathaway, which was trading at $97, because I thought it was too expensive. The price represented a 50 percent price to earnings and price to book premium to the broad market. Had I made a different decision – at the time I was sitting on a large cash position from a successful real estate investment – I would now be smoking $10 cigars and hanging out with swell chicks. I’ll wait, I thought, until it hits $60. I’m still waiting. On Friday BRK.A closed at $217,000.
Although I was familiar with Warren Buffett’s investment record – he was widely regarded as one of the best investors of his generation, and I carefully read the Berkshire Hathaway annual report each year – he had not attained the prominence he now has. I mentioned this to Ian, and he suggested I might write about what I learned from passing on Berkshire Hathaway, and the years I worked as an investment analyst on Wall Street.
By way of background, I did not finish high school. I left home at the age of fifteen and hitchhiked up into Canada’s subarctic and worked fighting forest fires and then as a forest tower lookout. The loneliness was too much for me, so at the age of eighteen I became a real estate salesman. In my early twenties I sold hotels and nursing homes, and then met with some success as a real estate investor. I became fascinated by the stock market, and a full time investor in my mid-twenties. Within a couple of years I was managing money, specializing in mismanaged, undervalued companies. They ran the gamut from companies whose stock had declined significantly, had new management, heavy insider buying, to the bonds of bankrupt or distressed companies, to companies with substantial real estate holdings, low insider ownership and minimal or no profitability. I was fairly successful at this in Toronto, acquired some major clients in New York City and in my late twenties moved to the US and started an investment research firm serving institutional money managers and corporate acquirers. I did that for five years, made some money and retired to the Adirondack woods.
Overall, I was successful but my performance was extremely volatile including two years in a row down over 40 percent. Most of my investments lost money or broke even; the few winners were up so much that overall my portfolio averaged a thirty percent return. Among my clients were some of the most successful corporate acquirers of the day – Sam Zell, Richard Rainwater, Leucadia, Jay Jordan, and some of the most successful money managers of the day, Chuck Royce, Leon Levy, Michael Price, Seth Klarman, Fidelity’s Alan Leifer, Ernie Kiehne of Legg Mason (Bill Miller was Ernie’s assistant at the time), George Soros — about 100 money mangers paid my firm $20,000 a year in soft dollars for my “contrarian research.” They followed my work because I studied, in an in-depth way, companies not otherwise followed by analysts.
Much of what I learned I learned from watching extremely successful investors make and lose money. And from losing my own money.
What did I learn?
Lesson 1: The role of financial markets is to take money away from mediocre and underperforming companies and put it in stable, growing, high return on capital companies. Money has an almost metaphysical attraction to places where it is put to careful, good use. You can fight that trend, and invest in companies, for instance that are deeply undervalued and mismanaged – and some people are successful investing in the dregs – but very few over the long term. To use a whitewater kayaking analogy, freshwater seeks salt water, and you can fight that if you want, but paddling upstream eventually is likely to become highly problematic.
The approach that’s worked best in my experience is investing in high return on capital, low debt, growing companies that have the ability to reinvest earnings in the business and generate high returns on those reinvested earnings. The power of compound interest is so profound (mind-boggling really) that over time, returns in investments in those companies are enormous. The trick is finding companies that are compound interest machines. I remember Leon Levy, founder of Odyssey Partners, once telling me that John Paul Getty became the wealthiest man in the world by achieving a 17%percent compound rate of return, on average, over his career.
As in the case of Berkshire Hathaway, trying to invest in those companies based on an analysis of value is more likely to result in opportunities missed than it is make money. An approach that is much more likely to be successful – investing in high quality companies after a market decline of thirty percent, and retaining the liquidity to build positions in those companies after a fifty percent decline in the broad market averages. That takes extraordinary patience, which is a matter of personality.
Lesson 2: I’ve worked for two extremely successful investors who were experts in cyclical, commodity-dependent, capital intensive industries – real estate and mining – and learned that almost all of the real money made in those areas is made only by extremely patient investors who invest once every ten or twenty years, liquidate their holdings once a decade and spend long, long periods of time in cash.
One of those investors, Pat Sheridan, an owner of mines all over the world, once said to me that the classic business mistake was to be fully invested at the top of the market. The objective, he said, was to be liquid at the bottom because business cycles are primarily caused by the creation and destruction of debt. Those are functions of greed and fear, in other words of emotions. He built inventory (by buying mines) during times of low demand, and sold them during times of high demand, including one for $10 million in 2011. Managing cash is crucial to his strategy, he told me.
When oil or real estate prices increase, money flows in to take advantage of what appears to be above-average returns. Overcapacity results, prices decline, debt can’t be serviced and gets converted into equity or otherwise written off, capacity declines and within a few years commodity prices begin to recover. Then the whole cycle starts over again. The swings are unpredictable in terms of duration, but successful investors in those areas look for opportunities after a major (20 percent or more) capacity reduction in an industry, when the debt of the bottom thirty percent of companies in terms of quality of management and assets no longer exists and the debt of mediocre companies (the next ten or twenty percent of companies) trades at pennies on the dollar.
Three approaches, I’ve observed, work best over time: investing in the low cost producer with a durable cost advantage, investing in premium assets such as well-located real estate, and buying debt at pennies on the dollar after an industry wide collapse. All three strategies are most successful after a severe market decline when emotionally it is difficult to do.
The approach that almost always results in disaster – investing in cyclical stocks based on P/E ratios. Cyclical stocks are cheapest when, industry-wide, companies are losing money or have very low earnings, and most risky when they have low P/E and high price-to-book ratios.
Lesson 3: Most successful investors share some common personality characteristics.
They have superior analytical skills in at least one important area of investing. This results from an obsession with investing. They are students of the art. Ian, your commentary on this subject has helped me really focus on what I think I do better than most other investors. In your case Ian, I think that you have an important long term advantage in being willing to, and knowing how to, build relationships with management based on mutual trust and respect. In my case it is an ability to identify superior companies based on financial statement trends. I think. I hope. Only time will tell.
My skill evolved out of the realization that I could have avoided 90 percent of my disasters by spending a couple of hours with a company’s quarterly balance sheets and income statements. Instead, I would routinely fly thousands of miles, interview management, interview former executives and directors, especially those bearing grudges, visit company real estate and local appraisers, interview competitors, suppliers, and customers. I even, on occasion, would sit in a bar outside company factories and have a beer (or two) with workers coming off shifts. I studied accounting at night, read Ben Graham’s classic Security Analysis(twice) and spent twenty years running a business with customers, distributors, suppliers, employees and, as part of that, prepared financial statements once a month. I learned what fluctuations in twenty criteria including inventory, accounts payable and receivables and gross profit margin indicate about a company’s competitive position and prospects. That makes me uniquely qualified, I think, to analyze companies based on their financial statements. We’ll see.
Investing can be looked at as an emotional competition – your emotions and ability to control them versus the emotions of those you buy or sell securities from and to. A primary function of investment strategy is to counteract emotional impulses and thus survive (and take advantage of) adverse market developments. Investment performance is mostly determined by patience, risk management, a willingness to study, and what you do when things go differently than you anticipated. Those factors are personality driven.
In addition to having a clear concept of what their competitive advantage is over others, successful investors, I’ve learned, incorporate into their investment strategy clear concepts of acceptable risk, what constitutes an acceptable level of inactivity and length of holding period after funds are committed. And successful investors stick to their strategy. That strategy – for instance sitting on cash, sitting on losing positions, sitting on winning positions — must be based on self-knowledge. If the strategy is out of sync with the personality, it won’t work, no matter how well it has worked for others.
There are successful short and long term investors, but rarely are there successful investors who do both. A long-term investor must be a patient person. A short term trader who thrives on, perhaps needs, constant activity is likely to be an impatient person.
Regardless of short or long term investor/trader, risk management is crucial to survival and success. Once again, this is a personality issue. A successful investor’s strategy will anticipate adverse market developments – will assume that sooner or later they will be wrong and will lose money. Cash position versus invested capital is perhaps the single most important area of risk management, although acceptable debt levels (both in one’s own financial structure, and the companies in one’s portfolio) is also important. Does an investor have a cash management plan that fits with the other key elements of his or her investment strategy? Successful investors, in my experience, think their cash position through very, very carefully and they pursue a strategy that mitigates risk in what is otherwise a very risky field of endeavor – investing. Depending on the stage of the market cycle, very high or very low cash positions have a major impact on portfolio returns. And on investment survival.
Does and investor buy on strength or buy on weakness? Fluctuations in security prices are often determined by factors other than the underlying fundamentals of the companies involved. A stock can decline due to a major investor needing to raise cash, emotion, faulty analysis, and macro economic factors that do not affect the particular company in question. Is an investor a victim of those factors or a beneficiary? Does an investor know more about a particular company than the market? If yes, buying on weakness augments an investor’s returns. If not, returns are diminished by buying on weakness. Does an investor have the ability to admit when he or she is wrong and take action? Does an investor have the courage to buy during irrational price declines, when economic collapse is widely anticipated and discussed in the news media? Those factors impact long term returns, and they too are personality driven.
Ian, I find your belief that quality companies with market caps of under $30 million are more or less immune to general market declines because they have low institutional ownership very intriguing. Regardless, I strongly suspect that investing in quality companies that used to have market caps of over $100 million, and high institutional ownership, but now have market caps of under $30 million and no institutional ownership because the market is down 50%percent, is a lower risk variant on your strategy.
Whatever one’s position on that subject, an investment strategy needs to anticipate significant market declines, as well as declines in the securities in one’s portfolio, since declines have been a part of markets ever since markets were first created. Humans are emotional, therefore markets are emotional, debt results, markets collapse, and humans become more emotional. And master investors invest.
Or something like that.
MicroCapClub is an exclusive forum for experienced microcap investors focused on microcap companies (sub $300m market cap). MicroCapClub was created to be a platform for experienced microcap investors to share and discuss stock ideas. Our goal at MicroCapClub.com is quality membership, quality stocks, and quality content. If you are an experienced microcap investor, feel free to Apply today.
Why does high growth seem to depress stock market returns and low growth seem to generate high stock market returns? It is not the growth destroys returns, but that the market already recognizes the high-growth nation’s potential, and bids the price of its equities too high. Market participants become overly optimistic during periods of high growth, driving up the prices of stocks and lowering long-term returns, and become too pessimistic during busts, selling down stocks and creating the conditions for high long-term returns. Jay Ritter says that irrationality generates volatility “and mean reversion over multi-year horizons.” Graham would agree (p. 88, DEEP VALUE).
The implications for mean reversion in stocks are counter-intuitive. Stocks with big market price gains and historically high rates of earnings growth tend to grow earnings more slowly in the future, and underperform the market. Stocks with big market prices losses and historically declining earnings tend to see their earnings grow faster, and out perform the market. Undervalued stocks with historically declining earnings grow earnings faster than overvalued stocks with rapidly increasing earnings. This is mean reversion, and, as Ben Graham said, it’s the phenonmenon that leads value strategies to beat the market.
The update to Lakonishok’s research Contrarian Investments Extrapolation and Risk demonstrates that, aside from short periods of under-performance, value stocks generate a consistent value premium, and beat both the market and glamour stocks over the long haul. ….Researchers believe the reasons are because they are contrarian to overreaction and naive extrapolation. Efficient market academics Eugene Fama and Ken French, counter that value strategies outperform because they are riskier. However, Lakonishok found that while value strategies do disproportionately well in good times, its performance in bad times is also impressive. Value strategies are also outperform during “bad” states for the world such as recession and extreme down markets.
When Lakonishok compared the growth rates implied by the market price to the actual growth rates appearing after the selection date, they found a remarkable result–one that supports Graham’s intuition–value stocks grow fundamentals faster than glamour stocks. The high prices paid for glamour stocks imply that the market expects them to generate high rates of growth. Contrary to this expectation, however, the growth rates do not persist. Growth stocks;s growth rates mean-revert from fast growth to slow growth.
SUMMARY
If you read all the links and research papers in the past two posts for this chapter in DEEP VALUE, you know that:
Out-of-favor value stocks beat glamour stocks because….
the actual growth rates of fundamental sales and earnings of glamour stocks relative to value stocks after selection are much lower than they were in the past, or as the multiples on those stocks indicate the market expects them to be.
Value strategies appear to be less risky than glamour strategies.
So why do investors persist in buying glamour? For behavioral reasons like anchoring and “overreaction bias.” We will next explore chapter 6 in Deep Value.
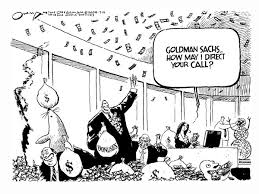
Today’s equity analysts are better educated (CFAs, MBAs, CPAs) better informed and command more computer muscle than ever. What they lack, critics say, is courage.
Instead of leading clients to investment ideas, many analysts follow the crowed, churning out duplicative research reports that become part of a cacophony of timid group-speak.
“Too many analysts think alike; too few are willing to risk being wrong by taking a gusty, controversial stand,” according to a widely circulated report last month from market strategist Byron Wien at Morgan Stanley & Co.
Wien’s sentiments were echoed in interviews with other market strategists, mutual fund managers, research directors and analysts themselves.
Such complaints are not new, but they come at a time when research departments are slowly rebuilding their ranks following layoffs several years ago. These new analysts will be of little use, however, if they fall in with the herd and fail to produce ground-breaking research.
Critics say both analysts themselves and the incentives that drive the brokerage business are to blame for the group-think.
In a job where performance is measured every trading day by eights of a point, many analysts find security in mimicking their peers. If they are wrong, at least they don’t stand out. Yet, analysts’ opinions are most valuable when they are not only correct but also are in the minority.
If you’re always with the consensus, you probably won’t make much money, but you won’t get fired,” Wien said in an interview with Investor’s business Daily.
Stefan D. Abrams, managing director at Trust Co. of the West, argues that brokerage firms put too much emphasis on the morning call, when analysts announce their latest recommendations to their firm‘s brokers.
The practice may generate lots of trading commissions, but it also leads to a confusing fragmentation of information.
“Analysts are basically not doing the job of helping investors develop conviction in the long-term prospects for companies.” Abrams said.
“They’re too preoccupied with the morning call so they can spout some information that may not be that important. It’s a tidbit of information. Analysts are in the tidbit business.”
The very nature of the brokerage business also stunts the effectiveness of research.
CLIENTS’ INTEREST
An analysts’ purpose, after all, is to come up with winning investment ideas that will prompt their institutional clients to trade stocks through their firm’s brokers and generate commissions. But many of these clients are interested only in larger, more liquid stocks, so analysts tend to concentrate on these types of companies.
Often, “an analysts picks up a stock simply to attract trading calls, “ said Jonathan C. Schooler, a mutual fund manager for AIM Advisors Inc. in Houston.
The result is that dozens of analysts end up covering the same behemoth company. For example American Telephone and Telegraph Co. and NationsBank, the most widely covered U.S. companies , are followed by 59 analysts each. According to Nelson Publications Inc.
The 25 most widely watched U.S. companies have an average 52 analysts each.
By virtue of their size and number of shareholders, these companies deserve wide coverage. But each additional research report adds less value if, as is often the case, it resembles the reports it succeeded.
Moreover, this kind of duplicative effort leaves analysts less time to ferret out tomorrow’s AT&T or Microsoft Corp.
Of course, there are analysts who make a point of discovering companies early in their growth cycles and who are not afraid to cut their own path.
Oppenheimer & Co.’s Cecelia Brancato started following Cisco Systems Inc. in the summer of 1990. It has since increased 2,344%.
OTHER SIDE OF THE STREET
Brancato said she knew about Cisco even before its market debut, and recognized the potential for both the company and the entire computer networking industry. This gave her the conviction to ignore the periodic negative rumours that would temporarily weaken the stock.
“Typically, I am on the other side of the Street, whether it be on my opinion or my earnings estimates,” she said. “More often than not.”
ORIGINAL RESEARCH
Wien and others suggest, however, that analysts would build more credibility by conducting original research and developing maverick opinions that help clients make money.
Meantime, many institutional investors will continue to do their own research, they say, because too much of the information from Wall Street is stale.
“I throw those things out,” Art Bonnel (PM of MIM Stock Appreciation Fund) said, referring to most research reports. By the time it gets to me, everyone knows about it.”
—-
Coal Stocks Under Stress
Coal in a battle of “survival of the fittest,” Citigroup says
May 27 2015, 14:56 ET | By: Carl Surran, SA News Editor
A day after Credit Suisse warned that coal miners such as Arch Coal (NYSE:ACI) and Alpha Natural Resources (NYSE:ANR) were in “dire straits,” Citigroup analysts say it will be “survival of the fittest” for the world’s coal miners.
While Citi believes current coal prices are below sustainable long-run levels, it does not expect a return to prices anywhere near the levels seen a few years ago; the firm cuts its long-run thermal coal price forecast to $80/ton from $90 and its met coal price forecast to $125/ton from $170.
The firm sees China and India as the largest sources of downside risk to its long-run forecasts, particularly for met coal, where China could re-emerge as a net exporter.
The above “research” copy-cats an amazing insight of the obvious as coal company, ACI, declines from $78 to 49 cents:
Ask yourself what was the purpose of stating the obvious after the fact? The analyst should produce original work such as what has the market already discounted today? What about an industry-map showing production costs and sales per ton for each type of coal and where mines are located relative to domestic and export markets? What are the dynamics affecting the market and what can change? How much supply needs to be reduced? Who will and won’t benefit from consolidation? Do the companies have different management than the CEO’s and Boards of Directors who took on debt to make acquisitions at the top of the market in 2011? What drove management’s actions. Can companies work together to merge and rationalize supply and return to profitability.
Reporting the obvious to mimic a competitor seems silly. What do YOU think?
—
A reader suggests a sub-group (off of the Deep-Value group at Google Groups) be formed to learn and study different concepts. I certainly encourage the idea. Let me know how I can help.
—
How Crazy is This?
What Chicago’s Fiscal Emergency says about the Quality of Credit Analysis in the Municipal Bond Market
Because it demands large-scale paradigm destruction and major shifts in the problems and techniques of normal science, the emergence of new theories is generally preceded by a period of pronounced professional insecurity. As one might expect, that insecurity is generated by the persistent failure of the puzzles of normal science to come out as they should. Failure of existing rules is the prelude to a search for new ones.
— Thomas Kuhn, The Structure of Scientific Revolutions
In a sense, Moody’s was only validating the bond market’s opinion of the city’s creditworthiness — the bonds had already been trading at junk levels for several months. This should have been a straightforward event for the chattering class to process intellectually. Rating actions tend to lag the market rather than lead it.
Oddly, however, Moody’s downgrade sparked a debate over whether Moody’s was being “fair” to Chicago. And with Chicago attempting to convert a portion of its variable rate debt to a fixed rate tomorrow, this debate has received considerable amounts of publicity. How could Moody’s cut the city to junk when the other rating agencies rate the city so much higher? (That has obviously never happened before in an era of ratings shopping and superdowngrades.) Wouldn’t having a diverse economy and large tax base cancel out the costs associated with machine politics? (It’s not like this is Chicago’s third fiscal crisis in the past century.)
This was probably the first instance in the history of the capital markets that a rating agency was accused of having too radical an attitude toward risk. How did we get here, folks?
A period of pronounced professional insecurity
Since the financial crisis, municipal bond market participants have been particularly defensive about the level of credit risk in the market as a whole. Commentary on any financially challenged issuer is reliably qualified with “the municipal market defies generalizations,” “these issuers are outliers,” or “remember that, historically, municipal defaults are small relative to corporate bonds.” But the parade of apologies for an issuer with Chicago’s level of financial dysfunction should signal that things have gone too far.
These observations began as a legitimate response to Meredith Whitney’s extremism. Whitney was never going to be correct — the amount of local defaults she predicted exceeded the amount of local government debt outstanding. It was mathematically impossible. It is still mathematically impossible. The financial media that turned her claims into clickbait have moved on to sensationalizing other sectors.
Five years later, however, many municipal market participants remain locked in an unproductive dialogue with an irrelevant personality. Consequently, they are now blind to the fact that what they are saying is no longer true. The market has more financially challenged issuers than can be counted on one hand. These governments are not outliers. They are a class, with similar characteristics and a universe of risks that differentiate them from other borrowers. And they are not small borrowers. It is a more meaningful trend that bondholders are receiving pennies on the dollar in court than it is that defaults remain rare.
There is a conversation to be had about how politics influences the perception of financial commitments and whether bond structures can further evolve to protect bondholders. If the general obligation pledge — absent a statutory lien, which few states have — lacks teeth in court, why isn’t it obsolete? Why is this bond structure still the foundation for credit analysis? Does the general obligation pledge allow governments to over-commit themselves financially in certain political contexts? I would submit to you that this is absolutely the case with Chicago.
None of these issues will be substantively explored so long as market participants remain in “move along, nothing to see here” mode. These are the first fiscal crises where pensions have been a factor at all. In previous fiscal crises, capital markets creditors had the luxury of control. That is no longer a given.
So municipal credit analysis has a lot of growing up to do. Essentially half the market was insured several years ago. As Kuhn noted regarding paradigm shifts in science, there will probably be “a period of pronounced professional insecurity” in the municipal market until new approaches emerge. Until then, there will be a lot of failures.
I will explain my own philosophy regarding financially challenged issuers at the end of this essay.
Rating divergence is actually the status quo — that’s not the story here
Before looking at rating divergence specific to Chicago, it’s helpful to look at the long-term trend of rating divergence between Moody’s Investors Service and Standard and Poor’s. In our opinion, the ratings of the two rating companies have been largely incongruous for several years …
While S&P upgraded 1.01 municipal ratings for each Moody’s upgrade from 2002 through 2007, that ratio ballooned to a whopping 6.66 S&P upgrades for each Moody’s upgrade from 2008 to 2014. And, as noted by the unemployment rate at the time, S&P’s drastic spike in the pace of upgrades occurred at the height of the Great Recession and continued through 2014. This was long after the recession’s effect on municipal finances became apparent to most market participants. While Moody’s pace of upgrades slowed in response to the recession, S&P behaved as though the recession never happened.
We believe this broader context is important to understanding how S&P could rate Chicago’s general obligation pledge at A+ (now A-) while Moody’s rates the same pledge at Ba1. Specific to Chicago, however, we find that not only has the market long treated Chicago’s debt as being at a speculative credit quality — but that it is also well-founded given the credit fundamentals.
Moreover, it is worth noting that the credit rating agencies have published rating methodologies. S&P’s US Local Government General Obligation Ratings Methodology and Assumptions (September 12, 2013 — stashed behind their paywall) includes overriding factors for liquidity and structural imbalance that the rating agency has long decided to ignore for Chicago. Those factors would have put a junk-level ceiling on Chicago’s ratings. In other words, S&P is arbitrarily holding Chicago to different standards than the other local governments the agency rates. And it is obvious why.
What financial risks does Chicago pose to investors?
Let’s examine Chicago’s credit profile and you can decide whether or not the city’s bonds are speculative investments.
Unfunded pension liabilities
The magnitude of Chicago’s unfunded pension liabilities receives considerable attention, and rightfully so. From Nuveen:
Chicago’s combined annual debt and pension costs are substantially higher than any [of the ten largest US cities] when these obligations are indexed to total governmental revenue. Chicago’s fiscal 2015 debt service and annual pension costs account for 44.8% of fiscal 2013 governmental revenue. San Jose is the next closest city at 27.8%. The nine cities other than Chicago averaged 22.4% of revenue.
The next 10 years will be the most difficult for Chicago, as current statutes require the city to increase contributions to its four pension plans by 135 percent in 2016, and 8 percent annually through 2021, according to Moody’s. Pension payments will rise 3 percent, on average, through 2026 and around 2 percent through 2032 …
The median per capita aggregate unfunded actuarial accrued pension liability for the largest US cities and Puerto Rico is $3,350. The City of Chicago’s is $7,149.
Most municipal market analysts assume that the city will address its unfunded pension liabilities and relatively high debt burden by increasing residents’ property taxes by nearly 50%.
Chicago officials have been unwilling to raise property taxes for at least a decade. Offering documents indicate that this attitude continues. The city iscurrently in negotiations with its police and fire unions to postpone transitioning from a system of arbitrary contributions to actuarial contributions (i.e., contributions that reflect the true cost of benefits).
If officials lack the political will to raise taxes when their bonds are trading at 300 basis points (3%) over the AAA benchmark, will there ever be a resolution short of insolvency? This is a material risk that should not be shrugged off.
Borrowing money in order to borrow money
Bloomberg also notes that Chicago has the second-highest general obligation debt per capita among US cities at $3,047, following New York City at $5,500.
According to offering documents (available here), the city won’t be able to afford to make debt service payments on its outstanding bonds from available funds until 2019. The city has been borrowing money on a long-term basis to make debt service payments since before the financial crisis:
Since 2007, proceeds from general obligation bonds in the range of $90 million to $170 million per year have been used to make the city’s general obligation debt service. The city expects to use approximately $220 million of proceeds of long-term general obligation bonds to fund general obligation debt service in levy year 2015 for debt service paid in 2016. The city currently plans to eliminate the use of general obligation bonds to pay general obligation debt service by 2019.
As I described at length in my earlier essay, How Chicago Has Used Financial Engineering to Paper Over its Massive Budget Gap, the city has also been using long-term debt to: (1) finance everyday expenses and maintenance; (2) finance judgments and settlements, including police brutality cases and retroactive wage increases and pension contributions for unionized employees; (3) restructure the city’s existing debt to extend the the maturities on its bonds far out into the future, in order to avoid having to pay the debt as it was coming due; and (4) provide slush funds for the city’s 50 aldermen to undertake projects in their respective areas (i.e., pork).
State and local governments typically only issue bonds to finance the construction of capital projects — buildings and infrastructure with long useful lives that will benefit residents for generations. Chicago has incurred literally billions of dollars of debt where residents have nothing to show for it.
Excessive reliance on short-term debt
Besides a sharp loss in population (as what happened in Detroit), excessive reliance on short-term debt is a solid indicator of financial stress. Chicago has essentially used its credit lines as permanent source of funding in the sense that they are usually carrying a large balance and have frequently been utilized for non-capital expenditures. The city recently expanded its short-term borrowing program to $1 billion. For the sake of comparison, the city’s general fund operating budget is in the neighborhood of $3.3 billion.
Forbearance agreements
Apparently the irony of assigning an investment grade rating to an issuer that is already in forbearance — i.e., its lenders and counterparties have conditionally agreed to delay declaring events of default and exercising their rights and remedies —has been lost on the rating agencies, let alone an issuer that has $2.2 billion worth of forbearance agreements for variable rate debt, short-term credit facilities, and interest rate swap agreements. Chicago’s offering documents contain six pages of triggered events of default. It would be understandable if the city simply needed to replace a deal participant, but having to take it all out at (presumably) much higher interest cost in short order?
Absent these forbearance agreements, that $2.2 billion would become due immediately. The city usually has less than $1 billion of liquidity. The municipal bond market has not seen a liquidity problem of this magnitude for a local government borrower since the financial crisis. And S&P calls this situation “short-term interference.”
Although a portion of these products will be addressed by the city’s offering this week, Chicago’s lenders and counterparties have imposed some strict conditions on the remaining amount. The agreements are for a short period of time and if the city’s credit continues to deteriorate, the standstill agreements will end and the remaining amount will come due.
A large and diverse tax base, but…
Many of the analysts arguing that Chicago should still be considered investment grade cite the city’s large and diverse tax base. Chicago is a transportation hub and home to a number of major corporations.
The city’s population has been declining in recent years and only grew by 82 residents last year. That is not a typo. According to the Chicago Tribune:
Chicago’s population grew by only 82 residents last year, giving it the dubious distinction of being the slowest-growing city among the top 10 US cities with one million or more residents.
With a population of 2,722,389 residents as of July 1, 2014, Chicago still easily holds its place as the nation’s third-largest city … But cities on both sides of it are gaining.
New York maintained its ranking as the nation’s largest city, gaining 52,700 residents last year, for a gain of 0.6 percent that pushed its population to 8,491,079. Los Angeles added 30,924 residents, up 0.8 percent and bringing its population to 3,928,864.
Sun Belt cities with more than 1 million residents — places like Houston, San Antonio, Dallas and Phoenix — all continued to see dramatic gains in new residents …
“The boom of Chicago in the 1990s was due to immigration,” said Rob Paral, a Chicago-based demographer who advises nonprofits and community groups. “You take away the catalyst of immigration, and you see what we have. They’re going to different parts of the country, and there much less immigration to the US than there was decades ago.
“Texas, as an example, has been a magnet for a lot of lower-paying jobs and has the benefit of lower housing costs. If you’re making $15 an hour, the difference between making it where a house costs $100,000 and $300,000 is great.”
This last point brings us to property taxes. Some have also pointed out that Chicago has the lowest effective tax rate in Cook County, which means the city can withstand a large tax increase. This is true. According to Bloomberg, Chicago’s effective tax rate on residential property is 1.8% versus Harvey’s 8.9%. On commercial property, Chicago is not the lowest, but its 4.9% effective tax rate is much lower than Harvey’s 15.1%.
Discussing the level of property taxes in absolute terms fails to capture residents’ calculus in deciding on where to live, however. Just because Chicago has a lower tax rate does not mean residents will stay in the city if or when tax rates are increased significantly. In other areas, higher taxes will translate into more government services, better schools, and so on. In Chicago, they will be used to offset the costs associated with meaningless debt and unfunded pensions from a decade of fiscal mismanagement. That’s a huge difference and something to take into account.
The city has few assets left to sell
Chicago has already blown through the reserves it established from the Skyway and lease of its parking meters. It could try to hawk Midway Airport, but that has already failed three times.
The city’s other tax districts have their own problems
The Chicago Board of Education is also heavily indebted and its recent downgrade likewise triggered events of default. These will force the school system to pay penalty interest rates ranging from 9% to 13.5% and make swap termination payments. The board has significant unfunded pension liabilities and a $1 billion deficit.
Bonds are legally and likely politically subordinated to pension benefits
Some rulings in federal bankruptcy cases suggest that Chapter 9 could potentially be used to adjust pension liabilities. For that to happen, however, the municipality would have to want to adjust its pension liabilities. So far, when capital markets creditors have gone toe-to-toe with pension beneficiaries in court, they have walked away with massive haircuts.
Why is this happening? I see two (largely ignored) things driving outcomes in municipal bankruptcy cases where pensions are involved. The first is that courts neglect to situate claims in larger public policy contexts. Perhaps this is because some of the judges and law firms involved have mostly corporate restructuring experience and do not fully understand how public policy works. Perhaps it is just impossible the way Chapter 9 was drafted. Whatever the reason, the vocabulary of sacrifice in Chapter 9 cases has become quite mangled. The second is that Chapter 9 provides subtle opportunities for political rebalancing in regions where machine politics prevails. Let’s discuss these in turn.
The treatment of other post-employment benefits (i.e. health care) has been a land mine for capital markets creditors in Chapter 9 cases, whether they realize it or not. Bankruptcy judges have agreed with the municipalities that pension beneficiaries are “making sacrifices” when a plan of adjustment strips them of their health care benefits but leaves their income benefits intact.
It has become something of a farce that the courts fail to recognize and quantify the other forms of government assistance available to retirees in determining the scope of their sacrifices. In a post-Affordable Care Act world, a municipality shedding OPEBs is not an economic sacrifice — it is tantamount to transferring those commitments from local taxpayers to state and federal taxpayers. It does seem like a sacrifice from a contract perspective, however, which allows locals to say, “See what we gave up? Now it is your turn.”
This is sufficient logic for capital markets creditors to receive haircuts, which then provide the resources required for the city to honor its pension commitments. To the extent that there are future Chapter 9 cases, expect OPEBs to be the starting point for crafting a plan of adjustment going forward. It’s just too easy.
If one looks at these insolvencies from the standpoint of local politics, it is not difficult to see how capital markets creditors can end up in the crossfire between different interest groups. Market observers tend to talk about organized labor as if it were a unified whole. In reality, large city governments can have dozens of labor groups with different perspectives and connections. This can be a very big deal with respect to pension politics. Cities can have several different pension plans depending on employees’ affiliations with funded levels that vary according to influence. Pension contributions are appropriations and appropriations are political.
If a municipality can keep its income benefits whole by making a token sacrifice that “frees up” funds that would have otherwise gone to investors, then policymakers can realign the political interests of all of these groups. They are all finally back on equal footing with respect to what they are due from the government. This keeps the machine working like a machine. Considering that governments can wander down this path (and in Detroit’s case, with open contempt for its investors) and still have some borrowing options, it is not surprising that Chapter 9 cases remain tethered to local politics.
That’s a bit of a digression, but it is still instructive with respect to Chicago. Chicago bondholders could potentially be subjected to the same destructive politics, but they would be in a worse situation legally if the city’s credit continued to deteriorate. Chicago is not eligible to file for Chapter 9, which means bondholders would have seek remedies in state courts with resistance from all of the other stakeholders (who are local). The Illinois Supreme Court has elegantly subordinated their claims to pensions through its interpretation of the state constitution and has expressed indifference about the financial impact. Absent Chapter 9, there isn’t even the possibility of sharing resources.
Regardless of what one thinks about ratings divergence, the divergence between the rating agencies and market participants with skin in the game makes perfect sense. Bondholders have been repeatedly hosed for giving municipalities the benefit of the doubt in these circumstances.
How I regard financially challenged governments
Chicago’s fiscal emergency is the confluence of two distinct, but related, problems: (1) the city has made extraordinarily bad decisions for over a decade about how to manage its resources; and (2) the city has made extraordinarily bad decisions for over a decade about which financial products to use in borrowing money. Both the city and its school system used excessive amounts of short-term debt, variable rate debt, and interest rate swaps. They have also waited until it is too late (expensive) to transition their debt portfolio to a more sustainable structure.
Ester Fuchs points out in Mayors and Money: Fiscal Policy in New York and Chicago, a classic text on fiscal crises, that municipalities can “afford” (i.e., financially survive) decades of mismanagement as long as the municipality can service its debt. While I agree with this observation (cynical as it is), I believe financial innovation has introduced some notable twists.
A municipality can “afford” either protracted fiscal mismanagement or an unconventional debt structure. Municipalities that are dealing with both, however, tend to be screwed. As its credit deteriorates, resources that would have cushioned the municipality against mismanagement are instead diverted to resolving broken debt structures (until they aren’t).
In Chicago’s case, the city is going to have to learn how to function without most of the gimmicks that have helped it through the last decade. Many market observers underestimate how difficult that will be, even with steep tax increases. They also seem to believe city officials are capable of becoming intellectually honest overnight.
Chicago is hardly exploring new territory here. All of the recent insolvencies in the municipal bond market have combined protracted fiscal mismanagement with a reliance on innovative financial products (e.g., interest rate swaps and pension obligation bonds). This epiphany continues to elude many market participants, especially those who believe credit analysis is as simple as financial ratios.
Perhaps Chicago will successfully navigate through this storm, but it is insane to disregard the risk involved.
Let’s go back to DEEP VALUE, Chapter 5: A Clockwork Market: Mean reversion and the Wheel of Fortune.
As a value investor you are doing either:
Buying a franchise, where barriers to entry allow for profitable growth, before mean reversion sets in or
Buying assets where the normalized earnings’ power of those assets is below norm (Asset value = Earnings Power Value) and earnings’ power will mean revert to normal.
Therefore the concept of Regression to the Mean is powerful. By putting the words, “Many shall be restored that now are fallend and many shall fall that now are in honor” on the facing page of Security Analysis, Graham gave the most prominent position in his seminal text to the idea that Fortuna’s wheel turns too for securities, lowering those that have risen and lifting those that have fallen. The line, from Horace’s Ars Poetica, echoes the phrase spoken by the wise men of legend who boiled down the history of mortal affairs into the four words, “This too will pass.” This is regression toward the mean. (p. 79).
The more extreme the initial price movement, the greater will be the subsequent adjustment in the opposite direction. There tends to be a price trend before reversal. The reasons are manifold, but the most obvious is that the trials aren’t independent—our own trading decisions are affected by the buying or selling preceding our trade.
Two economists known for research into both market behavior and individual decision-making, Werner De Bondt and Richard Thaler, theorized that it is this overreaction to meaningless price movements that creates the conditions for mean reversion. Note page 800 in the link Does Stock Market Overreact— the loser and winner portfolios. Losers win out.
In a second study, Further Evidence of Inv Overreaction Thaler, Thaler and De Bondt revisited the research from a new perspective. They hypothesized that the mean reversion they obserbed in stock prices in the first study might have been caused by investors focusing too much on the short-term. this fixation on the recent past and failure to look beyond the immediate future would cause investors to miscalculate future earnings by failing to account for mean reversion. If earnings were also mean reversing, then extreme stock price increases and decreases might, paradoxically, be predictive of mean-reversion not just in stock prices, but in earnings too. A stock price that has fallen a great deal becomes a good candidate for subsequent earnings growth, a vice versa for a stock price that has gone up a lot. As you can see from the two research reports that the undervalued portfolio delivered better earnings and price performance.
The above research stand the conventional wisdom on its head and show compelling evidence for mean reversion in stocks in a variety of forms.
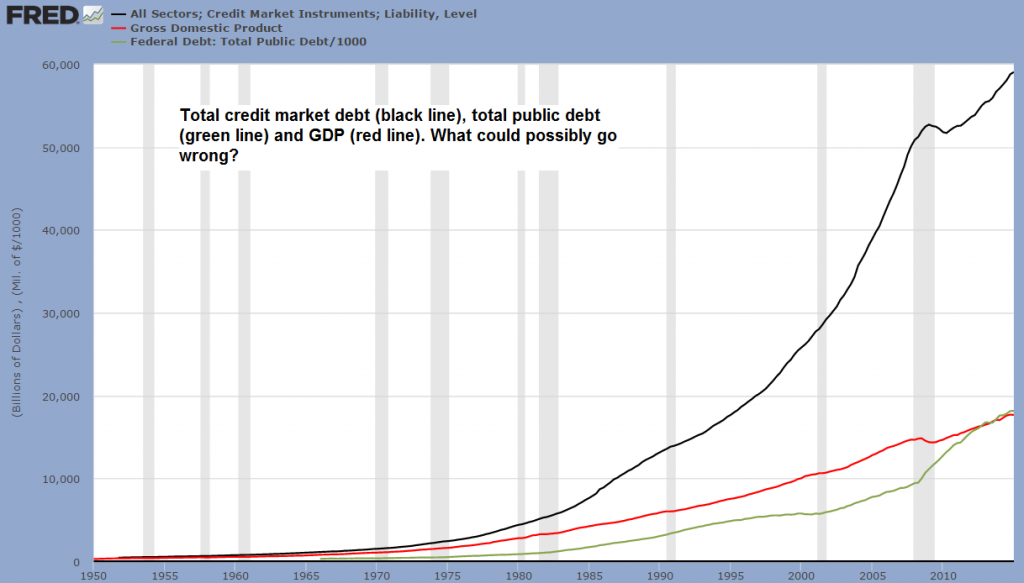
Buffett Discusses Mean Reversion in the Stock Market
In the 1964 to 1981 period, Buffett wrote, U.S. GNP almost quintuples, rising 373 percent. The market, by contrast, went nowhere.
The evidence is that valuation, rather than economic growth, determines investment returns at the market and country level. Research suggests that chasing growth economies is akin to chasing overvalued stocks, and generates disappointing results. See
The growth illusion
WHEN investors pick the countries they want to back, they tend to be guided by economic growth prospects. The faster an economy grows, they reason, the faster corporate profits will grow in the country concerned, and thus the higher the returns investors will achieve.
Alas, this is not the case. Work done by Elroy Dimson, Paul Marsh and Mike Staunton at the London Business School established this back in 2005. Over the 17 countries they studied, going back to 1900, there was actually a negative correlation between investment returns and growth in GDP per capita, the best measure of how rich people are getting. In a second test, they took the five-year growth rates of the economies and divided them into quintiles. The quintle of countries with the highest growth rate over the previous five years, produced average returns over the following year of 6%; those in the slowest-growing quintile produced returns of 12%. In a third test, they looked at the countries and found no statistical link between one year’s GDP growth rate and the next year’s investment returns.
Why might this be? One likely explanation is that growth countries are like growth stocks; their potential is recognised and the price of their equities is bid up to stratospheric levels. The second is that a stockmarket does not precisely represent a country’s economy – it excludes unquoted companies and includes the foreign subsidiaries of domestic businesses. The third factor may be that growth is siphoned off by insiders – executives and the like – at the expense of shareholders.
Paul Marson, the chief investment officer of Lombard Odier, has extended this research to emerging markets. He found no correlation between GDP growth and stockmarket returns in developing countries over the period 1976-2005. A classic example is China; average nominal GDP growth since 1993 has been 15.6%, the compound stockmarket return over the same period has been minus 3.3%. In stodgy old Britain, nominal GDP growth has averaged just 4.9%, but investment returns have been 6.1% per annum, more than nine percentage points ahead of booming China.
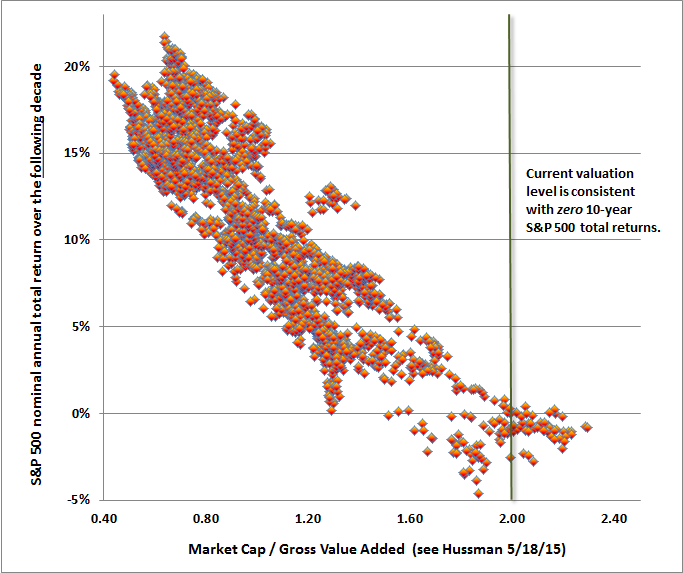
What does work? Over the long run (but not the short), it is valuation; the higher the starting price-earnings ratio when you buy a market, the lower the return over the next 10 years. That is why buying shares back in 1999 and 2000 has provided to be such a bad deal.
High Growth Depresses Future Stock Returns
Why does high growth seem to depress stock market returns and low growth seem to generate high stock market returns? The market ALREADY recognizes the high growth nation’s potential, and bids the price of its equities too high. Market participants become overly optimistic during periods of high growth, driving up the prices of stocks and lowering long term returns, and become too pessimistic during busts, selling down stocks and creating e conditions for high long-term returns. More research on that here:
I will finish this chapter in the next post. If you do not have DEEP VALUE or Quantitative Value, then join the deep value group found here: http://csinvesting.org/2015/01/14/deep-value-group-at-google/ and I will send.
If you only understand one concept besides Margin of Safety in investing then let it be Reversion to the Mean.
As a general rule….people ask for advice only in order not to follow it; or, if they do follow it, in order to have someone to blame for giving it. –Alexandre Dumas
Sprott Resources Corp. (SCP.TO or SCPZF)
In the recent first quarter report, SCP reported $2.06 Net Asset Value (NAV) as compared to a recent $0.99 cents (Cdn) market price or a 52% discount. The details can be found here:
As a recent investor attracted to the large discount, I find this investment ugly but cheap–like me! But I can’t own much, because I have no way to determine the intrinsic value of ALL the underlying investments held by Sprott. An investment that I own similar to Sprott is Dundee Capital Corporation. This letter/blog post will provide the suggestions of how to communicate to outside investors as partners and the lessons of great capital allocators. I see four ways to close the discount between market price and NAV:
Kill management at the holding company level.
Buyback shares in the open market or make a tender offer
Sell a fully-valued or poorly/unfixable investment and use the proceeds in another investment or buy-back shares.
Communicate to shareholders so they can close the gap between NAV and market price.
Point 1 is both illegal and immoral and thus a non-starter, but my black humor seeks to point out that the market may be wary of the prior or current management’s capital allocation skills. The market places a negative value on management at the holding company level or anticipates further declines in NAV.
Point 2: With only $2 million in cash or less than 1% of the NAV and with $1.7 million in commitments, $300,000 allows for less than 0.5% to be purchased. meaningless. Yes, debt could be taken on to buy-back shares, but where would be the margin of safety if a prolonged depression occurred? With global debt levels at 100,000 year highs, dislocation is not a low probability event.
Point 3: This is a capital allocation decision that can only be made by management.
Point 4: Communicate with your shareholders as partners who are investing every nickel into Sprott. If YOU were in their shoes what EXACTLY would you need to know? If you were reporting to your Aunt Millie once a year about her investment in SCP.TO, what would you tell her?
Rather than give you my suggestions why not learn from the best in the world at capital allocation?
“The Outsiders: Eight Unconventional CEOs and Their Radically Rational Blueprint for Success” tells the stories of eight successful chief executives. You will meet eight indivualistic, iconoclastic CEOs whose firms’ average returns outperformed the S&P 500 by a factor of twenty (no typo). Buy the book! Pdf here: Outsiders_ Eight Unconventional CEOs and Their Radicl Blueprint for Success, The – Thorndike, William N_