Question on ROE vs. ROCE; Comprehensive Look at EBITDA

EBITDA

http://greenbackd.com/2014/04/28/median-stock-at-all-time-high-valuation/ and an interesting look at margins here:

Respecting the Reality of Change

The following chart shows CPATAX divided by GDP from 1947 to present.  The black line represents the average from 1947 to 2002, and the green line represents the average from 2003 to 2013.

cptxa

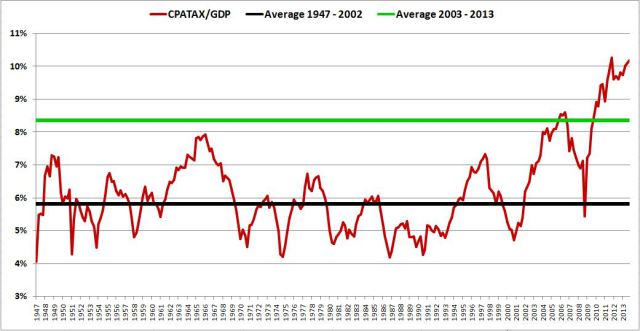
As you can see in the chart, CPATAX/GDP is wildly elevated at present.  It currently sits 63.3% above its average from 1947 to 2013, and a whopping 75.0% above its average from 1947 to 2002.

As readers of this blog have probably inferred by now, I’m not very patient when it comes to waiting for “mean-reversion” to occur.  In my view, when a variable deviates for long periods of time from a reversion pattern that it has exhibited in the past, the right response is to expect something important to have changed–possibly for the long haul, such that a predictable reversion to prior averages will no longer be readily in the cards.  The task would then be to find out what that something is, and try to understand it. Go here:

http://philosophicaleconomics.wordpress.com/
http://www.millennialinvest.com/   (Interesting blog)

Reader Question:

Can you help me understand one aspect of ROE? In Indian companies, some of the companies have ROE < ROCE.

Isn’t that a violation of the observation that ROE ~ ROCE times Leverage.

I define ROCE as Return on Capital Employed.

ROCE = EBITDA (1-Tax Rate)/Total Capital Employed (=Debt+Equity)

I use ROCE as a measure of the attractiveness of the industry and the company. High ROCE is good, implying a moat, low ROCE is not.

Some of the reasons I could think of are:

  1.  Exceptional losses, which lead to Net Income << EBIT(1-Tax) *Leverage
  2.  Extremely high interest charges. ( higher than return on the        debt portion) which leads Net Income << EBIT(1-Tax)* Leverage
  3.  There is a slump sale of a division, and thus suddenly huge            amount of profit has come in increasing inordinately the            average shareholder equity. So suddenly the effective leverage        has dropped.

Update May 1: 

I made a mistake in describing ROCE.  In my defense, I dont exactly calculate ROCE and merely use the numbers from screens.
ROCE = EBIT(1-Tax Rate)/ Total Assets and not EBITDA as mentioned before.

Does someone want to have a crack at this? I see issues whenever you use EBITDA without understanding maintenance capex. Please read this: Placing EBITDA into Perspective

More on WMT: A reader posted this in the comment section: http://www.fool.com/investing/general/2014/04/28/why-is-wal-mart-failing-in-emerging-markets.aspx.    Does that article even touch upon the ture nature of WMT’s competitive advantage?  No wonder the obvious is overlooked.

Embracing Failure and Getting Obliterated in the Stock Market

AMZN

“Money, again, has often been a cause of the delusion of the multitudes. Sober nations have all at once become desperate gamblers, and risked almost their existence upon the turn of a piece of paper.” —Charles Mackay

You can’t learn without failure. Listen to this interview on the secrets of failing.

http://www.econtalk.org/archives/2014/04/mcardle_on_fail.html

About this week’s guest:

About ideas and people mentioned in this podcast episode:

Books:

Articles:

    • Creative Destruction, by W. Michael Cox and Richard Alm. Concise Encyclopedia of Economics.
    • Disaster and Recovery, by Jack Hirshleifer. Concise Encyclopedia of Economics.
    • Crime, by David D. Friedman. Concise Encyclopedia of Economics.

Web Pages and Resources:

Podcast Episodes, Videos, and Blog Entries:

Obliterated in the stock market (or the Perils of Momentum investing)

Before I sell everything and fire myself from ever managing money again, I’d like to share with you some of the percentage gain losses, from 8 WEEKS AGO to now, of some of 2013′s favorite stocks.

EXEL -58%

HALO -57%

IMPV -55%

RPTP -52%

GIMO -45%

BNFT -51%

CLDX -50%

FUEL -46%

ALNY -40%

YNDX -40%

DDD -38%

Read more: http://www.businessinsider.com/the-fly-out-2014-4#ixzz30C8MG0bc

A look at a Brazilian Turn-around Value Investor: https://www.santangelsreview.com/2014/04/28/book-review-and-lessons-from-dream-big-a-glimpse-inside-the-strategies-and-tactics-of-3g-capital/

www.santangelsreview.com

See more: https://www.santangelsreview.com/2013/09/20/transcript-of-a-speech-by-jorge-paulo-lemann/

Businessweek has called him “the world’s most interesting billionaire” and Warren Buffett once said he was an “extraordinary manager.” However, despite purchasing three of the most iconic brands in America–Heinz, Burger King, and Budweiser–and building a tremendous track record as an investor and operator, Jorge Paulo Lemann remains virtually unknown. This is in no small part a function of his reluctance to comment to the press or speak publicly.

However, a few years ago, Lemann gave a speech to prospective Harvard students which was then uploaded to YouTube. The speech, which was delivered entirely in Portuguese, was entitled “What I Learned at Harvard.” In it, Lemann recounts his experience nearly getting thrown out of school at the end of his freshman year, his return the next year determined to succeed, and many of the lessons he learned as an undergraduate that he believes formed the framework for his later business success. Besides a few brief comments in various periodicals over time, as far as I can tell, this has been his only public speaking appearance in recent years. And for the first time it is accessible in English as I’ve had it translated and transcribed. It truly is a great speech from a fascinating investor.

Wal-Mart Case Study Part 3

DRUNK

Part 3:Valuation of WMT,

Part 2:  http://wp.me/p2OaYY-2nB and

Part 1:  http://wp.me/p2OaYY-2np

Stock Splits

Wal-Mart Stores, Inc. was incorporated on Oct. 31, 1969. On Oct. 1, 1970, Walmart offered 300,000 shares of its common stock to the public at a price of $16.50 per share. Since that time, we have had 11 two-for-one (2:1) stock splits. On a purchase of 100 shares at $16.50 per share on our first offering, the number of shares has grown as follows:

2:1 Stock Splits Shares Cost per Share Market Price on Split Date Record Date Distributed
On the Offering 100 $16.50
May 1971 200 $8.25 $47.00 5/19/71 6/11/71
March 1972 400 $4.125 $47.50 3/22/72 4/5/72
August 1975 800 $2.0625 $23.00 8/19/75 8/22/75
Nov. 1980 1,600 $1.03125 $50.00 11/25/80 12/16/80
June 1982 3,200 $0.515625 $49.875 6/21/82 7/9/82
June 1983 6,400 $0.257813 $81.625 6/20/83 7/8/83
Sept. 1985 12,800 $0.128906 $49.75 9/3/85 10/4/85
June 1987 25,600 $0.064453 $66.625 6/19/87 7/10/87
June 1990 51,200 $0.032227 $62.50 6/15/90 7/6/90
Feb. 1993 102,400 $0.016113 $63.625 2/2/93 2/25/93
March 1999 204,800 $0.008057 $89.75 3/19/99 4/19/99

So the price on August 1974 when a 2 for 1 stock split occurred was $23.

What price would I have paid? I would see 38% ROE with little debt ($10.5 mil.) with 40%+ growth. If I paid 4 times the book value of approx. $31 mil. Plus the debt of $10.5 million ( I would not subtract the cash since I assume it is all needed as working capital) or $124 mil. plus $10.5 mil. or $135 million. Divide by $6.542 mil. shares or $20.63 per share or $21 to round up. $23 to $25 was near the highs for 1975 in the fourth quarter but the price was below $20 in the first quarter of 1975. Could I have bought right after the largest decline in stock market history after the Great Depression and with inflation raging? If I knew the value and rarity of an emerging franchise perhaps. But I doubt it.

I would have paid 4 times book value (better is replacement value but this is back of envelope investing) to garner a 9% return but the long term growth of 5% to 6% would give me my required 15% return. Obviously, if I had paid double, that would have been fine.

The key is in recognizing the source of WMT’s competitive advantage and how large the market opportunity to exploit that advantage. The secret is on page 10 of the 1974 WMT annual report 1974-annual-report-for-walmart-stores-inc and on page 11 here: WAL-MART CASE STUDY on Discount Operations 1986 (email aldridge56@aol.com if that link is taken down) and ask for the case study.

Note that you would have had to hold on through thick and thin without selling on numerous “market” scares, crashes and fears.  You have the key to becoming rich in investing but now you know why investing is SIMPLE BUT NOT EASY!

If you have questions post them on this blog do NOT email them to me. Thanks.

Hannibal Lecter Analyzes Wal-Mart (Part 2)

Social Networking

The prior post asked you to guess the name and price that you would pay for this case study: http://wp.me/p2OaYY-2np (Part 1)

It is WALMART  Annual:1974-annual-report-for-walmart-stores-inc. If you had paid the HIGHEST possible market price in 1974 or the first quarter of 1975 (after reading this annual report),  you would have about 1, 300 times your money over 40 years not including annual dividends which today stand at about 31 times what you paid in the market (WMT 2014) through and despite wars, high inflation, double-digit interest rates, civil unrest, political changes and a mundane, extremely competitive industry, AND WMT’s stock price “UNDER-performing” the general stock market one-third of the time. See Wal-Mart 50 Year Chart_SRC.

Eat your heart out Buffett, Munger, Peter Lynch, and all other investing pantheons. The point is you would have made a lifetime fortune sitting on your hands for more than a third of a century. WMT is the pinnacle of an investment–a relentless compounding machine.  Buffett said the goal of an investor is to put together a portfolio of compounding machines.

Well, Wal-Mart was the king of compounders; a company that could generate high returns on capital AND reinvest those high returns into similar high returns.  As many of you know, it is easy to spot a company with high ROIC or ROE but how do you know if the company can grow and reinvest those high returns at the same high rates? If not, then that company should return the excess capital which it can’t reinvest to you through dividends or appropriate (below intrinsic value) stock buy-backs.

You could have paid any price in 1974, 1975, 1976, 1977, 1978, 1979 and generated over-15% annual returns.  How would you know that WMT would keep growing with such high returns? What could you have KNOWN? What can we use for tomorrow’s investments?

AT Hindsight Capital (my firm) we always pick the Wal-Marts.

Joking aside, what is the point of this case study and what are the lessons we can use?  Let’s be realistic, we may never find another “Wal-Mart” but at least we can study “perfection” or the best to grasp what principles to look for in a company and an investment. You could do worse than spend weeks or months studying the history of Wal-Mart. Start here Walmart.com/annual-reports and go to here: WalMart_AR. And read: Sam-Walton-Made-America.

What’s the point of viewing one of THE best?

Hockey Player http://youtu.be/gpDdaC1_UGg

NY Giants Lawrence Taylor on the loose: http://youtu.be/puV3z9_gb9g?t=2m56s

Playing the Piano: http://youtu.be/R-JjzU1ZwXE

You gotta at least see and hear excellence to know it.

Let’s get back to Wal-Mart. What is the essence–the key–to its ability to grow profitably for so long? What can you spot in the 1974 annual report that would have alerted you to its competitive advantage? In other words, follow Hannibal Lecter’s tutelage when analzing any investment: What is its nature? http://youtu.be/f33ieCWRWlI.

Here are two hints:

Sam Walton‘s passions included flying his own plane over the American countryside, hunting with his dogs, and sharing his good fortune with his family. But Walton will always be best remembered for his lifelong passion for providing low prices and good service to customers at Wal-Mart, his chain of discount stores that revolutionized the retail industry.

Walton did not invent the discount store when he opened his first store in 1962. But he did do something new. Wal-Mart introduced the concept of selling a large number of items at cheap prices to residents of rural towns—customers other discount retailers ignored. From that base, Walton expanded Wal-Mart across the United States and eventually reached into foreign markets, using the latest technology to keep costs low.

“I think I overcame every single one of my shortcomings by the sheer passion I brought to my work.… If you love your work, you’ll be out there every day trying to do it the best you possibly can.” Read more: Walton

The second hint is that you will not see the financial results of WMT’s competitive advantage in its GROSS margins but in its NET margins. WHY?

The answer to my questions can be found in Competition Demystified (Chapter 5) but don’t cheat yourself. Think it through. In fact, if YOU wanted to get a job at hedge fund, investment firm or even work for a major service firm, you could do a comprehensive study of Wal-Mart’s rise and semi-fall of its competitive advantage and then find a new company or industry (Auto-parts?) where the same factors are at work.  Show what you can do while providing a study of value.  You will stand out from all the Harvard and Columbia MBAs.

I will post in Part 3: Analysis on WMT next week. Meanwhile focus on what is important.

How Markets Work (Trading Places) http://youtu.be/1tmI867fAYU?t=59s

HAVE A GREAT WEEKEND!

Paying for Growth? Case Study

nonsequitur_sheep_opt

What Price for the whole business would YOU pay? Then tell me the per share price.  The company had operations for 25 years prior to going public. The company’s stock price will under perform the market (SPY) about 1/3 of the time over the next forty years.


BUSINESS XXX? 1974 1973 1972 1971 1970
Cash $2,238,263 $2,168,224
Working capital 27,132,580 16,796,897
LT Debt ** 10,578,269 5,065,567
Shareholders’ Equity 30,734,128 $24,753,623
Outstanding Shares 6,542,250 6,512,950
Net Sales $167,560,892 $124,889,141 78,014,164 44,286,012 30,862,659
Income Bef. Taxes 11,883,754 8,917,188 5,569,027 3,170,599 2,198,764
Pro-forma Net Income $6,158,520 4,591,469 2,907,354 1,651,599 1,187,764
EPS $0.93 $0.70 $0.47 $0.30 $0.23
Units in operation 78 64 51 38 32
ROE 38.67% 36.02%
** Co. has a $12 mil. Credit line renewed yearly of which it has borrowed $4 mil.
Assume Co. needs all cash for operations
Assume strong growth for 40 years.You need a required rate of return of 15%

XXX Company Worksheet (Excel Spreadsheet)

Can you guess the actual name of the company?

To give you some historical perspective of 1974 see:A Study of Market History through Graham Babson Buffett and Others

Winner gets a date with my Ex: http://youtu.be/E55ni_xc4ww  (PLEASE do NOT click on the link unless you win the prize)


Keys to A Few Value Vaults

Click on VIEW FOLDER and there are many books, cases, and more. Let me know if you wish more posted. Here are a few vaults.

Books View Folder
VV_CS_Inv View Folder


UPLOAD_Contributors View Folder

Value Vault Update; Information Overload and Investing

VALUE VAULT UPDATE

Many have recently asked for keys to the Value Vaults. Unfortunately many keys have expired, therefore they need to be refreshed. I plan to have new keys for all by Monday so check back.

Meanwhile, new investors can learn from this story about Matt Drudge and information overload–very applicable for investors.

See: http://www.mises.org/media/8340/Matt-Drudge-and-Information-Overload

Gold Discipline Melts Away or Case Study in Reading the News

This morning I read the news…Oh boy!  –The Beatles

(Editor: Read the following article and ask how YOU, as a reader or investor whether you have no opinion; are hyper bearish or hyper bullish gold or miners, benefit. Is there a particular BIAS? Finally, what is the main question you want answered? So what is the acquisition __________?  Prize awarded.

Gold Discipline Melts Away from Heard On The Street Column (WSJ April 17, 2014)

And they were doing do well. The intensifying battle of Osisko Mining is fast undoing gold miners’ work to restore credibility.

Wednesday Yamana Gold raised its offer to 8.15 Canadian dollars (U.S. $7.42) a share, this time roping in Agnico-Eagle Mines as a joint bidder, valuing Osisko at C$3.9 billion. Goldcorp raised its own bid to C$7.65 a share last week.

Takeover battles, with their risk of overpaying, are always unnerving for investors in the bidders. With gold miners thate is added concern: The sector has dropped about two-thirds since September 2011 as a history of overpriced deals an busted investment budgets caught up with it.

Miners have worked to address this, cutting costs and investment and, in many cases changing top management. Citigroup estinmates the average all-in cash cost per ounce, which includes things such as capital expenditure, fell by a fifth last year.

It remains more than $1,400 an ounce, though–still above today’s gold price of about $1,300. So this is no time to succumb to the old ways. Yet, even before Wed, both Yahmana and Goldcorp had made offers dilutive to their own value, ssays adam Graf at Cowen. That they are engaging in this now suggest talk of discipline is just that–or that their own project pipelines aren’t as robust as though.

Osisko’s stock now trades at C$7.94, and the break fee on the latest bid is worth 44 Canadian cents a share. To counter, Goldcorp would have to raise its bid roughly C$1, or 13%.

It should resist the temptation, but may not. One thing is clear. With the recently rediscovered discipline now apparently crumbling, it makes more sense to own junior gold miners, the potential targets, then their bigger rivals. –Liam Denning.

I will post my “answer” this weekend. Your thoughts?

Editor: Also, this article should spur you to do a valuation of Detour (DRGDF)–hint! hint! See: http://wp.me/p2OaYY-2m2

536584-13976660696117253-Dave-Kranzler

Note the extreme tightness for leasing gold. See: Gofo It will be interesting to see if gold can continue to decline in the face of bullion demand. Leasing rates are close to the most negative since mid-August 2013 when gold rallied to $1,400.

You can update your charts with the gold price vs. 1 month and 3 month GOFO rates.  Is this the canary in the coal mine for financial stress? Gofo Rates and Gold.  Low interest rates mean–all things being equal–gofo rates would be lower, But negative rates can ONLY mean two things:

  1. Investors don’t want to lend their gold because of counter party risk
  2. and/or they don’t have the gold.

Blog for special situations

http://www.cablecarcapital.com/blog/

Anniversary Day for the April Gold Massacre

04-14-2014_GOFO_cleaned (1)

The paradox in investing hinges on the tension between having both the strength of one’s convictions and the intellectual flexibility necessary to admit, relatively quickly, when one is wrong.–Unknown

In the absence of the gold standard, there is no way to protect savings from confiscation through inflation. There is no safe store of value. If there were, the government would have to make its holding illegal, as was done in the case of gold. If everyone decided, for example, to convert all his bank deposits to silver or copper or any other good, and thereafter declined to accept checks as payment for goods, bank deposits would lose their purchasing power and government-created bank credit would be worthless as a claim on goods. The financial policy of the welfare state requires that there be no way for the owners of wealth to protect themselves.

This is the shabby secret of the welfare statists’ tirades against gold. Deficit spending is simply a scheme for the confiscation of wealth. Gold stands in the way of this insidious process.  It stands as a protector of property rights. If one grasps this, one has no difficulty in understanding the statists’ antagonism toward the gold standard.  Alan Greenspan (1966) http://www.321gold.com/fed/greenspan/1966.html

There are two ways to conquer and enslave a country. One is by the sword. The other is by debt. –John Adams, 1735-1826

When you consider the rate at which public debt is increasing, along with the fact that so many countries around the world instituted their own versions of quantitative easing (i.e. printing money) while increasing debt levels, these conditions are unprecedented. We have found NO HISTORICAL example of so many major countries simultaneously engaged in quantitative easing. Just ten years ago we would not have thought such an economic environment even possible. –Arnold Van Den Berg, Feb. 21, 2014

Gold Massacre

Today’s price decline in gold is probably a gift for the long-term buyer. A year ago on tax day the gold market had a large sell-off with rising demand from China.  big gld

Today, gold gets sold off $35 in the New York open, because demand from China is falling due to weakening money supply, credit stress and ?? What else can we make up?  China is relentlessly accumulating gold.

small GLD

However, 2014 is far different in market structure than 2013. 900 tons have already been removed from gold ETFs and demand to hold gold is greater than cash based on negative GOFO rates–see chart at the top and read here: http://www.tfmetalsreport.com/blog/5663/plunging-gofo-rates

Take a look at the negative rates here: http://www.lbma.org.uk/pricing-and-statistics.  An article discussing gold’s anniversary day: http://www.321gold.com/editorials/thomson_s/thomson_s_041514.html

http://investmentresearchdynamics.com/todays-gold-price-take-down-operation-has-the-smell-of-desperation/

The cause of today’s sell-off is not manipulation, contrary to the howls from goldbugs, but traders getting ahead of possible collateral issues tied to swap agreements:http://www.alhambrapartners.com/2014/04/15/the-inconvenient-marriage-of-yuan-and-gold/  So, gold prices could continue to be pressured–welcome to markets. Which force will be greater?

Valuation

Has anyone has attempted a valuation of Detour Mines (DRGDF) mentioned in this post: http://wp.me/p2OaYY-2m2? I won’t post my valuation until the $500,000 prize is awarded.

My quarterly report (The Horror!) :Gold and Miners_April First Qtr Report

A reader wished to share a report on investing in materials:  Fortnightly_Thoughts_-_14_04_14_-_Materials

Simple Discussion of Austrian Business Cycle Theory

Head or tails

An excellent discussion of how and why ABCT works.  Note that the speaker, David Howden, says the middle stages of production (like building infrastructure and maintaining stores) are declining now.  Excellent!

ThinkerAUDIO http://fetch.noxsolutions.com/tomwoods/audio/woods_03_17_2014_2.mp3    Just copy and past into your browser. Thirty minute audio.

David Howden, economist, articles: http://ideas.repec.org/f/pho322.html and http://mises.org/daily/author/1259/

Global Meltdown?  http://www.caseyresearch.com/lg/meltdown-video  Thoughts?