Category Archives: Risk Management

The New York Times: Buy, Sell or Pray?

Dating Mode


Case Study

Read the earnings release and translate what management is really saying. 1Q_2013_Earnings then view  NYT_VL.

Your assessment in a paragraph or two. This should take no more than fifteen minutes.  Would you buy, sell or pray?  What say you on the outlook for the “Grey Lady?”  Why?

Postscript: A reader submits an A+ response:

Nearly every metric that should be increasing has declined and vice versa.  Management is trying to put lipstick on a pig.  (CSInvesting: You have captured the jist!)

Print and digital advertising revenues decreased 13.3 percent and 4.0 percent, respectively, largely due to ongoing secular trends and an increasingly complex and fragmented digital advertising marketplace. In the first quarter of 2013, digital advertising revenues were $46.5 million compared with $48.5 million in the 2012 first quarter. Digital advertising revenues as a percentage of total Company advertising revenues were 24.3 percent in the first quarter of 2013 compared with 22.5 percent in the first quarter of 2012.

This paragraph really speaks to me.  Management admits that the business is fundamentally changing, and not necessarily for the better.  Ad rev was down even though it makes up a larger portion of overall revenue.  That says there are some fundamental issues with the industry.  NYT would have to go in the “too hard” pile, because based on this commentary, I don’t feel like I’d know where the business would be in 5 or ten years from now.  Also, ongoing pension funding cannot be a good thing.  I don’t think newspapers are going away, but they will become more of a novelty and read just because people “like the feel of holding a paper.”  I don’t like to read everything online, so I just print stuff out, but on occasion I like to pick up a paper copy of WSJ or Barron’s just for fun.  But that’s just me.  Also I felt like they were selling business lines and investments to stay afloat, i.e. sale of Fenway Sports units? (Clear the decks of the Titantic)

From Value Line:

  1. Sales per share: down every year since 2005.
  2. Cash flow per share: seems to have peaked in 2000 and been choppy with downward trajectory every year since.
  3. Dividend: eliminated in 2009 and no indication its coming back.
  4. Capital Spending per share: they did make significant progress in reducing spending by shifting to digital driven model around 08.
  5. Shares outstanding: share count higher now than it was in 2004. Margins: stayed the same even though cap ex decreased dramatically.

CSInvesting: I would mention the poor returns on capital for such a large and established business, sub 10% means that the market price should NOT be much above its asset value. Poor returns on assets means that growth won’t help increase value.

Business in secular decline, management has no clue to change that, but they will try obviously, poor returns on capital with increasing pressure on margins.
Pray!

The person submitting the best reply gets to work here: 

Update on a Reader’s Question About Investing; Greenblatt Offers Advice

Junk Food

A reader asks what to do with his $150,000: http://wp.me/p2OaYY-1TE. This post is a follow-up.

First, I would do nothing until you know what you are doing. As Jim Rogers said, “Don’t do anything until you see money laying in the street.” WAIT. You can’t ask other people to value companies for you. You either learn to do that yourself within your circle of competence (The Goal of CSinvesting.org) or you find a low-cost way to be in equities.

My advice: avoid high fees. That nixes most mutual funds, hedge funds and managed money. Read more:http://www.zerohedge.com/news/2013-04-29/wall-street-rentier-rip-index-funds-beat-996-managers-over-ten-years

Keep it simple.  There are four asset classes (Read The Permanent Portfolio)41f5oFGYTqL__SL160_PIsitb-sticker-arrow-dp,TopRight,12,-18_SH30_OU01_AA160_Equities, Bonds, Cash, and Gold

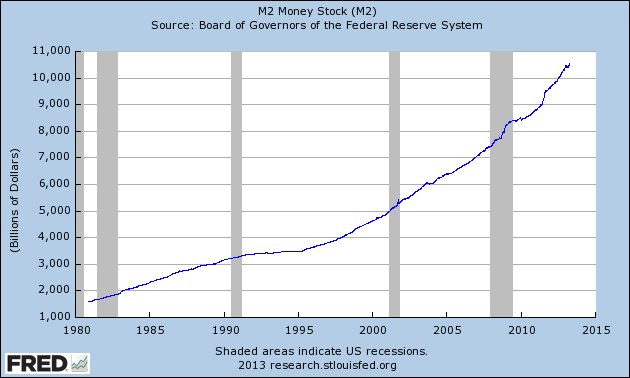
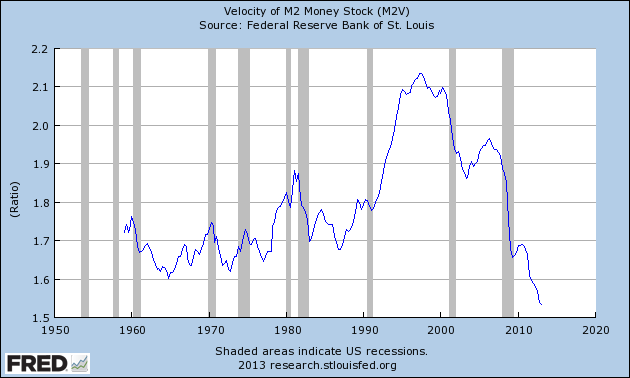
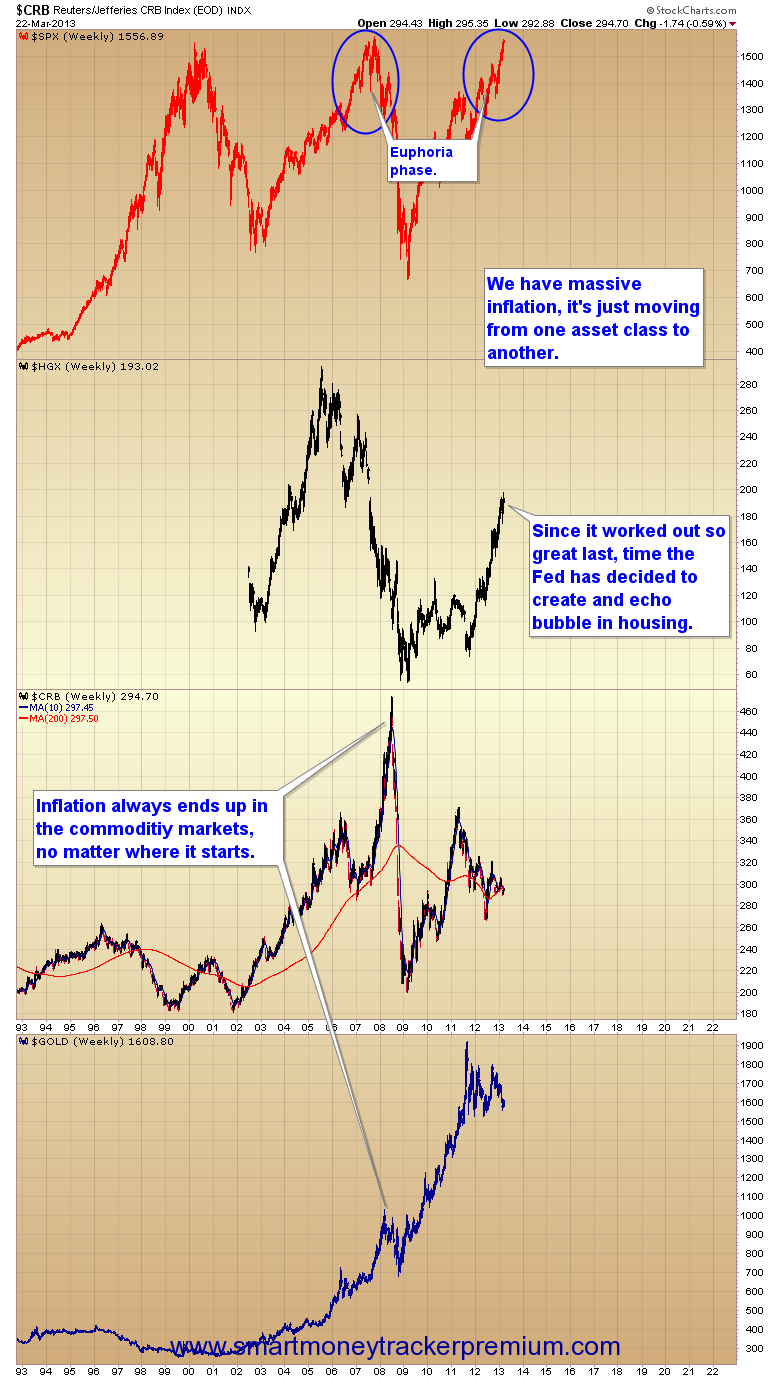
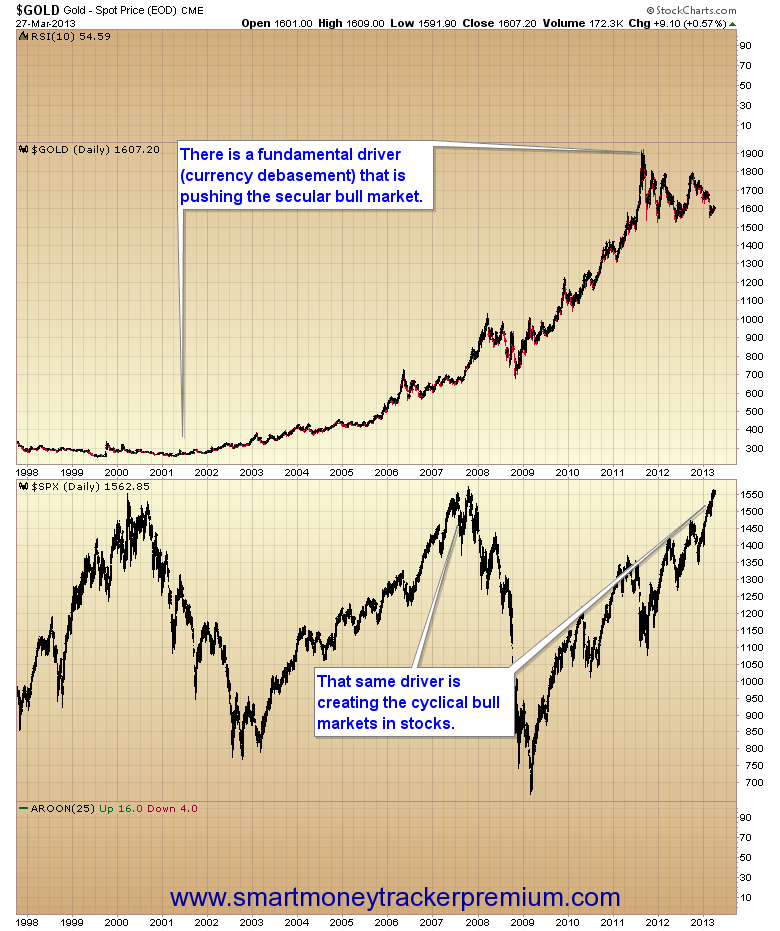
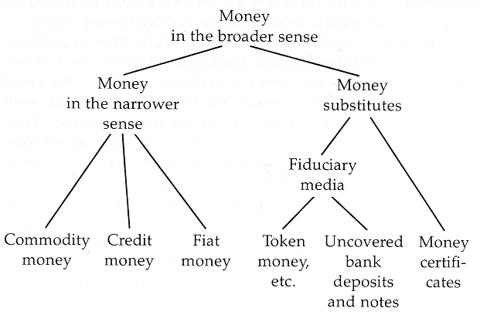
I love finding undervalued businesses, but we live in a world of monetary distortion of fiat currency wars (Japan), suppressed interest rates, hidden risks and massive debasement so I would have 5% up to 25% in gold as an insurance policy to maintain the purchasing power of my savings. Gold coins from a reputable dealer should be part of that.  Buying CEF at a discount would be another low cost way to own bullion. Gold is just a commodity money that holds its value over centuries and it can’t be printed nor does it have liabilities (counter-party risk) like fiat currencies.  Another way to approach it might be avoid oversupply (dollars) and buy undersupply (money that can’t be printed).  Don’t take my word for it. What did an oz of gold purchased 200 years ago, 100 years ago, 50 years ago and 20 years ago? Choose a man’s suit, a night at a decent hotel and a meal as items to consider.  Learn more here: http://www.garynorth.com/public/department32.cfm Follow the links to the free books and reports on gold, you will learn alot. 

Now, I own some gold coins but I don’t count investments like Seabridge Gold (SA) as an insurance policy, but as an investment in gold. I can own an oz in the ground for $10 in enterprise value per share. Of course, there are plenty of risks to get an oz of gold out of the ground, but I think there is some margin of error.  But I don’t recommend this strategy for others due to the need to diversify highly, know the industry, and the tremendous volatility.

Government bonds are a mass distortion on the short end and as long as other governments will hold our dollars this game can continue a long time. I would stay within a laddered bond portfolio of no more than seven years so WHEN interest rates rise, you can roll into higher yields. I would do this if you have to have cash in three to four years, and you are hedging your portfolio with this different asset class.  But I think of government bonds as return-free risk.  You take on risk for tiny returns. Welcome to financial repression. The Fed is punishing savers to fund the government. Corporate bonds require you to be able to read balance sheets so you are adequately paid for th credit risk.

If you are willing to do some work and have the temperament, then here is one way to invest in equities besides an index fund as Buffett has suggested:

The Eternal Secret of Successful Investing

A Little Wonderful Advice from Where Are The Customer’s Yachts? by Fred Schwed, Jr., 1940 (pages 180-182)

For no fee at all I am prepared to offer to any wealthy person an investment program which will last a lifetime and will not only preserve the estate but greatly increase it. Like other great ideas, this one is simple:

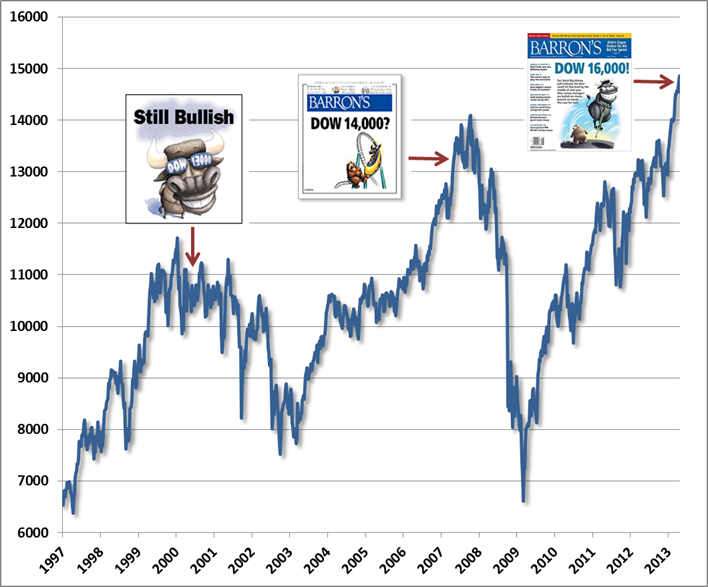
When there is a stock-market boom, and everyone is scrambling for common stocks, take all your common stocks and sell them. Take the proceeds and buy conservative bonds. No doubt the stocks you sold will go higher. Pay no attention to this—just wait for the depression which will come sooner or later. When this depression—or panic—becomes a national catastrophe, sell out the bonds (perhaps at a loss) and buy back the stocks. No doubt the stocks will go still lower. Again pay no attention. Wait for the next boom. Continue to repeat this operation as long as you live, and you will have the pleasure of dying rich.

A glance at financial history will show that there never was a generation for whom this advice would not have worked splendidly. But it distresses me to report that I have never enjoyed the social acquaintance of anyone who managed to do it. It looks as easy as rolling off a log, but it isn’t. The chief difficulties, of course, are psychological. It requires buying bonds when bonds are generally unpopular, and buying stocks when stocks are universally detested.

I suspect that there are actually a few people who do something like this, even though I have never had the pleasure of meeting them. I suspect it because someone must buy the stock that the suckers sell at those awful prices—a fact usually outside the consciousness of the public and of financial reporters.   An experienced reporter’s poetic account in the paper following a day of terrible panic reads this way:

Large selling was in evidence at the opening bell and gained steadily in volume and violence throughout the morning session. At noon a rally, dishearteningly brief, took place as a result of short covering. But a new selling wave soon threw the market into utter chaos, and during the final hour equities were thrown overboard in huge lots, without regard for price or value.

The public reads the papers, and reading the foregoing, it gets the impression that on that catastrophic day everyone sold and nobody bought, except that little band of shorts (who most likely didn’t exist).   Of course, there is just no truth in that at all. If on that day the terrific “selling” amounted to seven million, three hundred and sixty-five thousand shares, the volume of the buying can also be calculated.   In this case it was 7,365,000 shares.

CASE STUDY

How Mr. Womack Made a Killing by John Train (1978)

The man never had a loss on balance in 60 years.

His technique was the ultimate in simplicity. When during a bear market he would read in the papers that the market was down to new lows and the experts were predicting that it was sure to drop another 200 points in the Dow, the farmer would look through a S&P Stock Guide and select around 30 stocks that had fallen in price below $10—solid, profit making, unheard of companies (pecan growers, home furnishings, etc.) and paid dividends. He would come to Houston and buy a $25,000 “package” of them.

And then, one, two, three or four years later, when the stock market was bubbling and the prophets were talking about the Dow hitting 1500, he would come to town and sell his whole package. It was as simple as that.

He equated buying stocks with buying a truckload of pigs. The lower he could buy the pigs, when the pork market was depressed, the more profit he would make when the next seller’s market would come along. He claimed that he would rather buy stocks under such conditions than pigs because pigs did not pay a dividend. You must feed pigs.

He took “a farming” approach to the stock market in general. In rice farming, there is a planting season and a harvesting season, in his stock purchases and sales he strictly observed the seasons.

Mr. Womack never seemed to buy stock at its bottom or sell it at its top. He seemed happy to buy or sell in the bottom or top range of its fluctuations. He had no regard whatsoever for the cliché’—Never send Good Money After Bad—when he was buying. For example, when the bottom fell out of the market of 1970, he added another $25,000 to his previous bargain price positions and made a virtual killing on the whole package.

I suppose that a modern stock market technician could have found a lot of alphas, betas, contrary opinions and other theories in Mr. Womack’s simple approach to buying and selling stocks.   But none I know put the emphasis on “buy price” that he did.

I realize that many things determine if a stock is a wise buy. But I have learned that during a depressed stock market, if you can get a cost position in a stock’s bottom price range it will forgive a multitude of misjudgments later.

During a market rise, you can sell too soon and make a profit, sell at the top and make a very good profit. So, with so many profit probabilities in your favor, the best cost price possible is worth waiting for.

Knowing this is always comforting during a depressed market, when a “chartist” looks at you with alarm after you buy on his latest “sell signal.”

In sum, Mr. Womack didn’t make anything complicated out of the stock market.   He taught me that you can’t be buying stocks every day, week or month of the year and make a profit, any more than you could plant rice every day, week or month and make a crop. He changed my investing lifestyle and I have made a profit ever since.

Keep this a secret!

Of course after reading those pieces, you realize there is no secret to investing.   All the principles are laid out in Security Analysis and The Intelligent Investor by Benjamin Graham. The application and evolution of value investing principles are laid out each year in Mr. Buffett’s shareholder letters. The study, application and discipline are up to you, but then who would want it any other way?

JOEL GREENGreenblatt Offers Advice

The BIG SECRET for the Small Investor: A New Route to Long-Term Investment Success by Joel Greenblatt (2011)

When investors decide to invest in the stock market they can:

  1. Do it themselves
  2. Give it to professionals to invest.
  3. They can invest in traditional index fund
  4. Or they can invest in fundamentally constructed indexes (recommended)

If brains, dedication and MBA degrees won’t help you beat the market, what will?

The secret to beating the market is in learning just a few simple concepts that almost anyone can master. These concepts serve as a road map that most investors simply don’t have.

Most people CAN do it. It is just that most people won’t. Why?

Understand where the value of a business comes from, how markets work and what really happens on Wall Street will provide important conclusions.

The BIG SECRET to INVESTING:  Figure out the value of something—and then pay a lot less. Graham called this “investing with a margin of safety.”

In short, if we invest without understanding the value of what we are buying, we will have little chyance of making an intelligent investment.  The value of an investment comes from how much that business can earn over its entire lifetime. Discounted back to a value in today’s dollars.  Earnings over the next twenty or thirty years are where most of this value comes from. Earnings from next quarter or next year represent only a tiny portion of this value. Small changes in growth rates or our discount rate will lead to large swings in value.

Then there is relative value. What business is the company in? How much are other companies in similar businesses selling for? Looking at relative value makes complete sense and is an important and useful way to help value businesses. Unfortunately, there are times when this method doesn’t work well. The Internet bubble of the late 1990s, when almost any company associated with the Internet traded at incredibly high and unjustifiable prices. Comparing one Internet company to another wasn’t very helpful.

In the stock market this kind of relative mispricing happens. An entire industry, like oil or construction, may be in favor because prospects look particularly good over the near term.  Yet when an entire industry is misprices (like the capital goods sector during a boom), even the cheapest oil company or the least expensive construction company may bge massively overpriced!

There are other methods such as acquisition value, liquidation value, and sum of the parts, can also be used to help calculate a fair value.

By now you know it is not so easy to figure out the value of a company.  How in the world do we gho about estimating the next thirty-plus years of earnings and, on top of that, try to figure out what those earnings are worth today? The answer is actually simple: We don’t.

We start with the assumption that there are other alternatives for our money.   Say we can get 6%[1] for ten years from a government bond compared to a company paying a 10% earnings yield. One is guaranteed and the other is variable—which do we choose? That depends upon how confident we are in our estimates of future earnings from the company we valued or what other companies can offer us in return.

We first compare a potential investment against what we coulde earn risk-free with our money. If we have high confidence in our estimates and our investment appears to offer a significantly higher annual return over the long term than the risk free rate, we have passed the first hurdle. Next we compare our investment with our other investment alternatives.

If you can’t value a company or do not feel confident about your estimates, then skip that company and find an easier one to value.

In the stock market no one forces you to invest. Focus on those companies you can evaluate.

One way to win in the stock market game is to fly a little below the radar, to buy share in smaller companies where the big boys dimply can’t play.  So investing in smaller capitalization stocks is a game involving thousands of companies worldwide, and most institutions are too big to play.

So not having billions of dollars to invest is a great way to gain an edge over the big Wall Street firms. Also, find 6 to 10 companies where you have a high degree of condidence in the prospects for future earnings, growth rates, and new industry developments.

According to Buffett, “We believe that a policy of portfolio concentration may well decrease risk if it raises, as it should, both the intensity with which an investor thinks about a business and the comfort level he must feel with its economic characteristics before buying into it.”

Besides going small (small-cap), go off the beaten path. Special situations is a anrea where knowing where to look, rather than extraordinary talent, is the most important part of finding bargains in some of these less well followed areas.

Spinoffs.  The lack of research and following creates an even greater potential for mispricing of the new shares.

Stocks emerging from bankruptcy.  Again, unwanted and unanalyzed stocks create a greater chance for mispriced bargains.

Restructings, mergers, liquidations, asset sales, distributions, rights offerings, recapitalizations, options, smaller foreign securities, complex securities, and many more.

Investors who are willing to do a little work have plenty of ways to gain an advantage by simply changing the game.

If you can’t do it yourself then you can choose:

Actively or passively managed mutual funds.

Most actively managed mutual funds charge fees and expenses based on the size fo the fund, usually 1 to 2 percent of the total assets under management.

Invest in index funds. However, there are problems with index investing, and
congratulations to Greenblatt for developing and explaining these problems in
terms that most investors understand. As you read this book, you will come to
appreciate the difference between market-weighted (“capitalization” weighted)
funds, equally-weighted funds and “fundamentally-weighted” funds. The
differences are not trivial, yet most investors are unaware of them.

Use Greenblatt’s approach, developed and explained in his book. However, I will say that his “value-weighted” approach, which amounts to giving more weight to investments that appear more attractively priced (lower price/earnings ratios, etc.), makes sense for many investors.

Two stand-out ideas from the book: 1) value-weighted index investing and
2)always have a core position invested at all times, which based on your market
outlook you can add or subtract to it by a given amount on rare occasions (if
you have no idea what I’m talking about–Get This Book). If retail investors
were to follow this advice to the letter, they would see their returns and peace
of mind increase dramatically, the latter being more important to overall
well-being.   (Amazon reviews)


[1] Using 6 percent as a minimum threshold to beat, regardless of how low government rates go, should give us added confidence that we are making a good long term investment. (This should protect us if low government bond rates are not a permanent condition.)

END


Another Canary in the Coal Mine (Slowing Money Growth); A Reader’s Question

M2_Max_630_378

M2V_Max_630_378 Velocity

Human decisions affecting the future…cannot depend on strict mathematical expectation, since the basis for making such calculations does not exist;….it is our innate urge to activity which makes the wheels go round, out rational selves choosing….but often falling back for out motive on whim or sentiment or chance.” John Maynard Keynes, 1935

This is just one tiny tool and not one to place all your marbles, but with high sentiment there isn’t room for error (witness AMZN today–down in price by over 6%). I expect that if a downturn occurs in asset prices, the monetary fire hoses will be turned on high.  But if monetary growth continues to decline (unless the “air” being pumped into the debt balloon increases, the balloon begins to sag). I will add to my shorts in CRM, GE gingerly.

From www.economicpolicyjournal.com

Money supply (M2 NSA) growth continues to decline. The latest data for annualized quarterly 13 week growth is at 3.8%. This is a dramatic change from just 12 weeks ago when money growth was at 11.4%. Below are the money growth figures for recent weeks, with the last number being the most current. The first data point, 5.1% is for the week of October 8, 2012

5.1%,  5.6%,  6.6%, 7.1%,  7.5%,  7.8%,  8.2%, 8.4%,  8.7%,  9.0%, 9.3%,  9.6%,  9.9%, 10.7% 11.4% 11.4% 11.4%  11.0% 10.5%  9.8% 9.5%

9.1% 8.6% 8.0% 6.8% 5.6% 4.7% 4.1%  3.8%

Here are the steps one can use to calculate this data, which all comes from the Federal Reserve weekly release identified by the Fed as H.6. From the H.6 release, go to table 2 and look for the non-seasonally adjusted, 13-week M2 data. then use non-seasonally adjusted data.  You want to know how much money is out in the system  bidding for goods and services.

Second, use 13 week average rather than single week data because there can be a lot of noise in the system from week to week, depending upon where money is flowing to and from in the system. This causes the data set to move more slowly, but it also means it is less volatile and less likely to set off “false positives”.

Finally, take the 13 week average of a 3 months ago (12 weeks) and calculate the change against the current week, then annualize this result by multiplying by four.

The reason you should annualize the quarterly change  rather than look at the full 12 month period is that money entering the system now will have an impact now. If I use a full 12 month data set, the change may not be detected for months, if at all–especially given the up and down changes in money supply witnessed during  the Bernanke era.

A further note on the current decline in money growth is that it is not occurring because the Federal Reserve is not pumping money into the system. During this same period, the last 12 weeks, the monetary base has been growing at 25% plus. (See the Fed’s H.3). The high-powered money the Fed is creating is simply ending up back at the Federal Reserve as excess reserves. Banks are not lending the money out and are content to place the funds at the Fed. Excess reserves from end December 2012 to End March 2013 have gone from $1.5 trillion to $1.7 trillion, an annualized growth rate of 53%. 

Perhaps that is why commodities and gold have been weak?

Go here:http://www.federalreserve.gov/releases/h6/Current/

A Reader’s Question

I hope you would be willing to give me some advice, I am currently sitting on 150k in cash right now. That I don’t know what do to do with it, I have a watch list of:

  1. Berkshire
  2. Biglari Holdings
  3. Microsoft
  4. Mangnetek
  5. CNQ
  6. Liberty Global or media
  7. DJCO.

Therefore, I am looking for a  sanity check. Right now I feel that Small or Micro Cap’s are out of my circle of competence.

My game plan is to hold cash until the next major market down turn, and hope Berk A comes down to a point where I can purchase.

So I guess my questions are:

  •  Do you think the market is over priced in relation to the stocks mentioned above?
  • What would you do with 150k right now?

Thanks for your time,

Reply: I can feel your pain. The financial repression is pushing many people to take on risk to preserve and grow their wealth.  I am assuming that this money is what you have totally dedicated to equities.  10 to 12 names  gives adequate diversification and 20 is probably too much to to follow.

Don’t forget that your best opportunities may not be today, but tomorrow.

I will come back to answer your question in more detail in a few days because I am on the road, but you should not get caught up in whether the stock market will go up or down. NASDAQ was about to crash, but would that knowledge have kept you from buying Berkshire. I hope not. Buy Berkshire/Short the NASDAQ!

Buffett vs nasdaq

  1. Are these companies understandable to you?
  2. Who is on the other side from you or why is there a mis-pricing?
  3. What price should you pay  based on your required rate of return, and do you have a margin of safety?

You first have to value each company then determine your required rate of return–what price will you pay. This blog has several case studies on valuation–use the search box in the right hand corner.

Perhaps some readers can advise until I return.  Hang in there. Patience.

I feel a bit like the Vet last in line to board the plane before leaving ‘Nam when offering advice–see last 15 seconds of this clip.

Up, Up and Away?

ON-BA688_cover0_BA_20130420002733

This won’t end well–Chicago Slim

Only Barron’s semiannual Big Money poll of professional investors also is setting a record — for bullishness, that is. In our latest survey, 74% of money managers identify themselves as bullish or very bullish about the prospects for U.S. stocks — an all-time high for Big Money, going back more than 20 years. What’s more, about a third of managers expect the Dow Jones industrials to scale the 16,000 level by the middle of next year, notwithstanding a dismal week of selling that left the blue-chip index at 14,547.51 on Friday.

This spring’s survey is notable, as well, for the dearth of bears: A mere 7% of respondents are pessimists today, down from 27% last fall.

wmc130422a.jpg

wmc130422b

A contrasting view:

A few reminders…

“Still Bullish! (Dow 13000)” – Barron’s Magazine Big Money Poll, May 1, 2000

The May 2000 Big Money Poll was published with the Dow Jones Industrial Average at 10733.91. The Dow had already peaked nearly a thousand points higher in January of 2000, and would go on to lose about 40% of its value in the 2000-2002 bear market, with the S&P 500 and Nasdaq faring far worse.

“Dow 14000?” – Barron’s Magazine Big Money Poll, May 2, 2007

http://www.hussmanfunds.com/wmc/wmc130422.htm

http://www.hussmanfunds.com/wmc/wmc130415.htm

Analysis of Salesforce.com (CRM); Austrian Blog; Jim Grant on Inflation

Canyon de chelly

The art of contrary thinking consists in training your mind to ruminate in directions opposite to general public opinions; and to weigh your conclusions in the light of current events and current manifestations of human behavior.

The purpose of contrary opinions is to avoid the predictions that go wrong, notably in the stock market.

It is axiomatic if you stop to think about it, that when everyone is bearish, or bullish, the first of the price momentum is broken.

Be a nonconformist when using your mind; when everyone thinks alike, everybody is likely to be wrong.  Imitation and contagion are the two culprits most responsible of conformity and sameness of thinking. Preconceived opinions leave little room in our minds for contrary viewpoints. –H. Neill, The Ruminator

Analyzing CRM

We spoke about CRM here:  http://wp.me/p2OaYY-1PV.

Here is what CRM does:

Charlie Munger once said, “A thing not worth doing is not worth doing well.” When I look at CRM, I immediately see that it is not worth much time analyzing except if you wanted to go short perhaps. The company seems grossly overpriced. But let’s quickly go through the numbers. I also use ORACLE as comparison–ORCL and CRM Value-Lines.

images

If I buy CRM today at $169 per share and expect my required rate of return of 10% (Many value investors expect 15%) so.

3.8 bil. in sales ($27 per share (2013 E) times 20% growth for 10 years (which is extremely rare) =

$23.4 bil. in  sales

then 0.3%

Net profit margin rate the same as powerhouse/franchise:Oracle/successful software franchise

$7 bil.

In net profits at the end of 10 years

228 mm

Outstanding shares at 5% growth for 10 years

$31  eps

15x

Multiple = However, many big cap tech franchises have multiples of 10 to 12 like MSFT, AAPL, INTC

$465

per share

$169 CAGR 10% for 10 years = $438.  So CRM would have to grow 20% per year at least and then obtain industry leading profit margins even though it has yet to show a profit after 11 years in its quest to build market share.   I was curious if management would bother to tell shareholders when profits may be expected to arrive so I downloaded the annual report:CRM 2012 Annual Report, but the one page letter was just a cheering session. An F for shareholder disclosure.

The main reason I would pass is the difficulty to even maintain a high growth rate in terms of profits. If CRM is not a franchise (able to earn above average profits on each dollar of sales above its cost of capital) then growth doesn’t matter. However, growth is extremely difficult over ten years beyond 15% each year as this article describes: http://money.cnn.com/magazines/fortune/fortune_archive/2001/02/05/296141/index.htm

That’s the problem for big companies: The growing gets hard, and we have two studies to prove it. The first was done a few years ago by Wharton School professor Jeremy Siegel for his book Stocks for the Long Run. Siegel’s primary purpose was to examine how the Nifty Fifty of 1972 would have treated investors who paid the sky-high prices then being asked for them and held on for 25 years–and the answer was “not badly.” But a secondary part of the study looked at the group’s annual growth rates in earnings per share. And only three companies out of the 50 beat 15%. They were Philip Morris, at 17.9%; McDonald’s, at 17.5%; and Merck, at 15.1%.

The second study is one FORTUNE, working with Value Line, did for this article. For three different periods–1960-80, 1970-90, and 1980-99–we examined earnings-per-share growth for 150 large companies. In our sample were the 150 publicly owned companies that (a) at the start of each period were the biggest in the FORTUNE 500 or were in the very top of the “Fifties” lists that we used to do for certain industries, such as commercial banks; and (b) were still independent beings at the end of the period being studied. The fact that we threw out any company that did not last the period (because it was acquired, perhaps, or subjected to a leveraged buyout) gives the results an upward, “survivorship” bias. Beyond that, we know retrospectively that there was no shortage of business opportunity in the years we studied: Though the companies looked big to the world as each period began, they still had plenty of room to grow.

And yet the number that managed to increase their earnings per share over the periods by 15% annually was very small, even when you include the companies that hit the mark because of an oddball situation. For example, Boeing beat 15% in two periods (1960-80 and 1970-90) because it moved from hard times in the base years to prosperity in the later years. Similarly, Fannie Mae had an extraordinary 32% growth rate for the 1980-99 years because it began the period in a near-bankrupt condition, brought on by sky-high interest rates, and later got rich.

 Below are several comments from investors who are skeptical of CRM’s valuation:

Hi Albert,

I’m short the stock, so perhaps am biased, but have tried to do the same blue-sky valuation analysis you have done above. I believe there are a few places where your assumptions are off.

In the essence, it is impossible for Salesforce to lower its R&D or Marketing and Sales (“M&S”) expenditures to levels similar to Oracle or SAP. If you think about the value proposition of CRM, this includes a lower TOC for users. If that is true, then that means lower revenues per customer, and a higher cost per unit of revenue to deliver the goods. Thus, CRM will never be able to do operating profits close to that earned by SAP or ORCL.

There is also the more sinister argument that the firm will do anything to show the Street growth in revenues and deferred revenue, and given that the market seems to be giving them a free pass for now on profitability, they are out there spending several dollars in costs (on their marketers) just to generate one dollar of sales.

For what it’s worth, I see them at $6.6 billion of revenues in Fiscal 2018 (still astounding growth) but they will struggle to do markedly better pro-forma operating margins than they are already doing now (and GAAP margins will still only be in the low single digits). Even in a blue-sky scenario, where they could approach $9 billion in sales that year, and generate 15% pro-forma operating margins, I still only get to a shade over $4 in EPS (and that’s five years away). Generating $9 billion in a single year would be quite a feat by the way: in the past three full fiscal years, they’ve only generated $8.1 billion, in total.

But let’s say that the blue-sky will prevail and that investors will pay 35x that blue-sky EPS number five years from now, that gets you to a future value of about $150/share. Given the corporate governance issues, the exorbitant insider compensation, the acquisitive growth, and the legion of current fans on the sell-side, there is a lot of risk between here and there, so I’d need to earn at least 12% a year on an investment that I thought was going to be worth $150 five years from now. That gets me to $85 today, and again this is in the rosiest of scenarios – and one which I think is extremely unlikely.

I agree by the way that there seems to be scope for the company to play games with revenue recognition. The disclosure in the 10-K regarding their policy is labryrinth of verbosity.

Finally, management is voting with their feet–a continuous sale of their stock.  CRM seems like a transfer scheme between public investors and management. Investors buy and management sells.

Salesforce.com, Inc. (CRM) Vice Chairman Veenendaal Frank Van sells 1,000 Shares

Salesforce.com, Inc. (CRM) Vice Chairman Veenendaal Frank Van sells 2,000 Shares

Salesforce.com, Inc. (CRM) Vice Chairman Veenendaal Frank Van sells 2,000 Shares

CSInvesting Editor: Note how he uses a reverse-engineering type of valuation analysis–using Sun-microsystems as an example.

Voting & Salesforce.com – A Question of Probabilities

November 20, 2012 | About: CRM -0.59% MSFT +0.37% ORCL -1.04%

The Science of Hitting

There was an interesting article in The Economist this past week about the numbers behind voting to draw the 2012 U.S. presidential election to a close. Economists (and as we known, academics in the finance department at institutions worldwide) love to lean on a simple premise that materially influences what they ultimately conclude about the world around us: Human beings are rational and keenly focused on utility-maximization. With that as a given, the obvious question is asked – why do people bother voting when the probability that their single vote will actually have any impact is zero? As they note, you are more likely to get struck by lightning on the way to the polling station than to be the deciding vote in the U.S. presidential election.

They quickly address and dismiss a few common responses as to why one could still justify voting, including “what if everyone else didn’t vote either” (the smart money for the last 57 elections in the U.S. has been that some people will go to the polls), the importance of “preserving democracy” (one skipped vote is unlikely to result in the country’s demise), and the good feeling that comes from performing a “civic duty” – an often cited argument and hardly a surprising one: people tend to do what’s in their self-interest (to make them feel good about themselves), and the investment of one’s time is a small price to avoid any personal shame. While these responses (particularly the third) each have their place in the discussion, there’s one argument from the piece that I personally agree with: “some academics reckon that voters are simply bad at calculating probabilities.”

In connection with equity investments, that statement alone doesn’t do justice – absurd valuations aren’t solely built upon the fact that people are poor at calculating probabilities; instead, it appears that people have a way of always convincing themselves that this time truly is different (much like our voter who has convinced themselves their voice counts, even though they don’t need a calculator to figure out that 1 divided by 123 million – the number of votes in the 2008 general election – is a percentage of microscopic proportions). They end up believing that by a miracle of sorts, the company will justify this valuation – and a much higher one – over time.

A great example of this is from the tech boom at the turn of the century; in a Business Week article written in April of 2002, Scott McNealy, CEO of Microsystems, was quoted as saying the following about his company’s stock, which had previously traded at 10x revenues:

“At 10 times revenues, to give you a 10-year payback, I have to pay you 100% of revenues for 10 straight years in dividends. That assumes I can get that by my shareholders. That assumes I have zero cost of goods sold, which is very hard for a computer company. That assumes zero expenses, which is really hard with 39,000 employees. That assumes I pay no taxes, which is very hard. And that assumes you pay no tax on your dividends, which is kind of illegal. And that assumes with zero R&D for the next 10 years, I can maintain the current revenue run rate. Now, having done that, would any of you like to buy my stock for $64? Do you realize how ridiculous those basic assumptions are? You don’t need transparency. You don’t need footnotes. What were you thinking?”

We don’t need to search very far to find a comparable example in today’s market: Salesforce.com (CRM) has traded at more than 10x revenue a couple of times over the past twenty-four months; according to Marketwatch, the analyst community (calculating probabilities must surely be in their job description) currently has a Buy-to-Sell ratio of fifteen-to-one, essentially saying that they uniformly agree that CRM is a strong buy.

As I noted in an article a few months ago, CRM would need to attain annualized revenue of growth of 25% over the next decade (ahead of Microsoft’s 20.8% annualized growth rate in the decade after the release of Windows 95), as well as reach a mid-twenties net margin in line with the current average for computer software firms – likely the company’s closest comparable industry (remember, they compete with giants like Microsoft, Oracle, etc, and have struggled to report positive earnings for some time now). If all this were to happen, and the company was given an earnings multiple in the mid-teens (in-line with the current large cap tech companies), the annualized return to shareholders would be in the high single digits (assuming a starting price in the low-mid $150’s per share).

Again, that’s in the scenario where things work (by any reasonable measure) perfectly. What is the probability that CRM is able to attain a revenue CAGR of 25% over the next ten years, and will be able to handily dominant its peers in the space despite their considerable share of mind among CIO’s at the largest companies in the world? More importantly, assuming that this scenario is considered to be a 100% certainty, what are these analysts modeling in the bear case scenario? At this valuation, and to continue to pushing CRM as a buy, one has to wonder – is there even a bear case scenario in these analyst projections?

Whether or not Salesforce ends up justifying this valuation over time is to be seen (CEO Mark Benioff certainly seems convinced that this company will change the world); personally, I would try my luck at voting before I considered going anywhere near CRM common stock.

About the author:

I’m a value investor, with a focus on patience; my sweet spot is great companies that are suffering from short term issues, and load up when those opportunities become present.

—–

 A blog about Austrian Economics and Investing:

http://www.wallstformainst.com/austrian-school-of-economics/

Jim Grant on Inflationhttp://www.gurufocus.com/news/213668/jim-grant-expects-immense-inflation


A Reader’s Question: What Should I Pay for Salesforce.com (CRM)?

skate

A question like that makes me into a religious man, “What the $%^&!, God $%^& Damn %^&@# It, Jesus the $%^&*! Christ!

CRM

My answer: OK, instead of asking, “What is it worth?” Ask, what would need to happen if I paid today’s price of $169 and required a 10% annual return? What would CRM need to provide to me (sales, cash flows and margins), the investor, over the next ten years?  What does the current price for CRM infer?

Does someone wish to answer this for the reader? Here is the Value-Line: CRM. The best volunteer gets an emailed prize.  I will reply in full next week.

Go here for remedial work  on what you need to learn: http://www.oldschoolvalue.com/blog/investing-perspective/value-investor-accounting-writing/

You could make money but this would have to happen first:


But if you ask the same type of question again then:

or…………

HAVE A GREAT WEEKEND!

Chart Views on Monetary Mayhem

Gold Standard Era

Remember that correlation is not causation. Our eyes make our minds extrapolate.  I use charts to see if the current market facts jibe with my theoretical understanding.  This current boom in stocks will need increasing amounts of credit and money to sustain its rise–but the day of reckoning is never eliminated–just prolonged as the mal-investment increases.

irrational-markets

gold-stocks

http://smartmoneytracker.blogspot.com/


Go to http://smartmoneytracker.blogspot.com/ for a FREE trial.


Readings on Gold Backwardation, Adjusted Schiller P/E Ratios

Patience and wisdom


P A T I E N C E

Jim Cramer on CNBC: I will take this call from a viewer in Cleveland, “BOOYAH!”

Caller from Cleveland: Big BOOYAH to you, Jim.  Jim I just bought SalesForce (CRM) and I am worried that the stock market could have a correction.

Cramer: “Don’t be foolish, Uncle Ben (Bernanke) wouldn’t let that happen. BOOYAH, BOOYAH! Next caller.

Markel:Annual Report_2012 and  http://brooklyninvestor.blogspot.com/2013/03/markel-2012-annual-report.html

Understand Schiller’s P/E and Cyclically Adjusted Earnings

http://greenbackd.com/2013/04/03/how-accurate-is-the-shiller-pe-as-a-forecasting-tool/

More on Irrational Exuberance: http://etfdailynews.com/2013/04/03/david-stockman-welcome-to-irrational-exuberance-2-0/

More on Bitcoin, Gold in Backwardation and money:Bitcoin and Acting MAn   This is an important read to understand if you want to improve your understanding of money.

A farce: Shut Up Savers Surowiecki

P.S. as of 11 AM I bought in equal measure (adding) AUQ, AUNFF, YNGFF, AUY, NGD, GQMNF, RBY, RTRAF, FNV, RGLD, SLW, AG, PHYS. Whoops….and EGO, GORO.

then I threw up all over my keyboard.

goldtraders1


A reader asks, Why did you buy gold?” Well, besides massively negative interest rates, global central bank mania/panic and this report: http://www.businessinsider.com/socgen-the-end-of-the-gold-era-2013-4

One argument is that managed money is bearish on gold. Whoa! So they were bullish in 2011 when gold hit $1,900 and now, after seventeen months, they are bearish? The chart below sure doesn’t support the sagaciousness of the “managed” money.

gold-107

Valuation Exercise- EXPD Explained. Austrian Investing

Silver Mining Town

“All of man’s miseries derive from not being able to sit quietly in a room alone.” –Blaise Pascal

I placed the Value-Line for EXPD here http://wp.me/p2OaYY-1O6. Just click on the link then download from the link EXPD_VL in the post. If you haven’t done the valuation exercise do it now then you can compare with my brief thoughts.  What would you pay?

 EXPD


I always go to check the pulse of the company—the return on total capital and return on shareholders’ equity. Both have averaged 20% over the past 10 years with excellent stability and no debt. I then glance at the balance sheet and see $1,367 in cash assets. Subtract uncapitalized leases of $45 million (as debt) then round down to $1,300 in cash then divide by 208 mil. shares to show $6.25 per share in excess cash. Let’s just say $6.00.  The core business is quite profitable if it earns 20% returns on capital while holding $1.3 billion in cash. What will management do with that cash?

Sales have steadily risen since 1997 at about 9% per year until 2009 and then growth has dropped to 5% to 6%. But what is striking is the drop in sales in 2008 of $26.58 per share down to $19.30 in 2009—a drop of 27% while operating margins held steady at 10.5%. This business can adjust quickly or it has a high degree of variable costs. I am impressed with how this company remained profitable through the financial collapse. This is a question I should ask and answer through a visit to the 10-K and 8-Ks. This company provides a case study in how management looks at its business vs. Wall Street’s view. Read several years of the company’s 8-K filings.  Go here: http://www.investor.expeditors.com/public-disclosure/2013/index.asp

The business seems asset light, so perhaps the source of competitive advantage is economies of scale through network effects.  Try to uncover the source of the company’s competitive advantage.

Management owns 2.3% of this $8.5 billion dollar company so they have skin in the game. Good. Always be aware of incentives. Management has said that they may pursue share buybacks at current prices. Outstanding shares are slightly declining.

Cash flow has been steady and capex seems to be low. For 2013, $2.05 in “cash flow” (this cash flow is EBIDA but after taxes) then we deduct the $0.40 in capex to arrive at $1.65 in free cash flow. I place about an 11% cost of capital with about 4% to 5% growth so $1.65/(11% -4%) = $23.50 or $27.50 if I use a 5% growth number. This business grows with world trade since it is a logistics business.

Now we add back the excess cash in the business $6 to arrive at a value of $29.50 to $33.50. A 20% to 30% discount would put me at $27 to $23 to be a buyer of this business. I can’t expect more of a discount for such a stable, high return business—though subject to cyclical risks. Today (April 3, 2013) EXPD seems reasonably priced at $35.  Watch and wait while getting answers to my questions.

An Austrian Investing Blog: http://www.austrianinvesting.com/

Updated: Gold in Backwardation! That means lack of trust is building in the financial/gold market.

http://monetary-metals.com/basisletter/


The Great Deformation; Current Conditions; Is Bitcoin Money? Ponzis; Watch the Balance Sheet; Sound Money

Sundown

This freakish central bank accumulation of dollar liabilities, in turn, was the result of the greatest money printing spree in world history. In essence, we printed and then they printed, and the cycle never stopped repeating. In this manner, the massive excess of dollar liabilities generated by the Fed were absorbed by its currency pegging counterparts, and then recycled into swelling domestic money supplies of yuan, yen, won, ringgit, and Hong Kong dollars.

As the US debt-based global monetary system became increasingly more unstable in recent years, central bank absorption of incremental Treasury debt reached stunning proportions. Thus, US publicly held debt rose by $6 trillion between 2004 and 2012, but upward of $4 trillion, or 70 percent, of this was taken down by central banks.

I could be truly said, therefore, that the worlds’ central banks have morphed into a global chain of monetary roach motels. The bonds went in, but they never came out. And therein lays the secret of “deficits without tears.”

David Stockman from The Great Deformation (2013)

Read an interesting article on crony capitalism: Sundown_in_America

Comments on the article: http://www.zerohedge.com/news/2013-04-01/guest-post-stockman-liquidation

Current Conditions

wmc130401a

The chart is based on data through the end of 2012. Smithers notes “At that date the S&P 500 was at 1426 and US non-financials were overvalued by 44% according to q and quoted shares, including financials, were overvalued by 52% according to CAPE. With the S&P 500 at 1552 the overvaluation was 57% for non-financials and 65% for quoted shares.”

Unfortunately, that seems about right. Let’s translate this into an estimate of prospective 10-year total returns, assuming underlying nominal economic growth rate of about 6.3% (which may be optimistic, but is a robust peak-to-peak norm across economic cycles, and is unlikely to be pessimistic), and a dividend yield of about 2.2% on the S&P 500. With that, a 65% overvaluation in quoted shares, reverting to fair valuation a decade from now, would imply a 10-year annual nominal total return on the S&P 500 of 1.063*(1/1.65)^(1/10) + .022 – 1 = 3.3% annually. That’s right in line with the estimates we obtain from a wide range of other historically reliable approaches (historically reliable in italics, because the “Fed Model” is not).

Notice that in 1982, the -0.7 reading on Smithers’ log-scale chart implied that stocks were undervalued by exp(-0.7)-1 = -50%. At that point, with the dividend yield on the S&P 500 about 6.7%, one would have estimated a 10-year prospective total return for the S&P 500 of 1.063*(1/0.5)^(1/10)+.067 – 1 = 20.6% annually. One would have been correct.

In contrast, note that in 2000, the 1.0 reading implied that stocks were overvalued by exp(1.0)-1 = 172%. At that point, with the dividend yield on the S&P 500 at just 1.2%, one would have estimated a 10-year prospective total return for the S&P 500 of 1.063*(1/2.72)^(1/10)+.012 = -2.6% annually. Again, one would have been correct.

With due respect to Howard Marks and Warren Buffett

At present, we estimate a 10-year total return on the S&P 500 over the coming decade averaging just 3.5% annually, with zero total returns over a horizon of about 7 years, and expected losses for the S&P 500, including dividends, over shorter horizons.

…..The last four years of market advance have reduced FUTURE retruns.

While our estimates for 10-year total returns exceeded 10% annually near the 2009 market lows, the recent advance has, in effect, “eaten” most of those prospective returns. The well-admired bond manager Howard Marks is very correct when he notes “appreciation at a rate in excess of the cash flow accelerates into the present some appreciation that otherwise might have happened in the future.”

Where I differ from even Howard Marks and Warren Buffet here, is that if you are going to rely on a summary measure in order to value long-lived assets like stocks (both Marks and Buffett point to “forward operating earnings” today), that summary measure must be representative of the long-term stream of cash that investors can expect to receive over time. The hook today is that investors are using analyst estimates of next year’s operating earnings as if they are representative of the entire long-term stream, and that this one number can be used as a “sufficient statistic” for long-term corporate profitability.

Read More: http://www.hussmanfunds.com/wmc/wmc130401.htm

Profit MArgins


 Jim Rogers on when he was wiped out


Is Bitcoin money?

Money Diagram


No! Summary:

» Bitcoins can be hyperinflated in substance

» Bitcoins can never be the most saleable good

» Bitcoins cannot account for the regression theorem

» Bitcoins are the equivalent of token money

» Bitcoins are the opposite of anonymous

For context, Bitcoin is a newly formed digital currency which has rapidly grown in popularity (as well as in price) following the Cyprus banking system collapse. The chart below is the price performance of Bitcoins, which have seen a market cap expansion of almost 20x—from about $50mm to roughly $1B where it stands today—in less than one year.

Read more…. http://bullmarketthinking.com/bitcoin-bubble-2-0-from-a-monetary-standpoint-they-are-on-par-with-the-stuff-you-find-at-chuck-e-cheese/


Watch the balance sheet: Never ignore the balance sheet (Videos).

http://www.youtube.com/watch?NR=1&v=X-b62ZYXAyw&feature=endscreen

What is a balance sheet: http://youtu.be/DuKEcxVplnY

Signs a company is in trouble: http://youtu.be/lwp6i4Kd4RA

Why does a profitable company go bust? http://youtu.be/d0FY4xRT_yo

A Ponzi on top of a Ponzi: http://video.cnbc.com/gallery/?play=1&video=3000148493  This story is unbelievable. A young guy decides to create fake boat titles from fake invoices that he then obtains loans on from his local banker. The banker doesn’t have the brains nor the energy to make a 90 second call to the boat manufacturer to verify the make and model. Nor does the banker even wonder how his customer obtained the money to have 53 yachts.

As the court documents reveal, the con man said it was in the interests of the banker to believe the con! (This I believe). As a plea for leniency, the conman’s lawyer stated that his client ONLY defrauded FDIC INSURED banks! Expect many more ponzis to be revealed.   See: MichaelVorce_AmericanGreedStatement and Vorce_PleaTranscript

Another $600 million Ponzi:  http://www.huffingtonpost.com/2013/03/30/zeekrewards-ponzi-scheme-north-carolina_n_2984347.html?utm_hp_ref=business

SOUND MONEY

Prof Selgin on sound money http://youtu.be/U_0CNwgL8Rw

Dr. Judy Sheldon on the origins of our money: http://youtu.be/hdlZi2KPXhU

Money in crisis part 1: http://youtu.be/TQ4PGr0WBBc

Money in crisis, part 2: http://youtu.be/1mI8Lek60_w

www.moneyweek.com