This course will cover special topics in Austrian Business Cycle Theory, including the “Skyscraper Index,” the art of predicting downturns, and the causes of the housing bubble and burst that led to the 2008 financial crisis.
Lectures
Lectures will be Wednesdays at 5:30 p.m. Eastern time.
Reading
All readings will be free and online. A fully hyper-linked syllabus with readings for each weekly topic will be available for all students.
Grades and Certificates
The final grade will depend on quizzes. Taking the course for a grade is optional. This course is worth 3 credits in Mises Academy. Feel free to ask your school to accept Mises Academy credits. You will receive a digital Certificate of Completion for this course if you take it for a grade, and a Certificate of Participation if you take it on a paid-audit basis.
Refund Policy
If you drop the course during its first week (7 calendar days), you will receive a full refund, minus a $25 processing fee. If you drop the course during its second week, you will receive a half refund. No refunds will be granted following the second week.
Mark Thornton
Mark Thornton is an Americaneconomist of the Austrian School.[1] Thornton has been described by the Advocates for Self-Government as “one of America’s experts on the economics of illegal drugs.”[2] Thornton has written extensively on that topic, as well as on the economics of the American Civil War, economic bubbles, and public finance. He successfully predicted the housing bubble, the top in home builder stocks, the bust in housing and the world economic crisis.
Libertarian organizations including the Independent Institute,[5] the Cato Institute,[6] and the Mises Institute have published Thornton’s writings on drug prohibition and prohibition in general. Thornton contributed a chapter[7] to Jefferson Fish‘s book How to Legalize Drugs. He has also been interviewed on the topic of prohibition by members of the mainstream press. His research and publications are the basis of the Iron Law of Prohibition which states that the enforcement of prohibition increases the potency and danger of consuming illegal drugs. [8] Thornton’s first book, The Economics of Prohibition, was praised by Murray Rothbard, who declared:
Thornton’s book… arrives to fill an enormous gap, and it does so splendidly…. The drug prohibition question is… the hottest political topic today, and for the foreseeable future…. This is an excellent work making an important contribution to scholarship as well as to the public policy debate.
Economic bubbles
Thornton has also written on economic bubbles, including the United States housing bubble, which he first described in February 2004.[9][10][11] He suggested that the “housing bubble might be coming to an end” in August 2005.[12] His work on market bubbles has been cited by journalists[13][14] and other writers.[15][16] Economist Joseph Salerno noted that “Mark Thornton of the Mises Institute was one of the first to jump on this—to start writing about the housing bubble.”[17] Similarly, economist Thomas DiLorenzo has written that “[i]t was Austrian economists like Mark Thornton . . . who were warning of a housing bubble years before it burst.”[1] He also called the top in the housing market. He developed and published his Skyscraper and Business Cycle model in 2005.[13] His Skyscraper Index Model successfully sent a signal of the Late-2000s financial crisis at the beginning of August 2007. [14][15]
Political activities
Thornton has also been active in the political arena, making his first bid for office in 1984, when he ran for the U.S. Congress. He became the first Libertarian Party office-holder in Alabama when he was elected Constable in 1988. He was the Libertarian Party Candidate for the U.S. Senate in 1996 (also endorsed by the Reform Party) coming in third of four candidates. Thornton also served in various capacities with the Libertarian Party of Alabama including Vice Chairman and Chairman. In 1997 he became the Assistant Superintendent of Banking and a economic analyst for Alabama Governor, Fob James.[2]
Thornton has been featured as a guest on a variety of radio and internet programs and his editorials and interviews have appeared in leading newspapers and magazines.
JOBS AVAILABLE Candidates sought for our market stabilization teams. Applicants should be from an Ivy-League school, have attended an investment training program and have market knowledge of stocks, bonds and commodities. You should be able to work closely with our affiliates, Goldman Sachs and JP Morgan, in maintaining market and price stability. There are several teams that need members: Gold and Silver Suppression, U.S. Government Bond Buying, S&P 500 Plunge-Protection, and Carnage Control. Candidates must be able to implement and execute complex market strategies such as described here: http://sibileau.com/martin/
April 9 (Bloomberg) — J. Kyle Bass, head of Dallas-based hedge fund Hayman Advisors LP, talks about the outlook for Japanese government bonds, gold, and the U.S. housing market. Bass, speaking with Erik Schatzker and Stephhanie Ruhle on Bloomberg Television’s “Market Makers,” also discussses activist investing. Bloomberg Industries metals and mining analyst Andrew Cosgrove also speaks. (Source: Bloomberg) http://bloom.bg/11P3V3V Thanks to David Hui Lau! (Beg to be on his email list: dahhuilaudavid@gmail.com)
I have been speaking to several friends who run small businesses, and they are universally depressed. They see ever-increasing regulations, taxes, government dis-function and poor prospects. They are battening down the hatches. Perhaps, that is good advice. Note the interview with an entrepreneur #3 below
Get on his email list for Value Investing News. I think he might even send out Baupost’s last 2012 annual letter if you ask. Ask to be on his list: pcordway@gmail.com. Below is a sample from his last emailed letter:
Subject: good reading
As usual, if anyone is going to Omaha for the Berkshire Hathaway annual meeting and wants to get together just drop me (Phillip) an email.
Facts and Figures
Real, per capita disposable income in the U.S. has declined at 0.4% per year over the past five years (Source: Commerce Dept.)
More, if you’re a glutton for punishment: America still has two million fewer jobs than it did in January ’08 (Brookings Inst.); food stamp enrollment is up 70% since ’08 to a record 47.8 million in Dec. ’12 (SSA); 43% of active workers reported no active saving for retirement (ERBI)
In happier news:
There are 1.7 million fewer underwater home owners (sic) in 4Q12, taking the total down to 21.5% from the peak of 25.2% in 4Q11 (Corelogix); U.S. R&D spending of 2.9% of GDP is back to its space-race peak economist); household net worth rose $1.17 trillion in 4Q12 to $66.07 trillion, the highest since 4Q07
“Household Debt and Credit: Student Debt” — A presentation from the NY Fed outlining some of the key aspects of the current student loan market. Thanks to Vitaliy for passing this along.
On a similar note, “The Essays of Warren Buffett” was just released in a Third Edition that is updated to include material from the past few years. An interview with the author is here.
The Outsiders — This has been recommended by several people, most recently and notably by Warren Buffett himself in his annual letter. I’ll throw in my two cents — this is probably the best business book I’ve read in the past year.
The Clash of Cultures: Investment vs. Speculation–Buffett also recommended this book, which is Bogle’s living history of the changes (almost all negative) he’s witnessed in 60+ years of financial markets. This is a good and important book.
The Great Deformation — I haven’t read this book yet, and I’m certainly not endorsing the author’s views (his last sentence in this essay is particularly nonsensical), so don’t shoot the messenger. But wow, you don’t see a vicious takedown of both sides like this very often. Like the Baupost letter, I would advise that you don’t read any of this with sharp objects at hand.
Attachments
Baupost 2012 Annual Letter — This has been out for a month or two and I won’t clog your inboxes any further, but if you haven’t read this yet you should. This was by far the winner of any otherwise lackluster shareholder letter season.
Household formation — A chart from BAML showing the 5-year rolling change in numbers of households, which obviously fell off a cliff in ’08 and hasn’t really rebounded much.
Buffett Stock Gauge Sends U.S. Caution Signal — Buffett has said that “probably the best single measure of where valuations stand at any given moment” is the market capitalization of all stocks (the Wilshire 5000) against gross national product. He added, importantly, that the ratio has “certain limitations in telling you what you need to know.” He believed it would be hard to go too wrong with the ratio in the 70-80% range, with anything approaching 200% deemed to be “playing with fire.” So there is nothing from his direct commentary to suggest that he viewed 100% as anything more than a round number, but it’s worth looking at where the ratio has been and where it is currently (as well as the margins supporting currently valuations).
Cyclically Adjusted PE Ratios — Similar to the market cap / NG is the ratio of price to 10-year-average profits shows. This chart, compiled by Goldman, shows CAPE ratios worldwide.
The art of contrary thinking consists in training your mind to ruminate in directions opposite to general public opinions; and to weigh your conclusions in the light of current events and current manifestations of human behavior.
The purpose of contrary opinions is to avoid the predictions that go wrong, notably in the stock market.
It is axiomatic if you stop to think about it, that when everyone is bearish, or bullish, the first of the price momentum is broken.
Be a nonconformist when using your mind; when everyone thinks alike, everybody is likely to be wrong. Imitation and contagion are the two culprits most responsible of conformity and sameness of thinking. Preconceived opinions leave little room in our minds for contrary viewpoints. –H. Neill, The Ruminator
Charlie Munger once said, “A thing not worth doing is not worth doing well.” When I look at CRM, I immediately see that it is not worth much time analyzing except if you wanted to go short perhaps. The company seems grossly overpriced. But let’s quickly go through the numbers. I also use ORACLE as comparison–ORCL and CRM Value-Lines.
If I buy CRM today at $169 per share and expect my required rate of return of 10% (Many value investors expect 15%) so.
3.8 bil. in sales ($27 per share (2013 E) times 20% growth for 10 years (which is extremely rare) =
$23.4 bil. in sales
then 0.3%
Net profit margin rate the same as powerhouse/franchise:Oracle/successful software franchise
$7 bil.
In net profits at the end of 10 years
228 mm
Outstanding shares at 5% growth for 10 years
$31 eps
15x
Multiple = However, many big cap tech franchises have multiples of 10 to 12 like MSFT, AAPL, INTC
$465
per share
$169 CAGR 10% for 10 years = $438. So CRM would have to grow 20% per year at least and then obtain industry leading profit margins even though it has yet to show a profit after 11 years in its quest to build market share. I was curious if management would bother to tell shareholders when profits may be expected to arrive so I downloaded the annual report:CRM 2012 Annual Report, but the one page letter was just a cheering session. An F for shareholder disclosure.
The main reason I would pass is the difficulty to even maintain a high growth rate in terms of profits. If CRM is not a franchise (able to earn above average profits on each dollar of sales above its cost of capital) then growth doesn’t matter. However, growth is extremely difficult over ten years beyond 15% each year as this article describes: http://money.cnn.com/magazines/fortune/fortune_archive/2001/02/05/296141/index.htm
That’s the problem for big companies: The growing gets hard, and we have two studies to prove it. The first was done a few years ago by Wharton School professor Jeremy Siegel for his book Stocks for the Long Run. Siegel’s primary purpose was to examine how the Nifty Fifty of 1972 would have treated investors who paid the sky-high prices then being asked for them and held on for 25 years–and the answer was “not badly.” But a secondary part of the study looked at the group’s annual growth rates in earnings per share. And only three companies out of the 50 beat 15%. They were Philip Morris, at 17.9%; McDonald’s, at 17.5%; and Merck, at 15.1%.
The second study is one FORTUNE, working with Value Line, did for this article. For three different periods–1960-80, 1970-90, and 1980-99–we examined earnings-per-share growth for 150 large companies. In our sample were the 150 publicly owned companies that (a) at the start of each period were the biggest in the FORTUNE 500 or were in the very top of the “Fifties” lists that we used to do for certain industries, such as commercial banks; and (b) were still independent beings at the end of the period being studied. The fact that we threw out any company that did not last the period (because it was acquired, perhaps, or subjected to a leveraged buyout) gives the results an upward, “survivorship” bias. Beyond that, we know retrospectively that there was no shortage of business opportunity in the years we studied: Though the companies looked big to the world as each period began, they still had plenty of room to grow.
And yet the number that managed to increase their earnings per share over the periods by 15% annually was very small, even when you include the companies that hit the mark because of an oddball situation. For example, Boeing beat 15% in two periods (1960-80 and 1970-90) because it moved from hard times in the base years to prosperity in the later years. Similarly, Fannie Mae had an extraordinary 32% growth rate for the 1980-99 years because it began the period in a near-bankrupt condition, brought on by sky-high interest rates, and later got rich.
Below are several comments from investors who are skeptical of CRM’s valuation:
Hi Albert,
I’m short the stock, so perhaps am biased, but have tried to do the same blue-sky valuation analysis you have done above. I believe there are a few places where your assumptions are off.
In the essence, it is impossible for Salesforce to lower its R&D or Marketing and Sales (“M&S”) expenditures to levels similar to Oracle or SAP. If you think about the value proposition of CRM, this includes a lower TOC for users. If that is true, then that means lower revenues per customer, and a higher cost per unit of revenue to deliver the goods. Thus, CRM will never be able to do operating profits close to that earned by SAP or ORCL.
There is also the more sinister argument that the firm will do anything to show the Street growth in revenues and deferred revenue, and given that the market seems to be giving them a free pass for now on profitability, they are out there spending several dollars in costs (on their marketers) just to generate one dollar of sales.
For what it’s worth, I see them at $6.6 billion of revenues in Fiscal 2018 (still astounding growth) but they will struggle to do markedly better pro-forma operating margins than they are already doing now (and GAAP margins will still only be in the low single digits). Even in a blue-sky scenario, where they could approach $9 billion in sales that year, and generate 15% pro-forma operating margins, I still only get to a shade over $4 in EPS (and that’s five years away). Generating $9 billion in a single year would be quite a feat by the way: in the past three full fiscal years, they’ve only generated $8.1 billion, in total.
But let’s say that the blue-sky will prevail and that investors will pay 35x that blue-sky EPS number five years from now, that gets you to a future value of about $150/share. Given the corporate governance issues, the exorbitant insider compensation, the acquisitive growth, and the legion of current fans on the sell-side, there is a lot of risk between here and there, so I’d need to earn at least 12% a year on an investment that I thought was going to be worth $150 five years from now. That gets me to $85 today, and again this is in the rosiest of scenarios – and one which I think is extremely unlikely.
I agree by the way that there seems to be scope for the company to play games with revenue recognition. The disclosure in the 10-K regarding their policy is labryrinth of verbosity.
—
Finally, management is voting with their feet–a continuous sale of their stock. CRM seems like a transfer scheme between public investors and management. Investors buy and management sells.
There was an interesting article in The Economist this past week about the numbers behind voting to draw the 2012 U.S. presidential election to a close. Economists (and as we known, academics in the finance department at institutions worldwide) love to lean on a simple premise that materially influences what they ultimately conclude about the world around us: Human beings are rational and keenly focused on utility-maximization. With that as a given, the obvious question is asked – why do people bother voting when the probability that their single vote will actually have any impact is zero? As they note, you are more likely to get struck by lightning on the way to the polling station than to be the deciding vote in the U.S. presidential election.
They quickly address and dismiss a few common responses as to why one could still justify voting, including “what if everyone else didn’t vote either” (the smart money for the last 57 elections in the U.S. has been that some people will go to the polls), the importance of “preserving democracy” (one skipped vote is unlikely to result in the country’s demise), and the good feeling that comes from performing a “civic duty” – an often cited argument and hardly a surprising one: people tend to do what’s in their self-interest (to make them feel good about themselves), and the investment of one’s time is a small price to avoid any personal shame. While these responses (particularly the third) each have their place in the discussion, there’s one argument from the piece that I personally agree with: “some academics reckon that voters are simply bad at calculating probabilities.”
In connection with equity investments, that statement alone doesn’t do justice – absurd valuations aren’t solely built upon the fact that people are poor at calculating probabilities; instead, it appears that people have a way of always convincing themselves that this time truly is different (much like our voter who has convinced themselves their voice counts, even though they don’t need a calculator to figure out that 1 divided by 123 million – the number of votes in the 2008 general election – is a percentage of microscopic proportions). They end up believing that by a miracle of sorts, the company will justify this valuation – and a much higher one – over time.
A great example of this is from the tech boom at the turn of the century; in a Business Week article written in April of 2002, Scott McNealy, CEO of Microsystems, was quoted as saying the following about his company’s stock, which had previously traded at 10x revenues:
“At 10 times revenues, to give you a 10-year payback, I have to pay you 100% of revenues for 10 straight years in dividends. That assumes I can get that by my shareholders. That assumes I have zero cost of goods sold, which is very hard for a computer company. That assumes zero expenses, which is really hard with 39,000 employees. That assumes I pay no taxes, which is very hard. And that assumes you pay no tax on your dividends, which is kind of illegal. And that assumes with zero R&D for the next 10 years, I can maintain the current revenue run rate. Now, having done that, would any of you like to buy my stock for $64? Do you realize how ridiculous those basic assumptions are? You don’t need transparency. You don’t need footnotes. What were you thinking?”
We don’t need to search very far to find a comparable example in today’s market: Salesforce.com (CRM) has traded at more than 10x revenue a couple of times over the past twenty-four months; according to Marketwatch, the analyst community (calculating probabilities must surely be in their job description) currently has a Buy-to-Sell ratio of fifteen-to-one, essentially saying that they uniformly agree that CRM is a strong buy.
As I noted in an article a few months ago, CRM would need to attain annualized revenue of growth of 25% over the next decade (ahead of Microsoft’s 20.8% annualized growth rate in the decade after the release of Windows 95), as well as reach a mid-twenties net margin in line with the current average for computer software firms – likely the company’s closest comparable industry (remember, they compete with giants like Microsoft, Oracle, etc, and have struggled to report positive earnings for some time now). If all this were to happen, and the company was given an earnings multiple in the mid-teens (in-line with the current large cap tech companies), the annualized return to shareholders would be in the high single digits (assuming a starting price in the low-mid $150’s per share).
Again, that’s in the scenario where things work (by any reasonable measure) perfectly. What is the probability that CRM is able to attain a revenue CAGR of 25% over the next ten years, and will be able to handily dominant its peers in the space despite their considerable share of mind among CIO’s at the largest companies in the world? More importantly, assuming that this scenario is considered to be a 100% certainty, what are these analysts modeling in the bear case scenario? At this valuation, and to continue to pushing CRM as a buy, one has to wonder – is there even a bear case scenario in these analyst projections?
Whether or not Salesforce ends up justifying this valuation over time is to be seen (CEO Mark Benioff certainly seems convinced that this company will change the world); personally, I would try my luck at voting before I considered going anywhere near CRM common stock.
About the author:
I’m a value investor, with a focus on patience; my sweet spot is great companies that are suffering from short term issues, and load up when those opportunities become present.
A question like that makes me into a religious man, “What the $%^&!, God $%^& Damn %^&@# It, Jesus the $%^&*! Christ!
My answer: OK, instead of asking, “What is it worth?” Ask, what would need to happen if I paid today’s price of $169and required a 10% annual return? What would CRM need to provide to me (sales, cash flows and margins), the investor, over the next ten years? What does the current price for CRM infer?
Does someone wish to answer this for the reader? Here is the Value-Line: CRM. The best volunteer gets an emailed prize. I will reply in full next week.
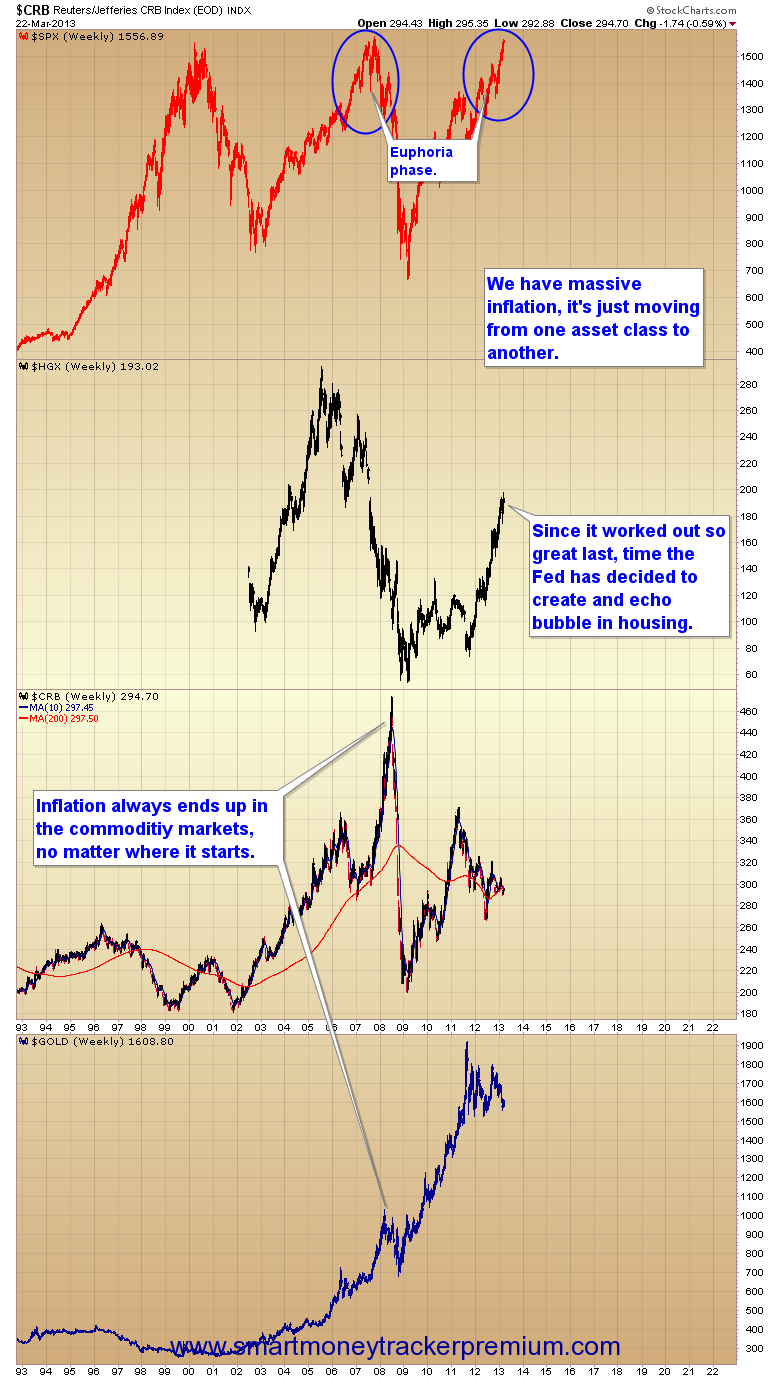
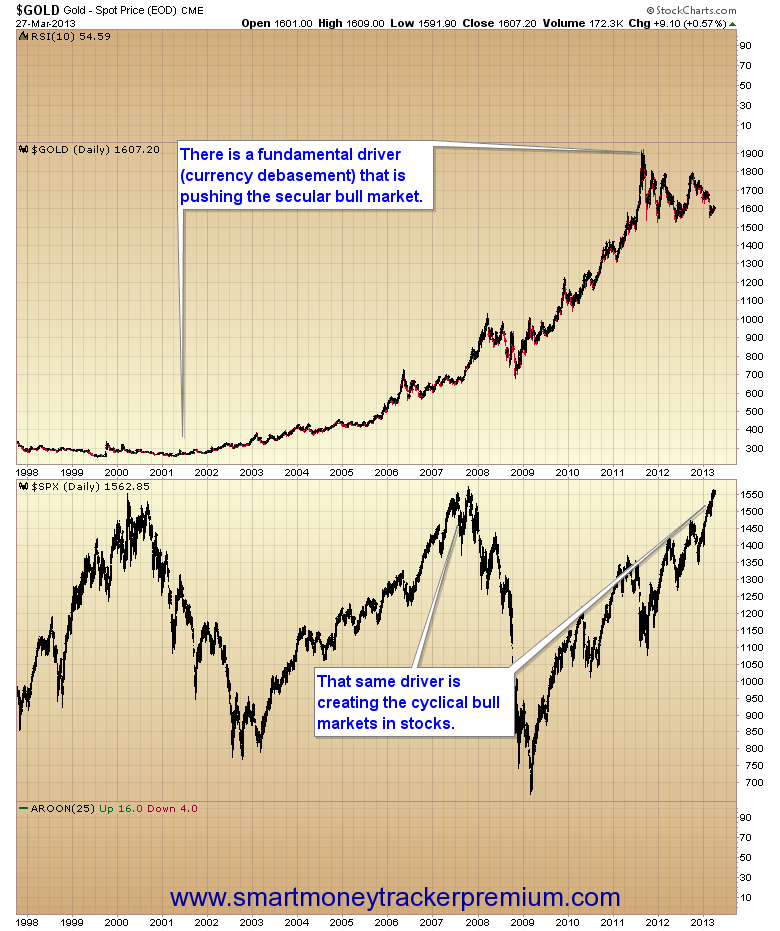
Remember that correlation is not causation. Our eyes make our minds extrapolate. I use charts to see if the current market facts jibe with my theoretical understanding. This current boom in stocks will need increasing amounts of credit and money to sustain its rise–but the day of reckoning is never eliminated–just prolonged as the mal-investment increases.
More on Bitcoin, Gold in Backwardation and money:Bitcoinand Acting MAn This is an important read to understand if you want to improve your understanding of money.
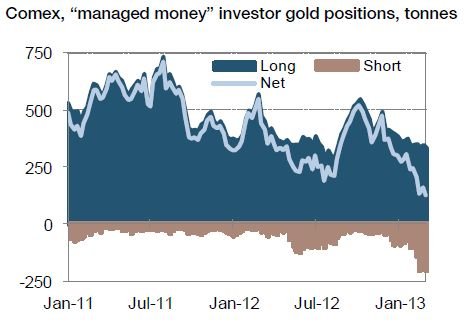
One argument is that managed money is bearish on gold. Whoa! So they were bullish in 2011 when gold hit $1,900 and now, after seventeen months, they are bearish? The chart below sure doesn’t support the sagaciousness of the “managed” money.
“All of man’s miseries derive from not being able to sit quietly in a room alone.” –Blaise Pascal
I placed the Value-Line for EXPD here http://wp.me/p2OaYY-1O6. Just click on the link then download from the link EXPD_VL in the post. If you haven’t done the valuation exercise do it now then you can compare with my brief thoughts. What would you pay?
I always go to check the pulse of the company—the return on total capital and return on shareholders’ equity. Both have averaged 20% over the past 10 years with excellent stability and no debt. I then glance at the balance sheet and see $1,367 in cash assets. Subtract uncapitalized leases of $45 million (as debt) then round down to $1,300 in cash then divide by 208 mil. shares to show $6.25 per share in excess cash. Let’s just say $6.00. The core business is quite profitable if it earns 20% returns on capital while holding $1.3 billion in cash. What will management do with that cash?
Sales have steadily risen since 1997 at about 9% per year until 2009 and then growth has dropped to 5% to 6%. But what is striking is the drop in sales in 2008 of $26.58 per share down to $19.30 in 2009—a drop of 27% while operating margins held steady at 10.5%. This business can adjust quickly or it has a high degree of variable costs. I am impressed with how this company remained profitable through the financial collapse. This is a question I should ask and answer through a visit to the 10-K and 8-Ks. This company provides a case study in how management looks at its business vs. Wall Street’s view. Read several years of the company’s 8-K filings. Go here: http://www.investor.expeditors.com/public-disclosure/2013/index.asp
The business seems asset light, so perhaps the source of competitive advantage is economies of scale through network effects. Try to uncover the source of the company’s competitive advantage.
Management owns 2.3% of this $8.5 billion dollar company so they have skin in the game. Good. Always be aware of incentives. Management has said that they may pursue share buybacks at current prices. Outstanding shares are slightly declining.
Cash flow has been steady and capex seems to be low. For 2013, $2.05 in “cash flow” (this cash flow is EBIDA but after taxes) then we deduct the $0.40 in capex to arrive at $1.65 in free cash flow. I place about an 11% cost of capital with about 4% to 5% growth so $1.65/(11% -4%) = $23.50 or $27.50 if I use a 5% growth number. This business grows with world trade since it is a logistics business.
Now we add back the excess cash in the business $6 to arrive at a value of $29.50 to $33.50. A 20% to 30% discount would put me at $27 to $23 to be a buyer of this business. I can’t expect more of a discount for such a stable, high return business—though subject to cyclical risks. Today (April 3, 2013) EXPD seems reasonably priced at $35. Watch and wait while getting answers to my questions.
This freakish central bank accumulation of dollar liabilities, in turn, was the result of the greatest money printing spree in world history. In essence, we printed and then they printed, and the cycle never stopped repeating. In this manner, the massive excess of dollar liabilities generated by the Fed were absorbed by its currency pegging counterparts, and then recycled into swelling domestic money supplies of yuan, yen, won, ringgit, and Hong Kong dollars.
As the US debt-based global monetary system became increasingly more unstable in recent years, central bank absorption of incremental Treasury debt reached stunning proportions. Thus, US publicly held debt rose by $6 trillion between 2004 and 2012, but upward of $4 trillion, or 70 percent, of this was taken down by central banks.
I could be truly said, therefore, that the worlds’ central banks have morphed into a global chain of monetary roach motels. The bonds went in, but they never came out. And therein lays the secret of “deficits without tears.”
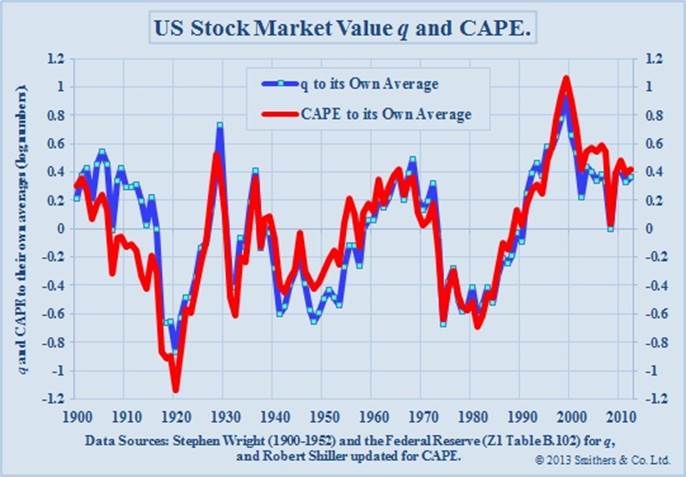
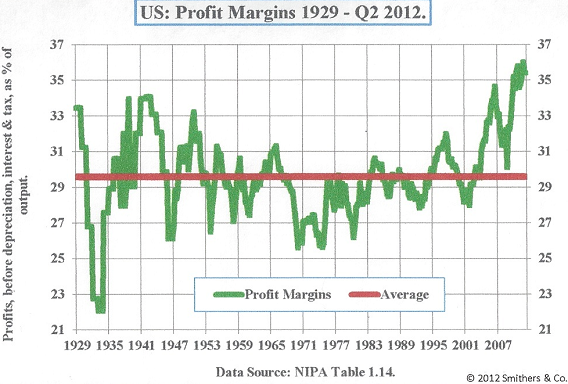
The chart is based on data through the end of 2012. Smithers notes “At that date the S&P 500 was at 1426 and US non-financials were overvalued by 44% according to q and quoted shares, including financials, were overvalued by 52% according to CAPE. With the S&P 500 at 1552 the overvaluation was 57% for non-financials and 65% for quoted shares.”
Unfortunately, that seems about right. Let’s translate this into an estimate of prospective 10-year total returns, assuming underlying nominal economic growth rate of about 6.3% (which may be optimistic, but is a robust peak-to-peak norm across economic cycles, and is unlikely to be pessimistic), and a dividend yield of about 2.2% on the S&P 500. With that, a 65% overvaluation in quoted shares, reverting to fair valuation a decade from now, would imply a 10-year annual nominal total return on the S&P 500 of 1.063*(1/1.65)^(1/10) + .022 – 1 = 3.3% annually. That’s right in line with the estimates we obtain from a wide range of other historically reliable approaches (historically reliable in italics, because the “Fed Model” is not).
Notice that in 1982, the -0.7 reading on Smithers’ log-scale chart implied that stocks were undervalued by exp(-0.7)-1 = -50%. At that point, with the dividend yield on the S&P 500 about 6.7%, one would have estimated a 10-year prospective total return for the S&P 500 of 1.063*(1/0.5)^(1/10)+.067 – 1 = 20.6% annually. One would have been correct.
In contrast, note that in 2000, the 1.0 reading implied that stocks were overvalued by exp(1.0)-1 = 172%. At that point, with the dividend yield on the S&P 500 at just 1.2%, one would have estimated a 10-year prospective total return for the S&P 500 of 1.063*(1/2.72)^(1/10)+.012 = -2.6% annually. Again, one would have been correct.
With due respect to Howard Marks and Warren Buffett
At present, we estimate a 10-year total return on the S&P 500 over the coming decade averaging just 3.5% annually, with zero total returns over a horizon of about 7 years, and expected losses for the S&P 500, including dividends, over shorter horizons.
…..The last four years of market advance have reduced FUTURE retruns.
While our estimates for 10-year total returns exceeded 10% annually near the 2009 market lows, the recent advance has, in effect, “eaten” most of those prospective returns. The well-admired bond manager Howard Marks is very correct when he notes “appreciation at a rate in excess of the cash flow accelerates into the present some appreciation that otherwise might have happened in the future.”
Where I differ from even Howard Marks and Warren Buffet here, is that if you are going to rely on a summary measure in order to value long-lived assets like stocks (both Marks and Buffett point to “forward operating earnings” today), that summary measure must be representative of the long-term stream of cash that investors can expect to receive over time. The hook today is that investors are using analyst estimates of next year’s operating earnings as if they are representative of the entire long-term stream, and that this one number can be used as a “sufficient statistic” for long-term corporate profitability.
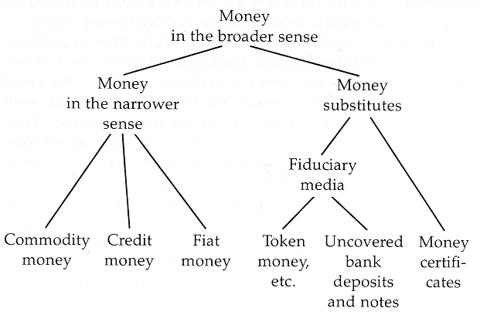
» Bitcoins cannot account for the regression theorem
»Bitcoins are the equivalent of token money
» Bitcoins are the opposite of anonymous
For context, Bitcoin is a newly formed digital currency which has rapidly grown in popularity (as well as in price) following the Cyprus banking system collapse. The chart below is the price performance of Bitcoins, which have seen a market cap expansion of almost 20x—from about $50mm to roughly $1B where it stands today—in less than one year.
A Ponzi on top of a Ponzi: http://video.cnbc.com/gallery/?play=1&video=3000148493 This story is unbelievable. A young guy decides to create fake boat titles from fake invoices that he then obtains loans on from his local banker. The banker doesn’t have the brains nor the energy to make a 90 second call to the boat manufacturer to verify the make and model. Nor does the banker even wonder how his customer obtained the money to have 53 yachts.
As the court documents reveal, the con man said it was in the interests of the banker to believe the con! (This I believe). As a plea for leniency, the conman’s lawyer stated that his client ONLY defrauded FDIC INSURED banks! Expect many more ponzis to be revealed. See: MichaelVorce_AmericanGreedStatement and Vorce_PleaTranscript
I hope you grasp how Carl’s methods fit his personality perfectly. I strongly suggest you view the video, then the research report by Lazard and finally tackle the book.
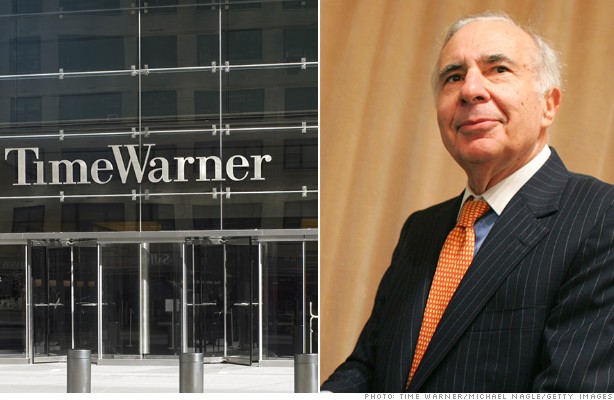
Seven years ago, activist investor Carl Icahn spelled out a blueprint for breaking up media conglomerate Time Warner (TWX) into four separate entities.
See Lazard’s 2006 Analysis on Time Warner for Icahn here (Good research example): lazard_twx
With this week’s decision by CNNMoney’s parent company to spin off Time Inc., Icahn’s prediction is finally coming true. But he won’t be able capitalize on it. By late 2008, Icahn had completely sold his stake.
In 2006, Icahn pushed for Time Warner to essentially split itself into a content company, a publishing company, a cable services company and an Internet company.
Time Warner’s Time Inc. spin-off will mark the final step in turning the company into exactly what Icahn and a consortium of other activist investors wanted.
Back then, many questioned Icahn’s case for breaking up Time Warner. Icahn’s main foe at the time, former Time Warner CEO Richard Parsons, won that battle. Parsons refused to break up Time Warner, but he agreed to buy back more stock to get Icahn to stop pushing for a breakup (and a new CEO). Icahn wanted to bring in former Viacom (VIA) CEO Frank Biondi to replace Parsons, who eventually stepped down as CEO in late 2007.
Under CEO Jeff Bewkes, who succeeded Parsons, Time Warner spun off Time Warner Cable (TWC) and AOL (AOL) in 2009. Shares of all three companies have solidly outperformed the broader market since those spin-offs.
While the two central characters in the Icahn vs. Time Warner showdown have stepped away from the battlefield, analysts and investors cheered this week’s spin-off announcement. Time Warner’s stock has gained nearly 3% since the spin-off was announced late Wednesday and is up nearly 19% so far this year.
Several analysts upgraded the stock and increased their price targets. “The announcement measurably improves Time Warner’s growth profile, margin profile, and rids the mother company of a business which has been under secular siege for quite some time,” B. Riley Caris analyst David Miller wrote in a research note.
Back in 2006, Lazard, working on behalf of Icahn and other shareholders, estimated the content side of Time Warner could be worth as much as $61 billion, while the publishing unit could be worth $14.1 billion.
Today, Credit Suisse analysts estimate that, post-spinoff, Time Warner’s content divisions could be worth as much as $75 billion, while Time Inc. would be worth about $4.1 billion.
—
Lecture by Icahn at Yale (He recommends reading Aristotle)

 Please join me in attending this course with a great teacher. See you in class!