Category Archives: Investor Psychology

BEING WRONG (VALE)

Brazil EM

Friday, September 25, 2015

No Mas, No Mas! The Vale Chronicles (Continued)!

Some of my Brazilian readers seem to be upset that I used “No Mas”, Spanish words, rather than Portuguese ones, in the title. To be honest I was not thinking about language, but instead about a boxing match from decades ago, where Roberto Duran used these words to give up in his bout with Sugar Ray Leonard.

I have used Vale as an illustrative example in my applied corporate finance book, and as a global mining company, with Brazilian roots, it allows me to talk about how financial decisions (on where to invest, how much to borrow and how dividend payout) are affected by the ups and downs of the commodity business and the government’s presence as the governance table. In November 2014, I used it as one of two companies (Lukoil was the other one) that were trapped in a risk trifecta, with commodity, currency and country risk all spiraling out of control. In that post, I made a judgment that Vale looked significantly under valued and followed through on that judgment by buying its shares at $8.53/share. I revisited the company in April 2015, with the stock down to $6.15, revalued it, and concluded that while the value had dropped, it looked under valued at its prevailing price. The months since that post have not been good ones for the investment, either, and with the stock down to about $5.05, I think it is time to reassess the company again.

vale

John Chew: At least the author has a process to reassess his investment.  I believe the critical flaw in his analysis (easy to say in hindsight) was not noting the massive mal-investment due to distorted credit markets caused by central bank policies. To normalize iron ore prices you would need pre-distortion prices going back twenty-five years.

Read more: No Mas!

Capitulation in Gold (Continued….)

Continuing from where we left off in the capitulation series, a case study, http://csinvesting.org/?p=11351

Gold-COT (1)

Silver-COT (1)

Precious-Metal-Short-Interest

The above charts show the massive swing in sentiment as speculators moved from long to short expecting gold to fall INEVITABLY to $1,000 or so the pundits say:

What's uglier than gold

Demand for gold bullion remains stronger than the supply offered through the futures market–the co-basis is rising:

letter-aug-9-gold

Meanwhile, could divergences be developing in miners vs. gold? Note prior bottoms in 1986 (bear market rally) and 2000, the beginning of a major rally.

bear divergence

HUI_2000_070815

HUI_gold_110815

Mining stocks shunned

Aug8.2015goldstocksvsspx1

This post is not a recommendation but compiling the case study of capitulation in gold and associated miners. Remember Why Gold Mining is a Tough Business_Pollitt (a MUST read!) and Why-is-gold-mining-such-a-crappy-business Summary and…

ray-dalio (2)

Templeton

http://thefelderreport.com/2015/07/21/its-time-to-get-greedy-in-the-gold-market/  John Chew: Don’t ever just concentrate in one gold stock since the company and operational risks can be high.  SDGJ by Sprott offers diversification and sensible companies. Sprott Junior ETF Mining. Why even consider investing in such a bad industry? Because of price and the counter-cyclical nature of these stocks. You buy when the industry is losing money and hated and sell when the pundits recommend it and the trend is forever extrapolated higher.  There is no law that miners won’t go lower; miners are extremely volatile moving up and down 10% in one day.

What Happens When You Buy Assets Down 80%? farber

We’ve done a lot of articles on value and drawdowns on the blog before (search the archives).  I was curious what happens when you bought the US equity sectors back when they were really hammered (French Fama to 1920s).

Average 3 year nominal returns when buying a sector down since 1920s:

60% = 57%

70% = 87%

80% = 172%

90% = 240%  The average of 80% to 90% down is a triple.


Average 3 year nominal returns when buying an industry down since 1920s:

60% = 71%

70% = 96%

80% = 136%

90% = 115%


Average 3 year nominal returns when buying a country down since 1970s:

60% = 107%

70% = 116%

80% = 118%

90% = 156%

Venezuela in Collapse; What we are reading

vz-grocery
Venezuelas Crisis Nears Tipping Point  The failure of socialism and interference in free exchange reaps a bitter harvest for the people. 
brazil-currency
10 THINGS WE’RE READING & WATCHING:
      3.   John Paulson on Gold – Reuters
      4.   Bill Ackman on CEOs – CNBC
      5.   Crossfit’s Business Model – Quartz
      6.   A Conversation with Peltz and Ackman – Jim Cramer (CNBC)
      7.   Viewing Stocks As Bonds

 – Donald Yacktman

     9.   Podcasts: The Innovator’s Dilemma
      10. Letters: FairholmeTocqueville | Third Point | ML | GMO
HAVE A GREAT WEEKEND!  Sign up at support@investorvantage.com for news on investing.
The End of the Central Bank Mal-Investment now comes deflation. 

Perpetual Capitulation

macrocosm-600x294

An ode to the end of a con

How long can deception go on?

When prices are set By banks printing debt

All trust in the “markets” is gone!

There is no stand-alone Narrative regarding gold today (June 2013), as there was in 1895. Today gold is understood from a Common Knowledge perspective only as a shadow or reflection of a powerful stand-alone Narrative regarding central banks, particularly the Fed … what I will call the Narrative of Central Banker Omnipotence. Like all effective Narratives it’s simple: central bank policy WILL determine market outcomes. There is no political or fundamental economic issue impacting markets that cannot be addressed by central banks. Not only are central banks the ultimate back-stop for market stability (although that is an entirely separate Narrative), but also they are the immediate arbiters of market outcomes. Whether the market goes up or down depends on whether central bank policy is positive or negative for markets. The Narrative of Central Banker Omnipotence does NOT imply that the market will always go up or that central bank policy will always support the market. It connotes that whatever the central bank policy might be, it will drive a market outcome; whatever the market outcome, it was driven by a central bank policy.

The stronger the Narrative of Central Banker Omnipotence, the more likely it is that the price of gold goes down. The weaker the Narrative – the less established the Common Knowledge that central bank policy determines market outcomes – the more likely it is that the price of gold will go up. In other words, it’s not central bank policy per se that makes the price of gold go up or down, it’s Common Knowledge regarding the ability of central banks to control economic outcomes that makes the price of gold go up or down.

Instead, the focus of the mainstream Narrative effort moved almost entirely towards what open-ended QE signaled for the Fed’s ability and resolve to create a self-sustaining economic recovery in the US. And it won’t surprise you to learn that this Narrative effort was overwhelmingly supportive of the notion that the Fed could and would succeed in this effort, that the Fed’s policies had proven their effectiveness at lifting the stock market and would now prove their effectiveness at repairing the labor market. Huzzah for the Fed!

See 6_30_13-HOW-GOLD-LOST-ITS-LUSTER-THE-ALL-WEATHER-FUND-GOT-WET-AND-OTHER-JUST-SO-STORIES  and   A Negative Narrative on Gold

gold IR

Negative News Tends to Cluster at MAJOR bottoms:

  1. Gold Could Go To $350
  2. Gold Sends a Message
  3. Gold Could Plunge to $800

My Jaw Dropped: Long gold, short US stocks, Short US Dollar

3-Gold-Optix-1024x641
low gold

Zeal073115A

commodities and emerging market equities

Commodities

Will the US Dollar Continue its Rampage Higher? 272660136-Raoul-Pal-GMI-July2015-MonthlyRate hikes and goldRate hikes are “bad” for gold?

rising rates bad for gold
Zweig Calls HighStocktoCommodityAtAllTimeHighInvestors above flee tangible assets for financial assets. Taken to an extreme, input costs for companies will go to zero and profit margins to infinity. Reality?

Biotech Fantasy2Biotech Fantasy

Capitulation IV; Analysts Like to Herd; Agony and Euphoria

Miner Sentiment

Bloomberg hating on gold. “Looks like a short”, “Nothing uglier”, “Not even an asset”…AFTER miners drop 90%.

What's uglier than gold

“The Direxion Daily Gold Miners Bear 3X Shares, or DUST, is up a whopping 99 percent in July.” via @

Grant on gold July 22 2015 Zweig   The same analyst who suggested buying miners within 1% of the all-time top in Sept. 17, 2011 now says gold is a “doorstop” in July 17, 2015.  NOW, he tells me!  Journalists chase price and sentiment.

Zweig

Goldman sees gold to $1,000 (July 2015) and Goldman sees gold at 1840 by end 2012  Note a pattern?

gold_10_year_o_b_usd

Media piles on late in trend:

Perhaps today the absurdity has reached the apex of its crescendo with this utterly ridiculous “letter to gold bug” published by Marketwatch:   It’s time to surrender and let the yellow metal fall to its bear market low

Better analysis: Gold Warns Again and Heavy wears the crown

yen and gold

Amazon Beats

AMZN

amzn 1 yr

How analysts react after Amazon reports–follow the herd recommendations regardless of price. Analysis?

http://www.bloomberg.com/news/articles/2015-07-24/wall-street-cranks-up-its-outlook-for-amazon-after-it-delivers-monster-earnings-report

The headlines reported that AMZN’s sales were up 20% year over year for Q2 and that net income had swung from a loss of $123mm to a profit of $92 million yr/yr for Q2.  While those numbers are what they are, sales growth from Q1 to Q2 was a mere 2.9% – pretty much in-line with the rate of inflation.

The media propagandists attributed AMZN’s highly “surprising” quarter to big gains in its AWS business segment, which is its cloud-computing business.  However, if we drill down into the numbers made available in its 8-K, we find that the AWS segment represents just 7.7% of AMZN’s revenue stream vs. 6.6% of revenues in Q1.   Sure seems like a lot of manic hype over well less than 10% of AMZN’s business model.

As it turns out, AMZN’s AWS business model, like everything else it does, is seeded in low quality sources of revenue that will ultimately prove to be unsustainable.  Why?  See this comment sent to me by someone who read my Amazon research report and who used to specialize in high tech accounting for Silicon Valley start-ups:

I audited many of the high fliers that crashed and burned, took companies public & was at the printers the day the bubble really burst which ultimately tabled that IPO…Amazon Web Services is growing by leaps and bounds and a significant amount of those $’s are coming from venture backed start-ups. Almost the entire Silicon Valley and other startups outside the Valley use AWS. Venture backed startups have exploded just as AWS revenues have exploded…That segment of their business will get walloped which right now seems to be a main source of their operating income.  

Read more: Dot con

Notice the difference between mining stocks and Amazon–Deja-Vu of the late 1999’s/2000.  Remember the music Sugar Ray

amzn fomo

bezos_laughing

Capitulation Selling-A Real-Time Case Study

T-XAU-SP

The chart above shows an index of gold and silver miners relative to the S&P 500, breaking now to a new extreme.  Will the world need to produce and find more minerals and metals or will the world just need health care and bio-tech?

letter-jul-19-gold

The read line is the co-basis that is rising as the dollar rises relative to gold. This indicates rising demand for physical and more futures selling. Bullish.

So who is selling?

The Fed’s decision to restock the rate toolkit has got the gold market very nervous,” George Zivic, a New York-based portfolio manager at OppenheimerFunds Inc., which oversees $235 billion, said by phone. “We have already seen that gold did not perform as a safe-haven investment. There is not a single motivating reason to own gold.”

CKT5wyiUYAAopBy

Who knows, perhaps money managers are funding their long equity positions with short gold positions.

“It looks like the end of an era for gold,” said Howie Lee, analyst at Phillip Securities in Singapore, adding that China had been grappling with oversupply after importing a record volume in 2013.

wmc150720b

Money managers (a few of them) finally see gold as undervalued.

Gold_Valuation1

Gold_CoT_Chart1

Gold_Specs

GLD_Sentiment

I am posting this so as to have a record of certain market events.  I seek out where the most marginal or urgent seller is operating AFTER a long decline (four years).

NUGT_Sentiment

Quantitative Blow-Ups: We are all doing the same thing.

“We Are All Doing The Same Thing”

I recently listened to a podcast with some all-star [there are awards for everything now] “Black Box” equity trader. It was quite a “telling” interview & I thank him for his insights but I’d heard it all before. His confidence was staggering considering the general unpredictability of the future and, of course, the equity markets. He explained how he had completely converted from a generally unsuccessful, discretionary technical trading style to a purely quantitative and scientific trading mode. He seemed to be so excited that his models, according to him, were pretty much “bullet proof”. Having had more than just some tangential experience with black box modeling and trading myself I thought … you know … some people will just never learn.


maxresdefault

Image via iwatchapple.it


You see some years ago I was particularly focused on quantitative investing. Basically, “screw” the fundamentals and exclusively concentrate on price trends/charts and cross security/asset correlations [aka “Black Box” trading]. I was fascinated with the process and my results were initially stellar [high absolute returns with Sharpe Ratios > 2.0]. And, after looking at the regression data many others agreed. I was in high demand. So I “made the rounds” in Manhattan and Greenwich to a group of high profile hedge funds. It was a very exciting time for me as the interest level was significant.

As it turned out I had the good fortune of working with one of the world’s largest and best performing hedge funds. Their black box modeling team had been at it for years … back-testing every conceivable variable from every perceived angle … twisted/contorted in every conceivable/measurable manner … truly dedicated to the idea that regression tested, quantitative trading models were the incremental/necessary “edge” to consistently generate alpha while maximizing risk-adjusted, absolutely positive returns. We worked together for some time and I became intimately involved with their quantitative modeling/trading team … truly populated with some of the best minds in the business.

While in Greenwich Ct. one afternoon I will never forget a conversation I had with a leading quantitative portfolio manager. He said to me that despite its obvious attributes “Black Box” trading was very tricky. The algorithms may work for a while [even a very long while] and then, inexplicably, they’ll just completely “BLOW-UP”. To him the most important component to quantitative trading was not the creation of a good model. To him, amazingly, that was a challenge but not especially difficult. The real challenge, for him, was to “sniff out” the degrading model prior to its inevitable “BLOW-UP”.

And I quote his humble, resolute observation:


because, you know, eventually they ALL blow-up


… as most did in August 2007.

It was a “who’s who” of legendary hedge fund firms that had assembled “crack” teams of “Black Box” modelers: Citadel, Renaissance, DE Shaw, Tudor, Atticus, Harbinger and so many Tiger “cubs” including Tontine [not all strictly quantitative but, at least, dedicated to the intellectual dogma] … all preceded by Amaranth in 2006 and the legendary Long Term Capital Management’s [picking up pennies in front of a steam-roller] demise one decade earlier.

Years of monthly returns with exceedingly low volatility were turned “inside out” in just 4-6 weeks as many funds suffered monthly losses > 20% which was previously considered highly improbable and almost technically impossible … and, voilà … effectively, a sword was violently thrust through the heart of EVERY “Black Box” model. VaR and every other risk management tool fell victim to legitimate liquidity issues, margin calls and sheer human panic.

Many of these firms somehow survived but only by heavily gating their, previously lightly-gated, quarterly liquidity provisions. Basically, as an investor, you could not “get out” if you wanted to. These funds changed the liquidity rules to suit their own needs … to survive … though many did fail.

Anyway … to follow up on my dialogue with the esteemed portfolio manager … I asked why do they all “BLOW-UP”? What are those common traits that seem to effect just about every quantitative model despite the intellectual and capital fire-power behind them? And if they all eventually “BLOW-UP” then why are we even doing this?”

He answered the second part of the question first … and I paraphrase …


“We are all doing this because we can all make a lot of money BEFORE they “BLOW-UP”. And after they do “BLOW-UP” nobody can take the money back from us.” He then informed me why all these models actually “BLOW-UP”. “Because despite what we all want to believe about our own intellectual unique-ness, at its core, we are all doing the same thing. And when that occurs a lot of trades get too crowded … and when we all want to liquidate [these similar trades] at the same time … that’s when it gets very ugly.“.


I was so naive. He was so right.


Exactly What Were We All Doing?

We all knew what the leaders wanted and, of course, we wanted to please them. Essentially they wanted to see a model able to generate 4-6% annual returns [seems low, I know, but I’ll address that later] … with exceptionally low volatility, slim draw-down profiles and winning months outweighing the losing months by about 2:1. They also wanted to see a model trading exceptionally liquid securities [usually equities].

Plus the model, itself, had to be completely scientific with programmable filtering and execution [initiation and liquidation] features so that it could be efficiently applied and, more importantly, stringently back-tested and stress-tested . Long or short did not really matter. Just make money within the parameters. Plus, the model had to be able to accommodate at least $100M [fully invested most of the time as cash was not an option] and, hopefully, much more capital. This is much easier said than done but, given the brainpower and financial resources, was certainly achievable.


This is what all the “brainpower” learned … eventually.

First of all, a large number of variables in the stock selection filter meaningfully narrowed the opportunity set … meaning, usually, not enough tickers were regularly generated [through the filter] to absorb enough capital to tilt the performance meter at most large hedge funds…as position size was very limited [1-2% maximum]. The leaders wanted the model to be the hero not just a handful of stocks. So the variables had to be reduced and optimized. Seemingly redundant indicators [for the filter] were re-tested and “tossed” and, as expected, the reduced variables increased the population set of tickers … but it also ramped the incremental volatility … which was considered very bad. In order to re-dampen the volatility capital limits on portfolio slant and sector concentration, were initiated. Sometimes market neutral but usually never more than net 30% exposure in one direction and most sectors could never comprise more than 5% of the entire portfolio. We used to joke that these portfolios were so neutered that it might be impossible for them to actually generate any meaningfully positive returns. At the time of “production” they actually did seem, at least as a model, “UN-BLOW-UP-ABLE” considering all the capital controls, counter correlations and redundancies.

Another common trait of these models that was that, in order to minimize volatility, the holding periods had to be much shorter than a lot of us had anticipated. So execution [both initiation and liquidation] became a critical factor. Back then a 2-3 day holding period was considered acceptable, but brief, although there were plenty of intra-day strategies … just not at my firm … at least not yet. With these seemingly high velocity trading models [at the time], price slippage and execution costs, became supreme enemies of forecasted returns. To this day the toughest element to back-testing is accessing tick data and accurately pinpointing execution prices. Given this unpredictability, liberal price slippage was built into every model … and the model’s returns continued to compress … not to mention the computer time charges assessed by the leadership [which always pissed me off].

So, given all of this, what types of annual returns could these portfolios actually generate? A very good model would generate a net 5-7% … but 3.5-5% was acceptable too. So how then could anybody make any real money especially after considering the labor costs to construct/manage/monitor these models … which … BTW … was substantial?

Of course there was only one real way … although it would incrementally cut into performance even more, in the near term, but ultimately pay off if the “live” model performed as tested. The answer = LEVERAGE … and I mean a lot of it … as long as the volatility was low enough.

Back-tested volatility was one thing and live model volatility was another thing so leverage was only, ever so slowly, applied … but as time passed and the model performed, the leverage applied would definitely increase. Before you knew it those 5% returns were suddenly 20-25% returns as the positive beauty of leverage [in this case 4-5x] was unleashed.

Fast forward 10 years and the objectives of hedge funds are still the same. Generate positive absolute returns with low volatility … seeking the asymmetrical trade … sometimes discretionary but in many cases these “Black Box” models still proliferate. And BTW … they are all “doing the same thing“ as always … current iteration = levered “long” funds.

What has changed though is the increased dollars managed by these funds [now > $3.5T] and the concentration, of these dollars, at the twenty largest funds [top heavy for sure]. What has also considerably changed is the cost of money … aka leverage. It is just so much cheaper … and, of course, is still being liberally applied but, to reiterate, in fewer hands.

Are these “hands” any steadier than they were ten years ago? I suppose that is debate-able but my bet is that they are not. They are still relying on regression-ed and stress tested data from the past [albeit with faster computers & more data]. They may even argue that their models are stronger due to the high volatility markets of ’08/’09 that they were able to survive and subsequently measure, test and integrate into their current “Black Boxes” … further strengthening their convictions … which is the most dangerous aspect of all.

Because …

  1. Strong Conviction … aka Over Confidence +
  2. Low Volatility +
  3. High Levels/Low Costs of Leverage [irrespective of Dodd-Frank] +
  4. More Absolute Capital at Risk +
  5. Increased Concentration of “At Risk” Capital +
  6. “Doing the Same Thing”

… Adds up to a Combustible Market Cocktail.

Still a catalyst is needed and, as always, the initial catalyst is liquidity [which typically results in a breakdown of historic correlations as the models begin to “knee-bend” … and the perceived safety of hedges is cast in doubt] followed by margin calls [the ugly side of leverage … not to mention a whole recent slew of ETF’s that are plainly levered to begin with that, with the use of borrowed money, morph into “super-levered” financial instruments] and concluding with the ever ugly human panic element [in this case the complete disregard for the “black box” models even after doubling/trebling capital applied on the way down because the “black box” instructed you to]. When the “box” eventually gets “kicked to the curb” … that is when the selling ends … but not after some REAL financial pain.

So can, and will, this really occur once again? It can absolutely occur but it is just impossible to know exactly when … although there are plenty of warning signs suggesting its likelihood … as there have been for some time.

However, I am quite confident of the following:

  1. The Fed Is Clueless On All Of This
    [just too many moving parts for them … they cannot even coordinate a simple “cover-up” of leaked monetary policy … so no way the academics can grasp any of this … just liked they missed LTCM. Nor it seems…do they have any interest in it as it is too tactical for a strategically inclined central banker].
  2. Eventually They ALL Blow-Up
  3. The Only Real Question Left To Answer =
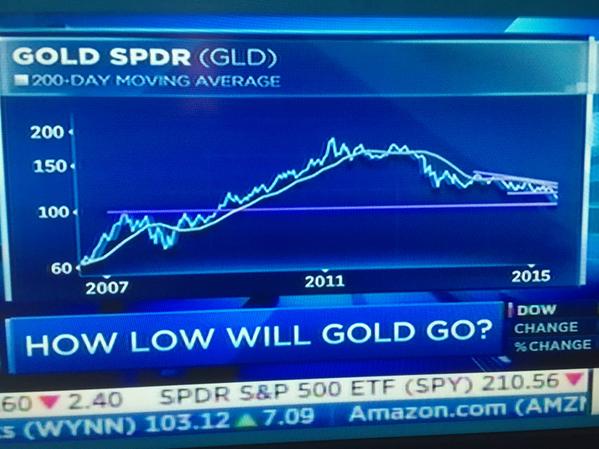
    HOW BIG CAN THIS POSSIBLE “BLOW-UP” ACTUALLY BE? I think … if the pieces simultaneously shudder … then pretty BIG

www.acting-man.com


Blame Management and Human Sacrifice

debt-more-debt-and-GDP-1024x583Buffett-Indicator-with-Wilshire-5000

wmc150615b

http://hussmanfunds.com/wmc/wmc150615.htm   Never in market history has the MEDIAN stock been so highly priced relative to valuation metrics.

wmc150615d


—-

Buy the Accused, Sell the Acclaimed

Going back to behavioral finance and what causes cheapness: Blaming Management and Human Sacrifice

Buying Distress and Falling Knives or the “No Hope” Portfolio.

Symbol Company Price Shares Amount Comm. Total Date
CLD Cloud Peak Energy 4.66 1071  $ 4,991 8  $ 4,999 6/14/2015
BTU Peabody Energy 2.47 2020  $ 4,989 8  $   4,997 6/14/2015
CNX Consol Energy 25.51 196  $5,000 8  $   5,008 6/14/2015
Completed 1:14 EST  $15,004.00 6/14/2015

I am buying a basket of coal miners today with different characteristics. CNX is not a pure coal company. Peabody is more of a stub stock since its market cap is about 1/10th its debt–scary!  I will add on a further 25% decline.  Holding period: five years.  I recommend that anyone reading this NOT follow me. Do your own thinking or mis-thinking as the case may be.

We also don’t want to confuse low nominal prices or declining prices with “cheapness.” There are plenty of junior resource stocks trading for pennies that are worth $0.  Microcap_stock_fraud

Lot’s of hope:http://www.fool.com/investing/general/2011/06/20/the-hottest-sector-you-still-refuse-to-watch.aspx.

Better when there is no hope:btu

Catch a Falling Knife

half full

We left off at Regression to the Mean Part II here:http://csinvesting.org/?p=10996

We skip Chapter Six (for now) and focus on Chapter 7 in DEEP VALUE: Catch a Falling Knife: The Anatomy of a Contrarian Value Strategy

In Search of Un-Excellence

The authors identified 36 publicly traded “excellent companies” on the basis of out-performance in six criteria, measured from 1961 to 1980.

  1. Asset growth
  2. Equity growth
  3. Return on total capital
  4. Return on equity
  5. Return on sales
  6. Market to book value

Then an investment analysts, Michelle Clayman, identified 39 publicly traded “un-excellent companies” which ranked in the bottom third of all Peters and Waterman’s criteria from 1976 to 1980.   These “in search of disaster” companies outperformed 24.4% pa over five years vs. 12.7% for the “excellent” companies.

The good companies under-perform because the market overestimates their future growth and future return on equity and, as a result, accords the stocks overvalued price-to-book ratios; the converse is true of the poor companies.

Over time, company results have a tendency to regress to the mean as underlying economic forces attract new entrants to attractive markets and encourage participants to leave low-return businesses. Because of this tendency, companies that have been good performers in the past may prove to be inferior investments, while poor companies frequently provide superior investment returns in the future.”

Note pages 128 to 136 in DEEP VALUE: Tables 7.1 to 7.9

Stocks in the Contrarian Value portfolios were cheaper than the comparable Glamour portfolios on every metric but on a Price-to-Earnings basis, possibly because the earnings in those portfolios were so weak.

First, valuation is more important than growth in constructing portfolios.

Cheap, low growth portfolios systematically outperform expensive, high-growth portfolios, and by wide margins.  It seems that the uglier the stock, the better the return, even when the valuations are comparable. Oppenheimer found in a study on Ben Graham Net/Nets that loss making and non-dividend paying net/nets outperform profitable, dividend-paying net/nets. Ben Graham Net Current Asset Values A Performance Update

In almost any study, the cheap, hated, ugly, least-admired, and poorly performing stock outperforms the high-growth, glamour stocks.

What these studies demonstrate is that mean reversion is a pervasive phenomenon, and one that we don’t intuitively recognize. Our untrained instinct is to pursue the glamorous stock, the high-growth stock, the story stock, the excellent stock, the admired stock, the A+ stock, or even the profitable net net, but study after study shows that this instinct leads us to under-perform. Buying well-run companies with good businesses at bargain prices seems to make even more sense. The research shows , however, that the better investment–rather than the better company–the value stock, the scorned, the unexcellent, the Ds, the loss-making net nets.  And the better value stock, according to Lakonishok, Shleifer, and Vishny’s research is the low-no-growth value stock, what they describe as “contrarian value,”

What is clear is that value investing in general, and deep value (buying the ugliest of ugly) in particular, is exceedingly behaviorally difficult. It is counter-intuitive and against instinct, which is why many investors shy away from it.

Lecture by Toby Carlisle on Deep Value Investing

Next Lesson:

We will finish up this chapter by covering The Broken-Leg Problem. Please give this chapter a close study–the conclusions are extremely COUNTER-INTUITIVE and the opposite of what most investors look for.  We are at the heart of deep value investing.

Mean Reversion Part II

roman-orgy-vasily-alexandrovich-kotarbinsky

Roman Orgy

Last post on Part 1:http://csinvesting.org/?p=10984

Why does high growth seem to depress stock market returns and low growth seem to generate high stock market returns? It is not the growth destroys returns, but that the market already recognizes the high-growth nation’s potential, and bids the price of its equities too high. Market participants become overly optimistic during periods of high growth, driving up the prices of stocks and lowering long-term returns, and become too pessimistic during busts, selling down stocks and creating the conditions for high long-term returns.   Jay Ritter says that irrationality generates volatility “and mean reversion over multi-year horizons.” Graham would agree (p. 88, DEEP VALUE).

The implications for mean reversion in stocks are counter-intuitive. Stocks with big market price gains and historically high rates of earnings growth tend to grow earnings more slowly in the future, and underperform the market. Stocks with big market prices losses and historically declining earnings tend to see their earnings grow faster, and out perform the market. Undervalued stocks with historically declining earnings grow earnings faster than overvalued stocks with rapidly increasing earnings. This is mean reversion, and, as Ben Graham said, it’s the phenonmenon that leads value strategies to beat the market.

The update to Lakonishok’s research Contrarian Investments Extrapolation and Risk demonstrates that, aside from short periods of under-performance, value stocks generate a consistent value premium, and beat both the market and glamour stocks over the long haul. ….Researchers believe the reasons are because they are contrarian to overreaction and naive extrapolation. Efficient market academics Eugene Fama and Ken French, counter that value strategies outperform because they are riskier.  However, Lakonishok found that while value strategies do disproportionately well in good times, its performance in bad times is also impressive.  Value strategies are also outperform during “bad” states for the world such as recession and extreme down markets.

When Lakonishok compared the growth rates implied by the market price to the actual growth rates appearing after the selection date, they found a remarkable result–one that supports Graham’s intuition–value stocks grow fundamentals faster than glamour stocks.  The high prices paid for glamour stocks imply that the market expects them to generate high rates of growth. Contrary to this expectation, however, the growth rates do not persist.  Growth stocks;s growth rates mean-revert from fast growth to slow growth.

SUMMARY

If you read all the links and research papers in the past two posts for this chapter in DEEP VALUE, you know that:

  • Out-of-favor value stocks beat glamour stocks because….
  • the actual growth rates of fundamental sales and earnings of glamour stocks relative to value stocks after selection are much lower than they were in the past, or as the multiples on those stocks indicate the market expects them to be.
  • Value strategies appear to be less risky than glamour strategies.

So why do investors persist in buying glamour? For behavioral reasons like anchoring and “overreaction bias.”   We will next explore chapter 6 in Deep Value.

BAD BUSINESSES

http://aswathdamodaran.blogspot.com/

Autos a Bad Business Damordaran Blog

HAVE A GREAT WEEKEND!