Category Archives: Risk Management

R-T-M, Gross Profitability, Magic Formula

Our last lesson was in Mean Reversion (Chapter 5 in Deep Value) discussed http://wp.me/p2OaYY-2Ju  View this video on a very MEAN Reversion.

We must understand full cycles and reversion to the mean.  Let’s move on to reading Chapter 2: A Blueprint to a better Quantitative Value Strategy in Quantitative Value.

Investors should be skeptical of history-based models. Constructed by a nerdy-sounding priesthood using esoteric terms such as beta, gamma, sigma and the like, these models tend to look impressive. Too often, though, investors forget to examine the assumptions behind the symbols. Our advice: Beware of geeks bearing formulas. -Warren Buffett, Shareholder Letter, 2000.

A WONDERFUL BUSINESS

Greenblatt defined Buffett’s definition of a good business as a high Return on Capital (ROC) – EBIT/Capital

Capital is defined as fixed asses + working capital (current assets minus current liabilities) minus excess cash.

ROC measures how efficiently management has used the capital employed in the business. The measure excludes excess cash and interest-bearing assets from this calculation to focus only on those assets actually used in the business to generate the return.

A BARGAIN PRICE

High earning yield = EBIT/TEV

TEV + Market Cap. + Total debt – minus excess cash + Preferred Stock + minority interests, and excess cash means cash + current assets – current liabilities.EBIT/TEV enables and apples-to-apples comparison of stock with different capital structures.

Improving on the Magic Formula?

ROC defined as Gross profitability to total assets.

GPA = (Revenue – Cost of Goods Sold)/Total Assets

GPA is the “cleanest” measure of true economic profitability.

See this study Gross Profitability a Better Metric and see pages 46-49 in Quant. Value. (the book was sent to deep-value group on Google)

The authors found GPA outperformed as a quality measure the magic formula.  Note on page 48, Table 2.3: Performance Stats for Common Quality Measures (1964 – 2011) that most simple quality measures do NOT provide any differentiation from the market!

FINDING PRICE, Academically–Book value/Market Price

The authors found that analyzing stocks along price and quality contours using the Magic Formula and its generic academic brother Quality and Price can produce market beating results 

The authors: “Our study demonstrates the utility of a quantitative approach to investing. Relentlessly pursuing a small edge over a long period of time, through booms and busts, good economies and bad, can lead to outstanding investment results.”

Ok, let’s come back to quality and avoiding value/death traps in the later chapters (3 and 4) in Quantitative Value.  We are just covering material in Chapter 2. 

INVESTORS BEHAVING BADLY

Investors and the Magic Formula

Adding Your Two Cents May Cost a Lot Over the Long Term by Joel Greenblatt
01-18-2012  (Full article: Adding Your Two Cents

Gotham Asset Management managing partner and Columbia professor Joel Greenblatt explains why investors who ‘self-managed’ his Magic Formula using pre-approved stocks underperformed the professionally managed systematic accounts.

So, what happened? Well, as it turns out, the self-managed accounts, where clients could choose their own stocks from the pre-approved list and then follow (or not) our guidelines for trading the stocks at fixed intervals didn’t do too badly. A compilation of all self-managed accounts for the two-year period showed a cumulative return of 59.4% after all expenses. Pretty darn good, right? Unfortunately, the S&P 500 during the same period was actually up 62.7%.

“Hmmm….that’s interesting”, you say (or I’ll say it for you, it works either way), “so how did the ‘professionally managed’ accounts do during the same period?” Well, a compilation of all the “professionally managed” accounts earned 84.1% after all expenses over the same two years, beating the “self managed” by almost 25% (and the S&P by well over 20%). For just a two-year period, that’s a huge difference! It’s especially huge since both “self-managed” and “professionally managed” chose investments from the same list of stocks and supposedly followed the same basic game plan.

Let’s put it another way: on average the people who “self-managed” their accounts took a winning system and used their judgment to unintentionally eliminate all the outperformance and then some! How’d that happen?

1. Self-managed investors avoided buying many of the biggest winners.

How? Well, the market prices certain businesses cheaply for reasons that are usually very well-known (The market is a discounting mechanism). Whether you read the newspaper or follow the news in some other way, you’ll usually know what’s “wrong” with most stocks that appear at the top of the magic formula list. That’s part of the reason they’re available cheap in the first place! Most likely, the near future for a company might not look quite as bright as the recent past or there’s a great deal of uncertainty about the company for one reason or another. Buying stocks that appear cheap relative to trailing measures of cash flow or other measures (even if they’re still “good” businesses that earn high returns on capital), usually means you’re buying companies that are out of favor.

These types of companies are systematically avoided by both individuals and institutional investors. Most people and especially professional managers want to make money now. A company that may face short-term issues isn’t where most investors look for near term profits. Many self-managed investors just eliminate companies from the list that they just know from reading the newspaper face a near term problem or some uncertainty. But many of these companies turn out to be the biggest future winners.

2. Many self-managed investors changed their game plan after the strategy under-performed for a period of time.

Many self-managed investors got discouraged after the magic formula strategy under-performed the market for a period of time and simply sold stocks without replacing them, held more cash, and/or stopped updating the strategy on a periodic basis. It’s hard to stick with a strategy that’s not working for a little while. The best performing mutual fund for the decade of the 2000’s actually earned over 18% per year over a decade where the popular market averages were essentially flat. However, because of the capital movements of investors who bailed out during periods after the fund had underperformed for a while, the average investor (weighted by dollars invested) actually turned that 18% annual gain into an 11% LOSS per year during the same 10 year period.[2]

3. Many self-managed investors changed their game plan after the market and their self-managed portfolio declined (regardless of whether the self-managed strategy was outperforming or underperforming a declining market).

This is a similar story to #2 above. Investors don’t like to lose money. Beating the market by losing less than the market isn’t that comforting. Many self-managed investors sold stocks without replacing them, held more cash, and/or stopped updating the strategy on a periodic basis after the markets and their portfolio declined for a period of time. It didn’t matter whether the strategy was outperforming or underperforming over this same period. Investors in that best performing mutual fund of the decade that I mentioned above likely withdrew money after the fund declined regardless of whether it was outperforming a declining market during that same period.

4. Many self-managed investors bought more AFTER good periods of performance.

You get the idea. Most investors sell right AFTER bad performance and buy right AFTER good performance. This is a great way to lower long-term investment returns.

Luck-versus-skill-in-mutual-fund-performance by Fama

….We will finish the chapter with a study of checklists in the next post.

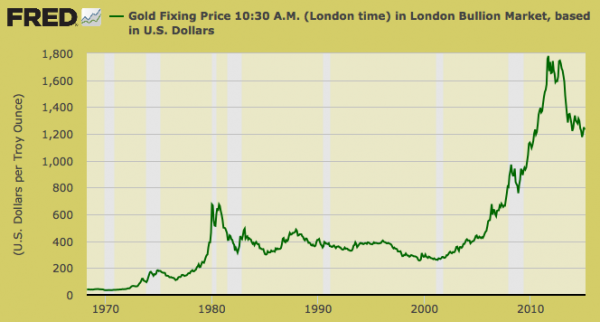
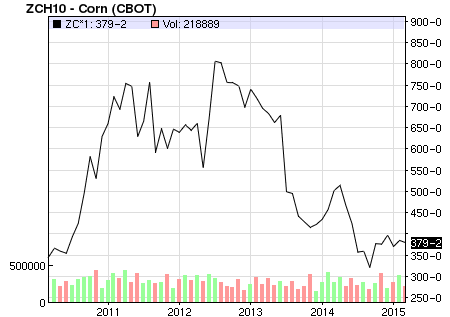
Interesting reading: The Crescent Fund (note reversion to the mean)  Oil Crash Pzena and http://aswathdamodaran.blogspot.com/

Go-where-it-is-darkest-when-company.html (Vale-Brazilian Iron Ore Producer).   Prof. Damordaran values Vale and Lukoil on Nov. 20, 2015.  I am looking at Vale because they have some of the lowest cost assets of Iron Ore in the world.  They have good odds of surviving the downturn but where the trough is–who knows. 

Valuing Cyclical Companies:

Valuing Cyclical Commodity Companies

CS on a Cyclical Business or Thinking About Cypress Stock

Letter to Cypress Shareholders about Price vs Value

download_t_j__rodgers__cdc_2002_keynote_presentation

CY_VL

39_studie_value_creation_in_chemical_industry

vale

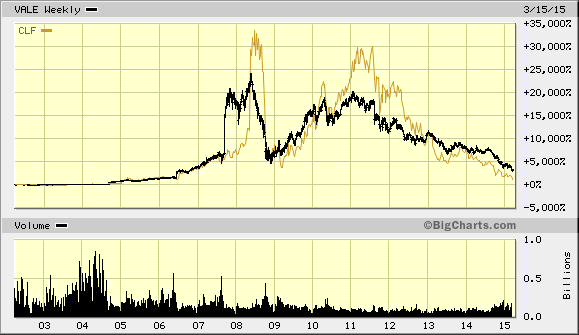
I think the author at least knew of the risks, but underestimated the extent of the cycle due to massive distortions caused by the world’s central banks.  It did get darker..as iron prices fell another 10% and still falling. 

Month Price Iron Ore Change
Aug 2014 92.63
Sep 2014 82.27 -11.18 %
Oct 2014 80.09 -2.65 %
Nov 2014 73.13 -8.69 %
Dec 2014 68.80 -5.92 %
Jan 2015 67.39 -2.05 %
Feb 2015 62.69 -6.97

vale

Damodaran: I have not updated my valuation of Vale (as of Feb. 20th), but I have neither sold nor added to my position. It is unlikely that I will add to my position for a simple reason. I don’t like doubling down on bets, even if I feel strongly, because I feel like I am tempting fate. 

Prof. Damodaran is responding to a poster who is asking about Vale’s plummeting stock price.  If you are a long-term bull you want declining prices to bankrupt weak companies in the industry so as to rationalize supply.

HAVE A GREAT WEEKEND!

Dollar Panic; Valuation Ratios; Buyback Mania, CEFs

USbills_3228903b

If you think nobody cares about you, try missing a couple of payments.- Wright.

Long-term view of the Dollar (DXY)

Oil service, oil producers, mining companies etc. are being hammered by a dollar “shortage.”  Opportunity may be knocking. Remember what Klarman said about forced selling.

An overview of the situation: Dollar Shortage. With money supply rising in the US there is no dollar “shortage”, but there is a fear of inter-bank lending.

Dollar Leverage BIS Report

Dollar Crisis 2009

JPM-dollar-shortage funding

A Guide to the Swap Market

Now the “experts” say confidently cnbc Dollar Euro Parity. Perhaps a bit late in a trend!   If you are to follow a trend then The Whipsaw Song

A Reader’s Question on Valuation Ratios.  This sheet may be good as a guide to go through an annual report, but none of those ratios means anything without context.   Is growth good? It depends. Only profitable growth within a franchise.  How about asset turnover?   For some companies like Costco asset turnover is critical but not for Boeing (gross margin).   Why not take those ratios and work through the financials of these trucking companies.  Which company is doing the best? Why? Follow the money!   Those ratios may help you structure the information you pull out from the financials. But first focus on how does the company provide a service to its customers and then trace the financial effects back to your returns as an investor.

  1. HTLD VL
  2. JBHT VL
  3. KNX_VL

Buy-Back Mania (a yellow light of caution)

davidstockmanscontracorner.com-February Stock Buybacks Hit RecordTotal 2 Trillion Since 2009

Emultate Henry Singleton

Case Study in capital allocation: Dr. Singleton and Teledyne A Study of an Excellent Capital Allocator (must read!)

Gold is in a hyper bubble……………….

Gold Bubble

But now not so much…………………Gold Bubble Not Quite as much

Gold is stupid-cheap compared to all the money out there…………………Gold hyper undervalued

What determines the price of gold

2010-06-21 IE Special Report GOLD

A Case Study in investing in Closed-End Funds

Prof. Greenblatt once said that sometimes people just go crazy.

A Lesson in CEF Investing TRF

trf

Investors ran to pay a 90% PREMIUM to NAV AFTER a six-year boom and now after a seven-year decline they sell at a 10.5% DISCOUNT. Go figure.

http://www.cefconnect.com/Details/Summary.aspx?Ticker=TRF

Interesting video on China–a country brimming with centrally planned mal-investment. Is China Already in a Hard Landing?

Read more at reality-check-how-fast-is-china-growing.

We will get back to Deep Value next week and I will post links to valuation class videos.  Have a great weekend and if you do try to emulate someone, then:

Time-out: A Case Study in Pigeons

Pigeons-pigeons-27537154-741-1095

Case Study in Pigeon Investing

Times are hard.  Your family has been struggling to make the mortgage payments on your farm since the 50% decline in corn prices.

corn

Your lucky day! You get a call from a friend’s neighbor that he (The Pigeon King) desperately  needs breeders for his growing pigeon business. With a $125,000 investment financed with a second mortgage against your farm you can buy 360 pairs of pigeons at $165 a pair.  Then he offers to buy back the newly bred pigeons for $40 each (pigeons breed prolifically) with a ten-year contract.  He says these pigeons are for racing.  Then he gives you a list of five farmers in your state who are breeding pigeons for him.  Take your time and do your due-diligence, he says.

You check his credit ratings–all good.  No criminal or civil complaints. He owns his farm free and clear–he is a farmer like you!  After meeting with three of the pigeon farmers who confirm with check stubs that he has been paying them on time and as promised. The returns are good–in excess of 80% to 100% in terms of food and overhead to raise the chicks. Considering your time to look over your pigeons, you figure you can net a 50% pre-tax return on your capital. Plus, your contract allows you to sell whatever you produce at the stipulated price, so growth will be profitable.

Also, you hire an investigator to interview the Pigeon King. She sends you this video interview: Making Fowl into good fare—it this a good idea and A successful pigeon farmer

Times are hard. What do you do? Before you decide, you are inspired by

You gotta have dreams and the will to believe!

Pedgeon King

You remember what you learned as a deep value investor over at csinvesting.org and you_________? Why? What INVESTING/BUSINESS principles help you in your decision?

Please write them down now.  Then read on.

Many years later, you notice in the paper:

the-pigeon-king-and-the-ponzi-scheme-that-shook-canada.html

This article, The Pigeon King (same as the link above but with additional commentary for easier reading) is one of the most amazing stories–a farce, a tragedy, a comedy AND chock full of lessons for the investor.  You may think you are too smart to be a pigeon or a bird-brain (sorry!) but ANYONE can be blind.  What checklist items stop you (besides it’s too good to be true?).

What did YOU learn?

Money for nothing and your chicks for free


ROIC and Reversion to the Mean

Buffett-Indicator

Buffett-Indicator-with-Wilshire-5000

If women ran the world we wouldn’t have wars, just intense negotiations every 28 days. –Robin Williams

Return Measures by Damordaran 2007 (More on ROIC)

REGRESSION TO THE MEAN

This is a key concept to learn along with EV/EBITDA, MCX, and cheapness wins.

REGRESSION TO THE MEAN  A good read by an Australian Graham & Dodd-like Investor.

When an investor turns to the research on regression to the mean and investors overreacting to poor company performance/bad news in Richard Thaler research, he or she sees that prices of the winner and loser portfolios take three-to-seven years to revert.  See also The New Finance: The Case Against Efficient Markets by Robert A. Haugen and Inefficient Markets by Andrei Schleifer.

RTM vs EMT

Illustration by S of Reversion to the Mean

t is it a Goode value

We next progress to Chapter 5: A Clockwork Market, Mean Reversion and the Wheel of Fortune in Deep Value.

From there we will read chapters 3 and 4 in Quantitative Value.

DIA-2002

Beating An Index or What Works on Wall Street

chimp

Chimps Managing  (30-second video) and Sales are down

Why can’t 70% of professional money managers beat chimps?

High fees/costs, index hugging, inconsistency, overconfidence in their ability to be above average, lovers of stories, herding, and the institutional imperative? Don’t forget incentives that differ from achieving performance like asset gathering. See the case study at the end of this post.

what works

We left off with a reader asking why do money managers do better or follow a deep value approach? http://wp.me/p2OaYY-2IZ

One goal of our Deep Value journey is to find a method that suits us. This method should have a large base case rate of beating an index over a long period of time, say fifty years.   The lesson learned so far—I hope—is that CHEAPNESS wins whether that is price to book value, price to sales, price to cash flow.  My recent reading of the most recent 4th Edition of What Works on Wall Street shows that high  EBITDA-to-EV has beaten out Price-to-Sales (3rd Edition) What Works on Wall Street, Third Edition as the best metric as a value factor.  However, combined with quality of earnings metrics, it performs even better or about 18% to 19% per year since 1964 to 2009.  Our goal is to put the odds on our side and CONSISTENTLY play the odds through thick and thin.  Our other edge is to realize how flawed our thinking is and thus we build protection against ourselves by developing a disciplined approach.

What Works: Notes from Joel Greenblatt’s class 2002:

Read: What Works on Wall Street by James P O’Shaughnessy.  He started a fund in 1996-1997 but he underperformed the market by 25% and after three years in business of underperforming he sold his company at the bottom of the cycle.   The guy who wrote the book quit his system!   It seems like it is easy to do, but it is not easy to do.

This book, What Works on Wall Street, has born out its wisdom. The two funds that are patented that follow his strategy have been phenomenal. HFCGX is the patented fund based on his top idea of Cornerstone Growth; over the last 5 years it has had an average return of 13.44% per year vs. the Vanguard 500’s -2.01% per year (6/1/00 through 5/31/05). HFCVX is the patented fund based on his 2nd to best idea of Cornerstone Value; over the last 5 years it has had an average return of 6.47% per year vs. the Vanguard 500’s -2.01% per year (6/1/00 through 5/31/05).

The most interesting point is that the author points out those investors often are too emotionally involved to have the discipline to see the strategy through. Not only did the first reviewer bash the book because he did like the returns strategy JUST one year after the book came out, but Mr. O’Shaughnessy sold the funds to Hennessy Funds at the end of 1999 after it failed to surpass the returns of the bubble that soon after collapsed. Seven years after it was published an investor would be much wealthier had they followed the books top strategy instead of the investors who dog-piled onto the stocks of the market’s bubble.

We are going to try to understand why it works. Why it has to work over time.  That is the only way you can stick it out.  The math never changes: 2 + 2 = 4.   That is the level of your understanding I want you to have by the time we are done.  If I get that right, forget all this other stuff and noise, I will get my money.  No genius required.  Concepts will make you great and your ability to STICK IT OUT.

There is a lot of experience involved in valuation work, but it doesn’t take a genius or high IQ points to know the basic concepts.  The basic concepts are what will make you the money in the long run.   We are all capable of doing the valuation work.

Notes from the 4th Edition of What Works on Wall Street

Why Indexing Works

Indexing works because it sidesteps flawed decision-making and automates the simple strategy of buying the big stocks that make up the S&P 500. The mighty S&P 500 consistently beat 70 percent of traditionally managed funds over the long-term by doing nothing more than making a disciplined bet on large capitalization stocks.

Money Management Performance

Past records of most traditional mangers cannot be predictive of future returns because their behavior is inconsistent.  You can’t make forecasts based on inconsistent behavior.

Common Sense Prevails

We now have the ability to empirically compare different investment strategies and their ongoing performance over time. What you will see in coming chapters is that almost all of them are deeply consistent with what common sense would tell you was true. Strategies that buy stocks that are selling at deep discounts to cash flow, sales, earnings , EBITDA-to-enterprise value (Yeah, but don’t forget MCX), and so on do extraordinary better than those that are willing to buy stocks with the richest valuation.  WE will be sensitive to data mining.

Does Complexity Imply Value  Simple works best–I suggest you read!

Systematic, structured investing is a hybrid of active and passive management that automated the buy and sell decisions. If a stock meets a particular criteria, it’s bought. If not, not. No personal, emotional judgments enter into the process.  Essentially, you are indexing a portfolio to a specific investment strategy and, by doing so, uniting the best of active and passive investing.  The disciplined implementation of active strategies is the key to performance. Traditional managers usually follow a hit-and-miss approach to investing. Their lack of discipline accounts for their inability to beat simple approaches that never vary from the underlying strategy.

The ONE thing that unites the best money managers is consistency.

Successful investing requires, at a minimum, a structured decision-making process that can be easily defined and a stated investment philosophy that is consistently applied.

Goeth said, “In the realm of ideas everything depends on enthusiasm; in the real world, all rests on perseverance.” While we may intellectually understand what we should do, we usually are overwhelmed by our nature, allowing the intensely emotional present to overpower our better judgment.

Human Judgment is limited

Why models beat humans

Models beat the human forecasters because they reliably and consistently apply the same criteria time after time. It is the total reliability of application of the model that accounts for its superior performance.

We are ALL above average.

Base rates are boring

We prefer gut reactions and stories to boring base rates.

Stocks with low PE ratios outperformed the market in 99 percent of all rolling 10-year periods between 1964 and 2009.

The best way to predict the future is to bet with the base rate that is derived from a large sample.

Base rates are boring while experience is vivid and fun.  Never mind that stocks with high P/E ratios beat the market less than 1 percent of the time over all rolling 10-year periods between 1964 and 2009.

Montier in his book, Value Investing writes: “One of the recurring themes of my research is that we just can’t forecast There isn’t a shred of evidence to suggest that we can.

We prefer the complex and artificial to the simple and unadorned.

Nowhere does history indulge in repetition so often or so uniformly as in Wall Street. When you read contemporary accounts of booms or panics, the one thing that strikes you most forcibly is how little either stock speculation or stock speculators today differ from yesterday. The game does not change and neither does human nature.—Edwin Lefevre.

Brain Research

Because of the interrelated nature of the emotional and rational centers of our brain, we will never be able to fully overcome our tendency to make irrational choices.  Simply being aware of this problem does not make it go away. To break from our human tendencies to chase performance and perceive patterns where there are none, we must find an investment strategy that removes subjective, human decision-making from the process and relies instead on smart, empirically proven systematic strategies. We can become wise by realizing how unwise we truly are.

Rules of the Game

It is amazing to reflect how little systematic knowledge Wall Street has to draw upon as regards the historical behavior of securities with defined characteristics. –Ben Graham

Richard Brealey, a respected data analysis, estimated that to make reasonable assumptions about a strategy’s validity (95% confidence level or statistically relevant) you would need 25 years of data.

Short periods are valueless

Consider the “soaring sixties” when the go-go growth managers of that era switched stocks so fast that they were called gunslingers. The go-go investors of the era focused on the most rapidly growing companies without even considering how much they were paying for every dollar of growth. Between Jan 1, 1964, and Dec. 31, 1968, $10,000 invested in a portfolio that annually bought the 50 stocks in the Compustat data base with the best annual growth in sales soared to $33,000 in value , a compound return of 27.34 % a year. That more than doubled the S&P 500’s 10.16% annual return, which saw $10,000 grow to just $16,200. Unfortunately, the strategy went on to lose 15.7% per year for the following five years compared to a gain of two percent for the S&P 500.

Had this same hapless investor had access to long-term returns, he would have seen that buying stocks based just on their annual growth of sales was a horrible way to invest—the strategy returns just 3.88 percent per year between 1964 and 2009.  Of course, the investor received similar results if he repeated the experiment between 1995 and 1999 and then the next five years.

EBITDA to EV was the best on an absolute basis for all the individual value factors we examine from 1964 to 2009 such as price to cash flow, price to earnings, etc.

EV/EBITDA in the lowest decile (the most EBITDA per EV) generated a 16.58% CAGR vs. 11.22% for the All Stocks universe with a standard deviation of returns of 17.71 percent, more than 1 percent below that of All stocks, 18.99 percent.  The worst five-year period for the metric was 2000 during the Internet Mania.  These ups and downs for a strategy are all part of the bargain you must strike with yourself as a strategic investor.  Pages 103 to 124 in What Works (4th Ed.) The EV/EBITDA in the highest decile (the most “expensive) did the worst of all the value metrics studied!

EV works well as a guide to under-and-over valuation when contrasted to EBITDA, SALES, and Free cash flow.

Price to book value ratios are a long-term winner with LONG periods of underperformance.

Accounting Ratios can help identify higher quality earnings:

  • Total accruals to total assets
  • Percentage change in net operating assets (NOA)
  • Total accruals to average asses.
  • Depreciation expense to capital expense.

We are looking for stocks with high earnings quality.

Accounting variables mater. How companies account for accruals, how quickly they depreciate capital expenses and their additions to debt all have a serious impact on the health of their stock price.

Successful investing relies heavily on buying stocks that have good prospects, but for which investors currently have low expectations. Stocks with great earnings gains and high net profit margins are basically high expectations stocks.

History shows that using high profit margins as the SOLE determinant for buying a stock leads to disappointing results.  The only lesson here is that it is best to avoid stocks with the lowest net profit margins.

A Case Study in Why Money Managers Lose Even With a Winning Hand

  • Winning Stock Picker’s Losing Fund

Value Line Research Service Has Beaten Market Handily, But Its Own Fund Suffered By Jeff D. Opdyke and Jane J. Kim Staff Reporters of THE WALL STREET JOURNAL Updated Sept. 16, 2004 12:01 a.m. ET

Value Line Investment Survey is one of the top independent stock-research services, touted for its remarkable record of identifying winners. Warren Buffett and Peter Lynch, among other professional investors, laud its system.

But the company also runs a mutual fund, and in one of Wall Street’s odder paradoxes, it has performed terribly. Investors following the Value Line approach to buying and selling stocks would have racked up cumulative gains of nearly 76% over the five years ended in December, according to the investment-research firm. That period includes the worst bear market in a generation.

Why the Fund Lagged

  • Past managers bought stocks that in some cases were well below the company’s top-rated choices, hurting performance.
  • Style drift: The fund has swung among small-, mid- and large-cap shares.
  • High turnover of fund managers meant little consistent investment discipline.

By contrast, the mutual fund — one of the nation’s oldest, having started in 1950 — lost a cumulative 19% over the same five years. The discrepancy has a lot to do with the fact that the Value Line fund, despite its name, hasn’t rigorously followed the weekly investment advice printed by its parent Value Line Publishing Inc. It also highlights the penalty investors often face when their mutual fund churns its management team and plays around with its investing style. In fact, late last night the person running the fund, Jack Dempsey, said that as of yesterday he had been reassigned and no longer had responsibility for managing the assets. Value Line couldn’t be reached to comment.

Most of all, the discrepancy between the performance of the fund and the stocks it touts shows that investors don’t always get what they think they’re buying in a mutual fund. For even though Value Line’s success is built around stocks ranked No. 1 by the company’s research arm, the fund’s managers have in recent years dipped into stocks rated as low as No. 3.

Ironically, even while Value Line’s own fund struggles to match the Value Line Investment Survey’s success, an independent fund company that licenses the Value Line name is doing much better with Value Line’s investment approach.

The First Trust Value Line 100 closed-end fund, run by Lisle, Ill.,-based First Trust Portfolios, adheres far more rigorously to Value Line’s investment principles, owning only the top-rated stocks.

Each Friday, First Trust managers log on to the Value Line site to download the week’s list of Value Line’s 100 most-timely stocks. During the next week, they sell the stocks that have fallen off the list and buy those that have been added. The result: Since its inception in June 2003, the First Trust Value Line fund’s net-asset value is up 12.4%, slightly better than the 11.6% gain the Standard & Poor’s 500-stock index posted in the same period.

Value Line’s own fund, meanwhile, gained 3.1% in that same time. Because the fund has been such a laggard in recent years, investors have been walking away. Assets in the fund — in the $500 million range as recently as 1999 — are now less than $200 million, though some of that stems from market losses.

Part of the underperformance stems from previous fund managers who didn’t rely entirely on Value Line’s proven model, opting instead to venture into lower-rated stocks, betting that active fund managers could unearth overlooked gems that one day would shine as top-rated stocks. Thus, investors who thought they were buying into Value Line’s winning investment strategy instead were buying into fund managers who thought they could outperform by second-guessing the company’s research — a tactic that didn’t work well.

Because the fund wasn’t performing well, the company changed managers frequently, searching for one who could post winning returns.

Value Line appeared to be moving back toward its roots in March, when it put Mr. Dempsey in charge of the fund. He isn’t the traditional mutual-fund manager; he’s a computer programmer who for a decade helped refine Value Line’s investment models. Value Line, which uses a team-managed approach, has had at least five lead fund managers since 1998, including Mr. Dempsey, according to Morningstar.

In an interview prior to his reassignment, Mr. Dempsey said he had been restructuring the fund to follow the ranking system “in a much more stringent fashion.” Today, about 95% of the stocks in the fund are rated No. 1. Mr. Dempsey said his goal was to liquidate within a week stocks that fell below Value Line’s No. 1 ranking.

The Value Line survey produces independent research on Wall Street stocks. The weekly view of 1,700 stocks, which costs $538 a year online (www.valueline.com) and nearly $600 in print form, is particularly popular with do-it-yourself investors and the abundance of investment clubs in the U.S. Value Line rates stocks in a variety of ways, but is especially known for its so-called timeliness rank. Stocks ranked No. 1 are timely and expected to outperform the market; those ranked No. 5 are expected to lag.

Instead of running an actively managed fund in which a manager cherry-picks the stocks the fund owns, Value Line could operate what amounts to an index fund that simply owns the highest-ranked stocks in the survey. However, active managers believe they can improve the performance of a fund.

“As a fund manager, you want to add value,” Mr. Dempsey said. Still, he acknowledged that “it’s hard to beat our quantitative system.” In the short time that Mr. Dempsey was in charge — a nearly six-month period in which he transformed the portfolio — he accumulated losses of about 2%, compared with losses of 0.2% at the S&P 500. However, he topped the First Trust fund, which is down about 2.5% in the same period. Under Mr. Dempsey, the fund accumulated significant positions in stocks such as Research In Motion Ltd. and added new positions in Yahoo Inc. and Arrow Electronics Inc., among other companies, according to Morningstar.

Value Line, based in New York, doesn’t detail the inner workings of its proprietary stock-picking model. By and large, though, the strategy is built around stocks displaying price and earnings momentum and posting earnings surprises, says John James, chairman of the Oak Group, a Chicago company that runs hedge funds, some of which try to anticipate changes in Value Line’s stock rankings and then invest based on which stocks will rise to No. 1 from No. 2.

However Value Line’s model works, there’s no question the company’s research produces winning choices. Value Line’s list of stocks ranked No. 1 produced cumulative gains of nearly 1,300% from Dec. 31, 1988 through June, 30, 2004, according to Value Line. The S&P 500, by comparison, posted cumulative gains of 311%.

Newbie investor meets a DEEP VALUE INVESTOR


A Deep Value Investor in Cyclical Companies

staffimg_IbenDavid Iben is a deep value investor currently focused on highly cyclical industries like coal, uranium, and gold mining.  He has a mandate to go anywhere to invest in big or small companies. He seeks out value.   The world is now bifurcated between a highly valued U.S. stock market and the cheaper emerging markets.  Social media and Biotech stocks trade at rich valuations while depressed cyclical resource companies languish.

VALUATION

Value to us is a pre-requisite and thus we never pay more than a company’s estimated risk-adjusted intrinsic value. But, failing to think deeply and independently about what constitutes value and how best to derive it, can be harmful. Following in the footsteps of growth investors who had allowed themselves to become too formulaic or put in a box in the late 90s, some value investors were hurt by overly restrictive definitions of value in 2007 and 2008 (Price/Book and Price/Earnings, etc). We find it valuable to use many valuation metrics. Additionally, emphasis is placed on those metrics that are most appropriate to a certain industry. For example, asset heavy and/or cyclical companies often are tough to appraise using Price/Earnings or Price-to-Cash Flow. Price to book value, liquidation value, replacement value, land value, etc. usually prove helpful. These metrics often are not helpful for asset light companies, where Discounted Cash Flow scenario analysis is more useful. Applying these metrics across industries, countries, and regions helps illuminate mispricing. Looking at different industries through different lenses, through focused lenses, using industry appropriate metrics and qualitative factors is important. Barriers to entry are an important factor. Potential winners possess different key attributes. Supply and demand are extremely important detriments of margin sustainability. The investor herd has a strong tendency to use trend line analysis, assuming that past growth will lead to future growth. A more reasoned, independent assessment will often foretell margin collapses as industries overdo it, thereby sowing the seeds of their own self-destruction.

Currently, opportunities are being created when the establishment pays too little heed to supply growth. This fallacy extends to money. Many seem to believe that the Federal Reserve has succeeded in quintupling the supply of dollars without a loss of intrinsic value. That is impossible. Evidence of the loss of value is abundantly clear. Gold supply held by the U. S. Treasury has not increased. As economic theory would predict, the price of gold went up. Following 12 straight years of advance and apparently overshooting, the price has since corrected 40%. The trend followers have their rulers out again, confusing a correction in a supply/demand induced uptrend with a new counter-trend.

We view this as opportunity. At the same time, bonds are priced as if they were scarce rather than too abundant to be managed. It is no secret that this is due to open, market manipulation by the central banks. Intrinsic value must eventually be reflected in market prices. These are abnormally challenging times. Fortunately, we believe markets aren’t fully efficient.

If you listen to his conference calls and read his insights, you will have a great education in counter-cyclical investing. It is easy to know what to do but hard to do!

The Twilight Zone – Jan 2015

Value Investor Insight_3.31.14 Kopernik (Interview)

July 2014 The Contrarian Iben of Kopernik (Interview)

Kopernik Annual Report 10 31 14 – Web Ready

Kopernik Semi-Annual Report _4.30.2014_FINAL

When Doves Cry_Final

The Wizard of Oz Dec 2013

THE SADDLE RIDGE HOARD

2014 – 4th Q Call with DI – Transcript FINAL

A tutorial of Deep Value Investing in Highly Cyclical Assets/Companies

The trials, tribulations, and need for consistent approach.

http://kopernikglobal.com/content/news-and-views-iben-insights

http://kopernikglobal.com/content/news-and-views-news

I will be asking for your suggestions for the deep value course. I am collating one reader’s suggestions which I will post next.  Some of you may be quite experienced and advanced investors who tire of the theoretical course materials as well as the mechanical aspect of quantitative investing. We will discuss this next………….Thanks for your patience.


Enron Case Study Analysis. Ask Why? Why?

Enron3

Case-Study-So-What-is-It-Worth    Prior Post where students discussed the case.

Turn up the VOLUME: Don’t believe the …..?

Enron-Case-Study-So-What-is-It-Worth  My walk-through. I go straight to the balance sheet then calculate the returns on total capital in the business. These financial statements were easy to discard because of the size of the business and the poor returns. My estimate of $5 to $7 per share worth or 90% less than the current share price, was wrong. The company was worth $0.  This is more a case of institutional imperative and incentive-based bias. Wall Street was feeding at the financial trough to keep raising money for Enron (to keep the bad businesses afloat) so guess what the financial analysts (CFAs and MBAs) suggested? Buy!   I guess the market is not ALWAYS efficient.

Forget accounting scandals, this was a crappy business based on trading so no way to determine normalized earnings.   When I was in Brazil and saw Enron’s newly-built generating plant sitting idle, I asked why.   A project developer said he got paid by doing deals by their size not profitability, therefore, the bigger the white elephant, the better.  When I called mutual funds who owned Enron as it was trading $77 per share to ask the analyst if he/she was aware of Enron’s declining businesses coupled with absurd price, I was told to shut up. As one analyst (Morgan Stanley?) told me, “I only believe what I want to believe and disregard the rest.”

Enron Annual Report 2000  Ha, ha! and Is Enron Overpriced?

The above august panel never answered why anyone would give capital to Enron?  No one mentions the elephant in the room.  Sad.

What does the above case have to do with net/nets and our course. Everything! Look at the numbers, think for thyself, ignore Wall Street, and be aware of incentives.   Buying bad businesses at premium prices is a guarantee of financial death.

This is an aside, but based on the above Enron example, does value investing serve a SOCIAL purpose or benefit? Prof. Greenblatt doesn’t think so–you are just trading pieces of paper, but what do YOU think?

See these two venture capitalists explain the social purpose of their business:

See’s Candies, Sanborn Map, and Inflation Article

SeesA Nor’easter is coming my way (up to two to three feet of snow with high winds) so I may be out of contact for two or three days.  But push on we must. We continue to study Chapter 3, in Deep Value and Buffett’s investing career.Sees 2

The best investment article I have ever read of Buffett’s is:

Buffett & Inflation Highlighted plus if you wish to read all that Buffett has said about inflation then Buffett inflation file.

A key case for you to focus on is See’s_Candies_Case_Study. Combined with Buffett’s Inflation Swindles the Equity Investor (Fortune Article: Buffett – How Inflation Swindles the Equity Investor), you will see a leap in Buffett’s thinking. Both are important to understand and complementary to each other.

Finally, Sanborn_Map_Case_Study_BPLs is another case mentioned in Chapter 3 of Deep Value.

Hopefully, students will discuss in the comments section.

Time to bring out the snowshoes!

It’s not entirely clear what will happen in the near term, but the financial markets are already pushed to extremes by central-bank induced speculation. With speculators massively short the now steeply-depressed euro and yen, with equity margin debt still near record levels in a market valued at more than double its pre-bubble norms on historically reliable measures, and with several major European banks running at gross leverage ratios comparable to those of Bear Stearns and Lehman before the 2008 crisis, we’re seeing an abundance of what we call “leveraged mismatches” – a preponderance one-way bets, using borrowed money, that permeates the entire financial system. With market internals and credit spreads behaving badly, while Treasury yields, oil and industrial commodity prices slide in a manner consistent with abrupt weakening in global economic activity, we can hardly bear to watch..   John Hussman, Jan. 26, 2015   www.hussmanfunds.com

DEEP VALUE Videos on Net/Nets and Investing

Closing Arg

How is it possible that an issue with the splendid records of Tonopah Mining should sell at less than the company’s cash assets alone? Three explanations of this strange situation may be given. The company’s rich mines at Tonopah are known to be virtually exhausted. At the same time the strenuous efforts of the Exploration Department to develop new properties have met with but indifferent success. Finally, the drop in the price of silver last year has provided another bearish argument. It is this combination of unfavorable factors which has carried the price down from $7  1/8 in 1917 to its present low of $1  3/8 in 1923.

Granting that the operating outlook is uncertain, one must still marvel at the triumph of pessimism which refused to value the issue at even the amount of its cash and marketable investments; particularly since there is every reason to believe that the company’s holdings in the Tonopah and Goldfield railroad, are themselves intrinsically worth the present selling price. (Ben Graham on Investing)

VIDEOS

Marty Whitman criticizes Graham and Net Nets (3 minutes Must see!)

Marty Whitman: They Just Don’t Get it.  (23 minutes) Marty says many analysts on Wall Street do not understand credit analysis.   We will explore later in this course whether the quality of credit provides a better assessment of the true cost of capital for a firm rather than “beta.”

One investor’s experience investing in Net/Nets (3 minutes)

Net/nets as value traps (5 minutes)

Good advice on behavioral investing (3.5 minutes)

Prof. Greenwald on UGLY and Cheap or Graham’s Search Strategy (8 minutes)

Greenwald on the Balance Sheet (risk of financials) (10 minutes)

Reading Assignments; The Institutional Imperative

ThOdysseusAndSirensWaterhou

All Enrollees in the DEEP VALUE COURSE should have been emailed Security Analysis and The Intelligent Investor.

Please read Chapters 42 – 45 (on the Balance Sheet). Especially focus on Chapter 43, Significance of Current Asset Value in Security Analysis, (pages: 548-613)

Read Chapter 15 in the Intelligent Investor (pages 376-402)

Chapter 22, Graham’s Net-Nets: Outdated or Outstanding in Montier’s Value Investing,  (Pages 229-235)

Chapter 2, Contrarians at the Gate in Deep Value, (pages 19 -34)

Chapters 1 & 2 in Quantitative Value (pages 3 – 59)

A total of about 168 pages.   This is to give you an early start for next week.  If you are short on time, then just read Ch. 2 in DEEP VALUE. 

If you didn’t receive any of those books, then 1) check your spam folder, 2. email me at aldridge56@aol.com with the title BOOKS and what you are missing.  3. if you receive an email with material that you have already received, then ignore/delete.

The Institutional Imperative
Sometimes institutions get caught up in the moment as well.  A company I used to work for held the Fairholme fund in two separate strategies in 2010.  At the end of 2010 I was able to convince the group to completely sell out of the fund in the smaller strategy, but it remained in the larger strategy.  In 2011, the Fairholme fund lost about 32% when the S&P 500 was up 2%.

fairx

At the end of 2011 I (the author of this article, link below) was able to convince the group to add the Fairholme fund back to the smaller strategy, but was unable to convince them to even maintain its weighting in the larger one.  Instead the group decided to cut the allocation in the larger strategy in half, despite my objections.  The argument was that the volatility and amount of underperformance (What about Regression to the Mean?) was too great.  The amount of underperformance was one of the reasons to add it back to the smaller strategy and in my experience returns trump volatility as volatility can actually be your friend.  In 2012, Fairholme was up about 35% which almost beat the S&P 500 by 20%.  In the end it was the clients that were hurt as the investment group followed the herd, on the larger strategy at least, keeping a manager after great performance and selling them after poor performance.  Read more….

The institutional-imperative

Institutional Investors and Analysts tend to herd-like behavior by acting late after trends are established.

Goldman cuts oil outlook, so NOW you tell us! (Perhaps, a tad late on the ADVICE!)

Working at Goldman Sachs