Today’s Distorted Production/Consumption Structure

shallow

As a general rule….people ask for advice only in order not to follow it; or, if they do follow it, in order to have someone to blame for giving it. –Alexandre Dumas

This l o n g post is critical in understanding our current investing environment.   I copied the entire post from www.acting-man.com because of its importance. Value investors seek bargains. We look at the particular shoe, car, asset, or business and seek to buy below what we estimate it to be worth. Outguessing the market or the economy is a hopeless task, nevertheless, one must be aware of distortions in order to normalize earnings–how would you have normalized earnings for housing stocks in 2005 and 2006, at the peak of a massive distortion?  Currently, we are making economic history with the current distortion of the country’s production structure.

Boom and Bust

Be aware of what that means for your investments! Read on.

Summary: Since this is a long post, let’s cut to the quick.  If interest rates are pushed below their natural free market rate (our time preference or how much do we consume today vs. save for tomorrow), then businessmen are fooled by how much real savings are in the economy to utilize or bid for. Say with a 5% loan we see in our spread sheets that building a factory would generate a nice profit, so we begin building our three-story building, but since there are not enough real savings in terms of bricks, steel, cement, as we build, the prices of those materials begin to rise. Now our building is no longer profitable because our input costs have risen or worse–there are no more bricks available to complete our factory. We abandon the project halfway through.  Look at the empty and uncompleted housing complexes outside of Las Vegas from the busting of the housing bubble in 2005/06 as a recent example.

Background: Structure_Production_Reconsidered (a full review after you have finished this post). For the fanatical student: Economic Depression Their Cause and Cure

The Goldilocks Illusion  May 11, 2015 | Author  Pater Tenebrarum

Why Market Participants Liked the Payrolls Report

Some people have wondered why the stock market reacted with such a big rally to last Friday’s payrolls data. After all, the report wasn’t much to write home about, especially if one  ponders the details. In addition, the already weak March payrolls data were revised lower to an even worse figure.

However, the report certainly did one thing: it kept the “Goldilocks illusion” alive. While jobs data are a lagging economic indicator and would likely be completely ignored in an unhampered free market (if anyone even took the trouble to collect them, that is), they are regarded as decisive for Fed policy. Few things illustrate more vividly that the central planners are driving forward with their eyes firmly fixed on the rear-view mirror.

The Fed has little choice though, since its mandate explicitly includes employment as one the things central bank policy is supposed to support (which it does mainly by fostering artificial booms and malinvestment of capital). The market’s focus on the jobs data has increased greatly in recent years as a result of this, which incidentally illustrates how utterly dependent the markets have become on a continuation of easy money policies by central banks.

The “Goldilocks” idea is that it is best for risk assets if economic data are strong enough not to signal recessionary conditions, but weak enough to keep ZIRP and monetary pumping going. Friday’s data point was presumably considered almost perfect in terms of this playbook.

SP 500

SPX, 10 minute chart: stocks bounce back to the upper end of their recent range

Normally the stock market is held to reflect the past successes or failures of listed companies, as well as expectations about their future performance. To some extent this is still the case, but as the market has come to increasingly depend on monetary pumping and the associated perceptions, this factor has diminished in importance.

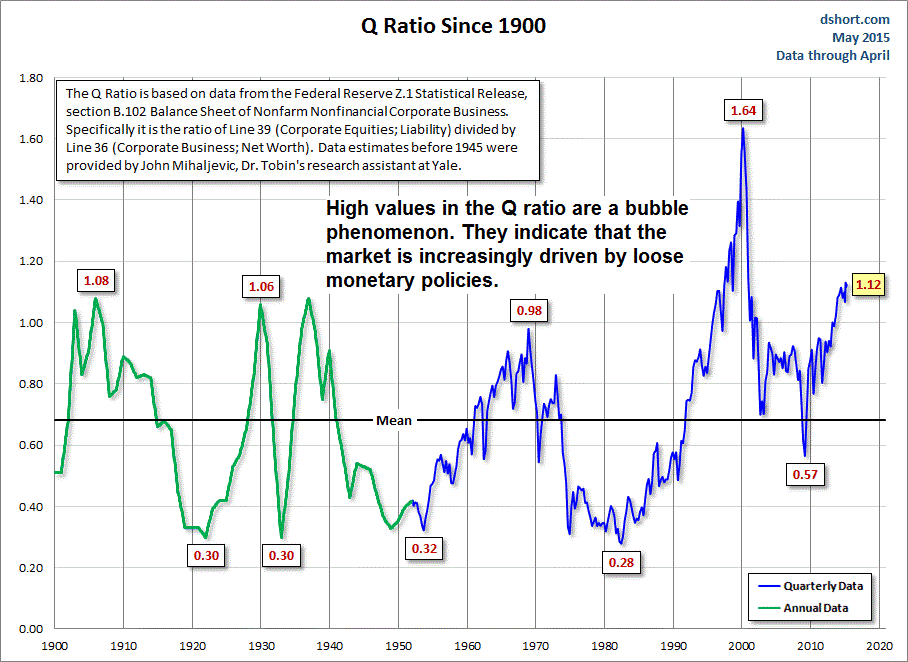
We can indirectly discern this from certain data points, such as the fact that  the median stock has never been more expensive than today. This is a sign that intra-market correlations have greatly increased. However, it is actually impossible for such a large percentage of listed companies to be equally successful in terms of real wealth creation. Along similar lines, the strong rise in the Q-ratio (it is currently two standard deviations above the mean) is a strong sign that market valuations are driven by the “money illusion” rather than a rational assessment of value.

Q Ratio

A long-term chart of the Q ratio shows that loose monetary policy frequently distorts market valuations. If it tops out near its current level, it will be the second highest peak in history – click to enlarge.

What Will Shatter the Illusion?

Not everybody thinks that the “not too hot, not too cold” jobs data will keep the Fed from going through with its long-announced “policy normalization” plans. However, the conviction is growing that this will once again be pushed back to a later date. Here is an excerpt from  a Bloomberg report on the payrolls report that illustrates the current consensus on the topic:

“U.S. job growth rebounded last month and  the unemployment rate dropped to a near seven-year low of 5.4 percent, suggesting underlying strength in the economy at the start of the second quarter that could keep alive prospects for a Federal Reserve rate hike later this year.

Nonfarm payrolls increased 223,000 as gains in services sector and construction jobs offset weakness in mining, the Labor Department said on Friday. The one-tenth of a percentage point decline in the unemployment rate to its lowest level since May 2008 came even as more people piled into the labor market.

However, wage growth was tepid and March payrolls were revised downward, leading financial markets to push back rate hike bets. “We see this report as reducing concerns that weak first-quarter growth represents a loss of economic momentum,” said Michael Gapen, chief U.S. economist at Barclays in New York. Nevertheless, he said the bounce back was not strong enough to think the Fed could bump rates higher before September.

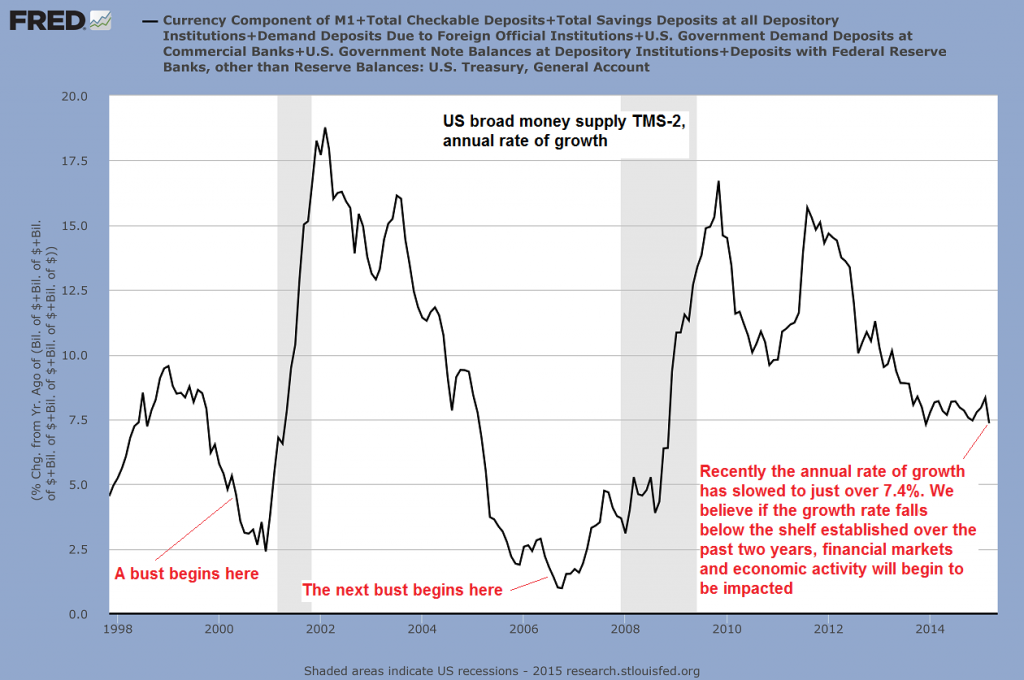
Considering that even most mainstream observers these days are usually admitting to the increasing importance of central bank policy to stock prices, it is slightly baffling that they almost never mention the money supply. The growth momentum of the money supply strikes us as the most important factor determining boom and bust conditions in the economy and the stock market.

As can be seen below, the annual growth rate of the broad US money supply measure TMS-2 (= true money supply) has slowed to approx. 7.4% in March. Historically this growth rate is still quite brisk. It also remains within the “sideways channel” within which annualized money supply growth has oscillated for more than two years. It also remains still well above the previous “bust thresholds” we have indicated on the chart. Therefore it isn’t sending a strong alarm signal just yet.

However, such thresholds are not a fixed magnitude. At what level precisely the boom-bust threshold will turn out to be depends to a large extent on contingent data and market psychology. Our hunch is that this threshold is higher than it used to be, mainly because the economy’s underlying performance continues to be quite weak compared to previous post WW2 era recoveries.

Money supply TMS-2, annual rate of growth

TM2

How much monetary pumping is required to keep assorted bubble activities on life support is unknowable. However, we can be sure that the economy is becoming ever more imbalanced and structurally weaker the longer strong monetary pumping continues. This is another reason to suspect that the “bust threshold” is likely higher than it used to be. Moreover, the lagged effect on economic activity from the peak money supply growth rates recorded in late 2009 and late 2011 has to be diminishing by now. As newly created money continues to ripple outward from its points of entry into the economy, the likelihood that “bad effects” become visible increases.

Currently there are two firmly established consensus opinions that are based on the irrational faith that  this time, central bankers somehow know what they are doing. One is the idea that strong economic growth is “just around the corner”, where it has been suspected to be lying in wait for the past six years. A corollary to this is the belief that the economy cannot possibly weaken to the point of entering an official recession.

A second, related conviction is that no “inflation problem” can possibly appear on the scene. Inflation problem in this case means: a noticeable increase in CPI. There are many good reasons for this consensus opinion. A number of contingent trends are helping to keep consumer prices in check. They comprise large consumer debt overhangs in nearly all developed countries, negative demographic trends, subdued wage growth (due to global labor arbitrage and tepid economic activity) and ongoing productivity growth in manufacturing (which seem to be waning lately). Moreover, in the post 2008 era, newly created money hasn’t primarily been borrowed into existence due to growing credit demand in the real economy. Instead it has entered financial markets more or less directly, as central bank debt monetization leaves major market participants with first dibs on new money.

All these trends affect demand for consumer goods, and even though we cannot truly measure their impact, some empirical confirmation is provided by related data points such as weak growth rate in retail sales. However, the demand side is only one part of the equation. Years of monetary pumping have left their mark on the economy’s production structure (KEY POINT!), and we want to briefly look at the problem from this angle.

The Balance between Production and Consumption

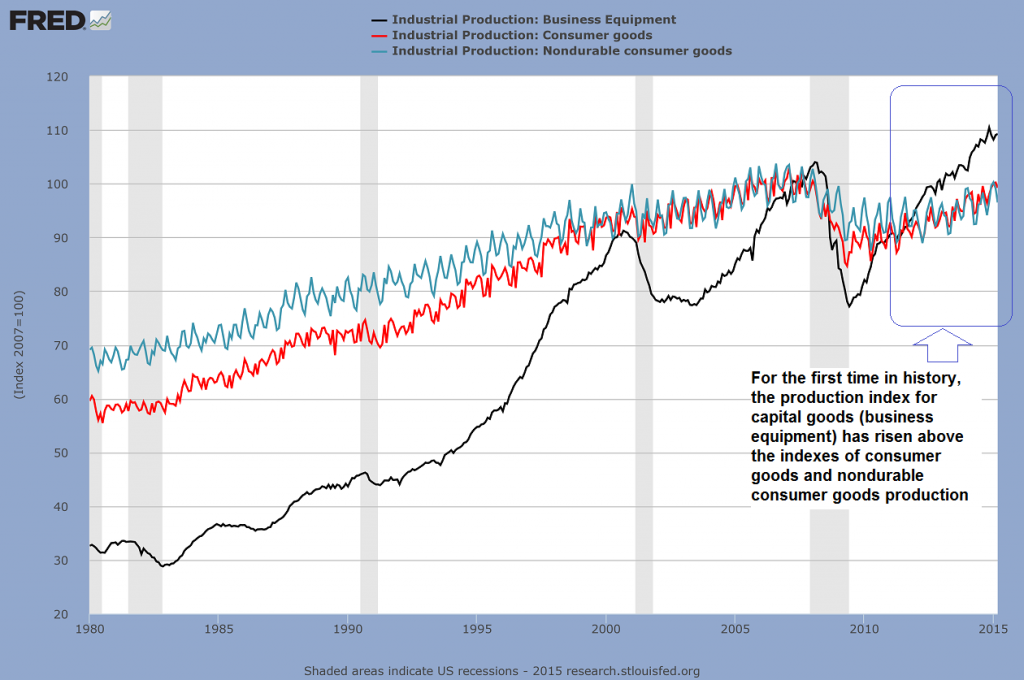
The chart below shows the industrial production index for capital goods (business equipment) compared to the production indexes of consumer goods and non-durable consumer goods. Given extensive global trade, domestic US consumer goods production has been partly replaced by imports, but the history of these indexes still conveys useful information.

capital goods vs consumer goods

Industrial production: capital goods vs. consumer goods and consumer non-durables

When interest rates decline, long-term projects that yield a consumable output only after a long period of time appear to become increasingly profitable. The decisive factors are firstly that the profitability hurdle declines as interest rates fall (for instance, it makes no sense to borrow capital at 4% for an investment yielding only 3%, but the situation obviously changes if borrowing costs decline to 2%), and secondly, that the net present value of long-lived capital goods increases sharply when they are discounted at a lower interest rate. The longer the time period involved, the bigger the effect will be.

As a result, factors of production will increasingly be bid away from the lower stages of the production structure (those closer to the consumer) to the higher stages (capital goods production) and the economy will become more capital intensive. In an unhampered free market economy, this is generally a positive development indicating a progressing economy. A decline in interest rates will signal that people are increasing their savings. Additional savings are a  sine qua non for a  sensible lengthening of the capital structure, as new long term investments need to be funded. If people are postponing consumption in favor of saving, this funding will in fact be available.

By increasing their savings, people are signaling that they prefer to be able to consume more or better goods in the future in exchange for lowering their present consumption. The creation of a more capital-intensive production structure will make this possible, as it will lead to greater output of consumer goods in the future (the quantity, and/or the quality of output my increase, and future output may also include goods that could otherwise not be produced at all). Interest rates and prices are the  signals indicating to entrepreneurs which types of investments make the most sense and to what extent the time structure of production can be lengthened.

Things become problematic though if interest rates are artificially suppressed by administrative fiat instead of declining due to an increase in savings. Economic calculation is falsified: relative prices are distorted, and the resources required to fund a lengthening of the production structure are in reality not available to the extent indicated by the interest rate signal. The investment activities of entrepreneurs will be misdirected – too much will be invested in the wrong lines, based on an incorrect assessment of consumer wants and the amount of real funding available for long term investment projects. Initially an economic boom is set into motion. Large accounting profits accrue and will be partly paid out in the form of dividends, stock buybacks and higher wages. However, at a later stage it will become obvious that many of these profits were actually illusory and that in reality, capital was consumed.

The people engaged in the production of capital goods need to be able to consume long before their own labor yields goods ready for consumption. They must eat, they need a place to stay, etc. The more factors of production are shifted toward capital goods production and away from consumer goods production, the more likely it becomes that not enough “free capital” in the form of consumer goods is available to support these long-term activities. Obviously, this problem can only be made worse by printing more money. KEY POINT!

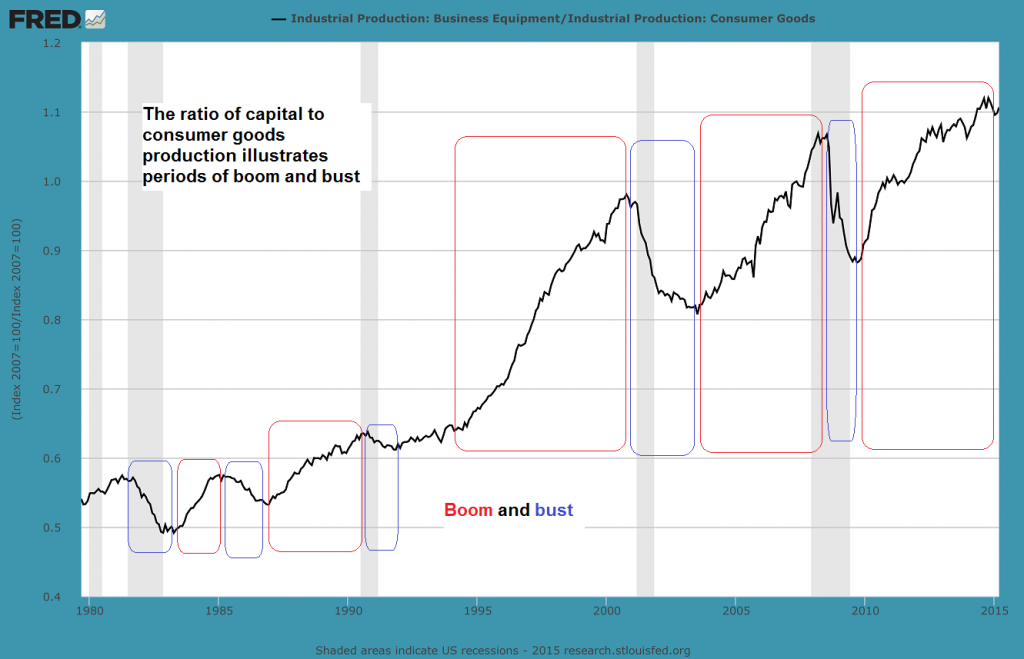
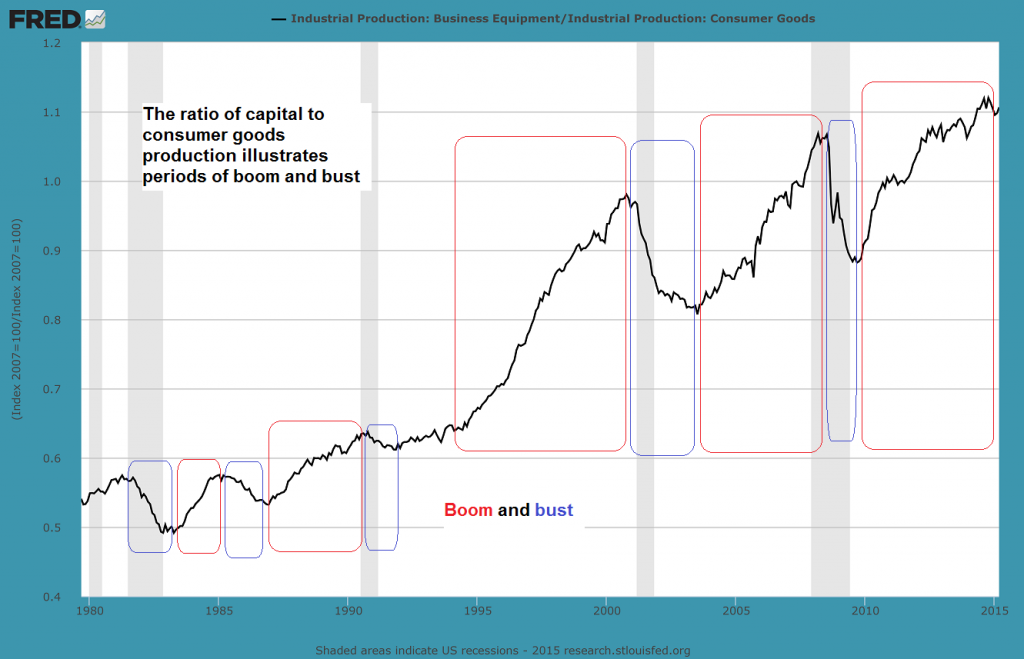
The boom eventually expires because it turns out that many new investments can actually not be funded. Once this is recognized, a scramble to obtain the required capital commences, putting upward pressure on market interest rates. The distortions in relative prices that originally fired up the boom begin to reverse and malinvestments are unmasked as unprofitable – the bust begins. By looking at the ratio between capital and consumer goods production indexes, one can clearly discern boom and bust periods:

Boom and Bust

Not every bust necessarily results in an “official recession”. Sometimes the bust can be concentrated in just a few industries (like e.g. oil production and S&Ls in 1986-1988) – click to enlarge.

Let us reconsider the “CPI inflation” question in light of the above. If too many resources are devoted to capital goods production, the economy will over time tie up too many consumer goods relative to the amount it releases. The economy’s pool of real funding consists of two components: savings and consumer goods that become continually available from ongoing production activities. Although it is well known that many companies these days prefer to engage in financial engineering (mainly in the form of stock buybacks and m&a activities) rather than investing in capital, what counts are  relative proportions. If bottlenecks in the supply of consumer goods develop at some point, consumer prices may unexpectedly rise even if the currently tepid level of consumer demand remains unchanged.

The Growing Amplitude of Business Cycles

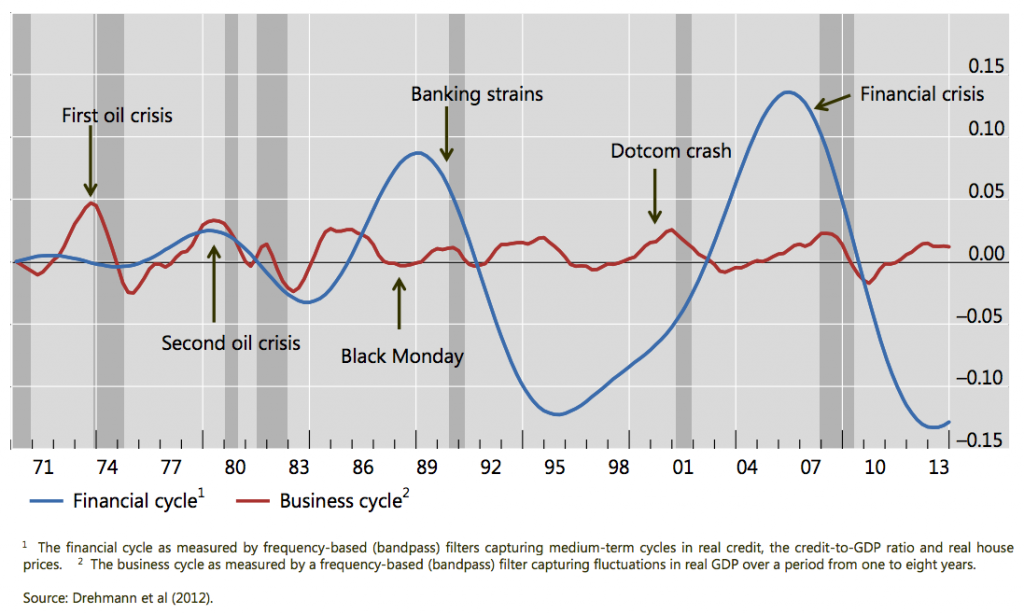
David Stockman recently  posted a chart from a BIS report that shows the amplitude of financial market cycles and business cycles in the real economy:

amplitude

Financial market cycles vs. real economic cycles

This chart illustrates the fact that the increasing activism of central banks in recent years has led to a commensurate increase in the amplitude of business cycles, with boom and busts in asset prices becoming especially pronounced. Since stocks are titles to capital and real estate can be grouped with long-lived capital goods from an analytical perspective, this is in keeping with the distortions in the production structure discussed above.

We have mentioned that the current cycle differs slightly from previous cycles due to the fact that “QE” injects newly created money directly into financial markets. The firms selling securities to the Fed (i.e., the primary dealers) will use the funds they receive to purchase securities again. The sellers of securities in this second round of purchases will largely tend to do the same, and so forth. However, this doesn’t mean that new money will forever stay within the confines of the financial markets in a kind of closed loop. More and more of it will “leak out” over time.

For example, the purchase of expensive trophy properties by the rich generates commissions for real estate agents and profits for real estate developers. Rising stock prices may lead individual investors to sell a part of their investments to increase their consumption. Companies are issuing lots of bonds to take advantage of low rates and seemingly insatiable investor demand. Some of the proceeds are flowing back into the financial markets in the form of stock buybacks, but a large part is used to purchase capital goods, pay wages, invest in R&D, etc. In short, the enlarged money supply eventually ripples through the economy in a variety of ways.

Someone will always have to hold the additional cash balances, and while strong demand for money since the 2008 crisis has so far contributed to keeping consumer price inflation in check, this state of affairs cannot be taken for granted (the demand for money may actually have been egged on a bit by ZIRP as well, as savers of modest means likely feel they have to set aside more money in light of the lack of interest income). We can already see though that those with the largest amounts of cash at their disposal are treating it as a hot potato (hence the frantic bidding for expensive properties,  high end art works, etc.).

Conclusion

We can be certain that the vast expansion of the money supply in recent years has once again led to the erection of an unsustainable capital structure. Should money supply growth rates continue to falter, a bust is likely to arrive sooner rather than later, as investment projects that depend on monetary pumping to keep up the appearance of profitability will quickly turn out to have been misguided.

Moreover, the large amount of new money that has been created in recent years continues to move through the economy and the possibility that people will reassess their demand for cash balances cannot be dismissed, in spite of the contingent trends that are currently keeping a lid on consumer demand. This may become especially pertinent if the Fed reacts to the next bust by immediately kicking money supply inflation into high gear again. After all, the strong demand for money is  inter alia predicated on the belief that the inflationary policy of recent years isn’t going to continue indefinitely.

Addendum

This article is actually a continuation of the “Echo Boom” articles we have published previously (see here for  part 1 and  part 2). In the next installment we will look at the relationship between “price inflation” and the stock market. This relationship is not as straightforward as is generally believed.

All in all we can conclude Goldilocks is treading on increasingly thin ice.

Charts by: BIS, St. Louis Federal Reserve Research, StockCharts, Doug Short / Advisorperspectives

Lesson on Franchises in Cyclical Markets

Gold-Miners-vs-200-MA


Mining-Stocks-Sentiment

Money Managers Are Price Chasers

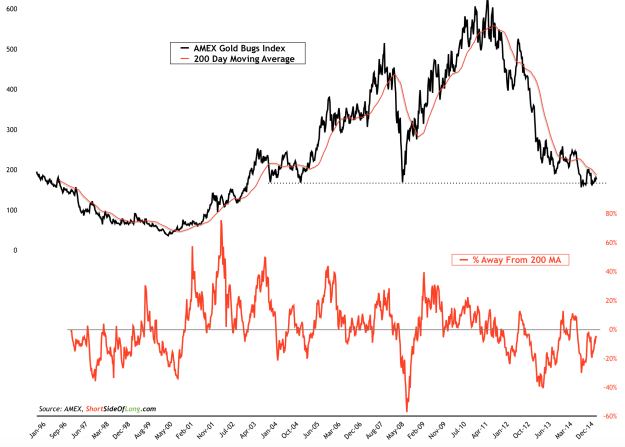
Markets can do ANYTHING in the short-term, so the following is not a prediction that miners will rise in price. However, what comes first–the price rising or the buying? 🙂 Miners chop around in a trading range as money managers flee the sector and now sit with record low allocations to this sector. * How good are money managers (on the whole) picking the right sector to invest in?  I leave it to you to find that out.

Wedgewood Partners: Franchises in Cyclical Market and a Lesson on Diversification

wedgewood partners fourth quarter 2014 client letter Look at pages 12-20 where David Rolfe, the manager, discusses NOV, SLB and CLB–high-quality companies in the cyclical oil sector.

  1. clb_vl
  2. slb_vl
  3. nov_vl

He points out diversification may mean the sources of profitability can be different among companies within a particular sector.  (Refer to Competition Demystified by Bruce Greenwald for a course on this distinction). Note the high revenue conversion to free cash flow (page-14) for those companies compared to other companies in the oil services sector.

Now move on to wedgewood partners first quarter 2015 client letter crude realities.  Note on page 13 how he looks at the oil services market–the structural attribute to focus on is drilling intensity.  Interesting…. Look at pages 18 and 19 for a further discussion on NOV and CLB.

To learn, you might download those company’s recent annual reports and try to figure out their revenue to free cash flow conversion.  Look at what the companies use for maintenance capex.  Note how Core Labs is a free cash flow gusher (Charlie Munger would smile on this).  Core Labs is a different business than SLB and NOV, but is grouped in the same industry/index.  When sellers of ETF sell, they don’t distinguish among companies and therein lies opportunity for us. Yeah!

I do the opposite of this:

**Merrill Lynch Fund Managers Survey May 4, 2015

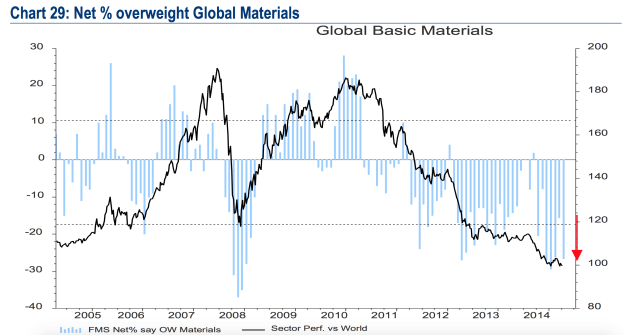
Today’s chart of the day focuses on sentiment in the basic materials sector. Regular readers of the blog already know that I have been closely following Merrill Lynch’s Fund Manager Survey for years now. This months survey was conducted in a period between 2nd to 9th April 2015 with a total of 177 panellists, with $494 billion of assets under management. The survey should be used as a very good contrarian indicator.

According to the recent survey, global fund manager allocation towards global materials declined sharply in the month of April to net 27% underweight from net 16% underweight the previous month. As we can clearly see from todays chart of the day, sentiment is very depressed right now. Merrill Lynch states that the current allocation is 1.8 standard deviation below its long term average.

Furthermore, the overall commodity and natural resources theme is very much disliked by global money managers. Commodity allocation is unchanged for the third straight month and remains at net 20% underweight. That is 1.2 standard deviations below its long term average and even more interestingly, fund managers remain underweight commodities for the 28th month in the row.

(Source: www.shortsideoflong.com)

Great Annual Reports/Shareholder Letters; Catch-22

the outsiders

How-the-outsiders-became-one-of-the-most-important-business-books-in-america/

I recommend the above book!

When we read annual reports and shareholder letters we are searching for good businesses, cheap assets and excellent operators and capital allocators.

From the Preface of  The Outsiders: In assessing performance, what matters isn’t the absolute rate of return but the return relative to peers and the market. You really only need to know three things to evaluate a CEO’s greatness: The compound annual return to shareholders during his or her tenure and the return over the same period for peer companies and for the broader market (S&P 500)

Context matters greatly–beginning and ending points can have an enormous impact, and Welch’s tenure coincided almost exacly with the epic bull market that began in late 1982 and contiued largely uninterrupped until early 2000. During this remarkable period, the S&P 500 averaged a 14 annual return, roughly double its long-term average. It is one thing to deliver a 20 percent return over a period like that and quite another to deliver it during a period that includes several severe bear markets.

A baseball analogy helps to make this point. In the steroid saturated era of the mid-to-late 1990s, twenty-nine nome runs was a pretty medicore level  of offensive output (the leaders consistently hit over sixty). When Babe Ruth hidid it in 1919, however, he shattered the prior record set in 1884 and changed baseball forever, ushering in the mdoern power-oriented game. Again, context matters.

The other important element in evaluating a CEO’s track record is performance relative to peers, and the best way to assess this is by comparing a CEO with a broad universe of peers. As in the game of duplicate bridege, companies competing within a  industry are usually dealt similar hands, and the long term difference between them, therefore, are more a factor of managerial ability than expernal forces.

When a CEO generages signifiantly better returns than both his peers and the market, he deserves to be called “great,” abnd by this definition, Welch, who outperformed the S&P 500 by 3.3 times over his tenure at GE, was an undeniably great CEO.

He wasn’t even in the same zip code as Henry Singleton:

From a Deep-Value Member: Hi guys and girls:

Seeing as though we have such a passionate investors in John’s group, and we’re in annual report season, I wondered if everyone could nominate their top 5-10 “must read” shareholder letters. I will collate the results and re-post the top 10 back to you all when done (hopefully by the coming weekend). I think the idea here is for us all to hear about a few undiscovered names, rather than the obvious ones… so there is nothing too small or obscure as long as you think it conveys something meaningful and insightful.

Please reply with “shareholder letter” in the title as it will make this a little easier for me. Also… we can all assume Berkshire is an annual must read, so lets leave this on one off the list. I’m curious to hear what people have to say. Let me start off seeing as though I have put forward the idea.

  1. Fairfax Financial Letter 20015
    Markel Corporation Annual Report 2014
  2. Burgundy AM (Canada) Stoicism-and-the-Art-of-Portfolio-Intervention       2014-Confessions_of_a_Buffetteer (from Canada)
  3.  http://www.leithner.com.au/links.php (Australian Grahamite-FABULOUS) http://www.chrisleithner.ca/newsletter/index.php#.VUzyCvlVhBc    Great links to investing material/lessons.

Cut and past the above–excellent web-site with a trove of Graham an Dodd links, materials and letters!

JP Morgan
Amphenol
Overstock.Com
Serco Plc
Amerco

……………………………………………

After two weeks of sifting and sorting, I can reveal our top 10 favorite shareholder letters.  It’s an eclectic mix.

Thank you to all you who contributed.

  1. Complete_Buffett_partnership_letters-1957-70
  2. Aristotle Capital Annual Letters Managers-and-Baseball-Aristotle-Borowski-7.22.13     Aristotle-The-Essence-2015Q1-ACML-15-197-Kosher-Meat   Aristotle-Commentary-2015Q1-Value-Equity-ACML-15-220
  3. Ned Goodman Annual Letters Dundee 2013-Annual-Report and Dundee Annual-Report-2012
  4. Ennismore Asset Management Letters OEIC – Most Recent NL  and  Globo – Jan 2014 (Good to see the international managers mentioned)
  5. Oaktree Capital ManagementHoward Marks Liquidity
  6. Packaging Corp of America Shareholder Letters PCA_2014AnnualReport  (??)
  7. Skagen Fund 2015 04 01_Market-report  (looks interesting!)
  8. Expeditors EXPD_2014_Full
  9. Seacor Holdings  SEACOR 2014_Annual_Report (A brilliant man in a mundane group of businesses)
  10. Grantham Mayo van Otterloo – Quarterly Letters  breaking-out-of-bondage-and-are-we-the-stranded-asset- and gmo-7-year-asset-class-forecast-(1q-2015)

Here are my (from another reader/contributor) favorite letters:

Skagen from Norway – Just finished reading it today – good stuff!
http://ipaper.skagenfondene.no/Skagenfondene/English/SKAGENFundsAnnualReport2014/
Go straignt for the PDF (icon in the middle)

About Skagen: We search for companies that are priced significantly lower than our estimation of the value of the underlying operations. Our ideal investment is a company which is Undervalued, Under-researched and Unpopular, and that has potential triggers which could make hidden values visible and therefore create excess returns for our clients.

Troy Asset Management in the UK
http://www.taml.co.uk/archive-reports/investment-reports

Orbis Fund management in Bermuda
https://www.orbisfunds.com/Home   (Free registration required)

Ennismore Small European Value
http://www.ennismorefunds.com/

GMO
www.gmo.com (free registration required but worth it)
Their Quarterly letter is a real gem.
http://www.gmo.com/websitecontent/GMO_Quarterly_Letter_4Q14.pdf

RECM in South Africa
https://www.recm.co.za/

California based Aristotle Capital
http://www.aristotlecap.com/news-events-2/publications/

John Chew: Fantastic to have the international contributions!

Great Value Investing Blogs as chosen by another blogger:

Just wanted to drop a quick note to let you know that we featured csinvesting in a recent roundup of the best dividend / value investing columns:  http://dividendreference.com/articles/2015/170/10-brilliant-value-investing-experts-worth-reading/    (Nice words, but all I need to do to stay humble is ask the opinion of my Ex.


Catch-22 

HAVE A GREAT WEEKEND!


Tim McElvaine: Kissing a lot of frogs to find a prince or Portrait of a Deep Value Investor

“Value investing is about praying on the emotions of the seller,” McElvaine said, noting that he loves to be a buyer of un-loved securities when their owners need out at any cost.

McElvaine pointed to a Globe and Mail headline about beat-up mining stocks being great tax-loss sale candidates this past December. He bought up shares in Sprott Resource Corp and Anglo American recently for trading at considerable discounts to NAV (more info at chat.ceo.ca/mcelvaine).

Six years into the global bull-market and McElvaine’s funds are about 25% in cash to provide an opportunity to buy assets if prices return to Tim’s liking.

Is the US bull-market over? McElvaine talked about what could go right in the United States, and suggested that a great way to stimulate the US Economy would be to wipe out student loan debt, which is $1 trillion of $1.3 trillion owned by the US Government, according to McElvaine. That move could put $1 trillion back in the hands of the most aggressive consumers.

There was a brief moment before Tim’s speech that my dad and I got to share a word with him, and I asked how do they know if a cheaply priced security represents a value gap, meaning it’s undervalued and going higher, or is it a value-trap, as so often cheap stocks get cheaper.

“You don’t know,” Dad and McElvaine agreed, which reminded me of something Tim taught me 6-7 years ago:

“You’ve got to kiss a lot of toads in this business to find your prince.”

Take the time to read his annual reports and transcripts, then go the extra mile and look at the annual reports of the companies he mentions–do you see what he sees?  For example, in the chat of his presentation for 2014 (see bold index and then the link) he mentions that Sprott Resource Corp is trading for about $1.00 Cdn while its NAV is above $3.00 or “It’s not pretty, but it’s cheap.”  Can you learn from his approach and analysis? What would you do differently? You have to be a contrarian with a calculator to buy what is hated.

Some reports below:

Buying dollar bills for fifty cents Recent talk on his investments.
2014-Transcript-of-May14-Annual-meeting

2013-Annual-Report and 2013-Partners-Confererence-Transcript

2012-Annual-Report and 2012-Transcript-Partners-Conference-website-version

Go deeper: http://mcelvaine.com/reports/

Tomorrow: I will post a reader’s list of great annual reports.

I love reading Warren Buffett’s letters and I love contrasting his words with his actions…I love how he criticizes hedge funds, yet he had the first hedge fund,” Mr. Loeb said. “He criticizes activists, he was the first activist. He criticizes financial services companies, yet he loves to invest in them. He thinks that we should all pay taxes, yet he avoids them himself.  – Business Insider LINK

http://investmentresearchdynamics.com/warren-buffet-is-the-definition-of-scumbag/     (A bit over the top but I like to present the contrasting view whether I agree or not).

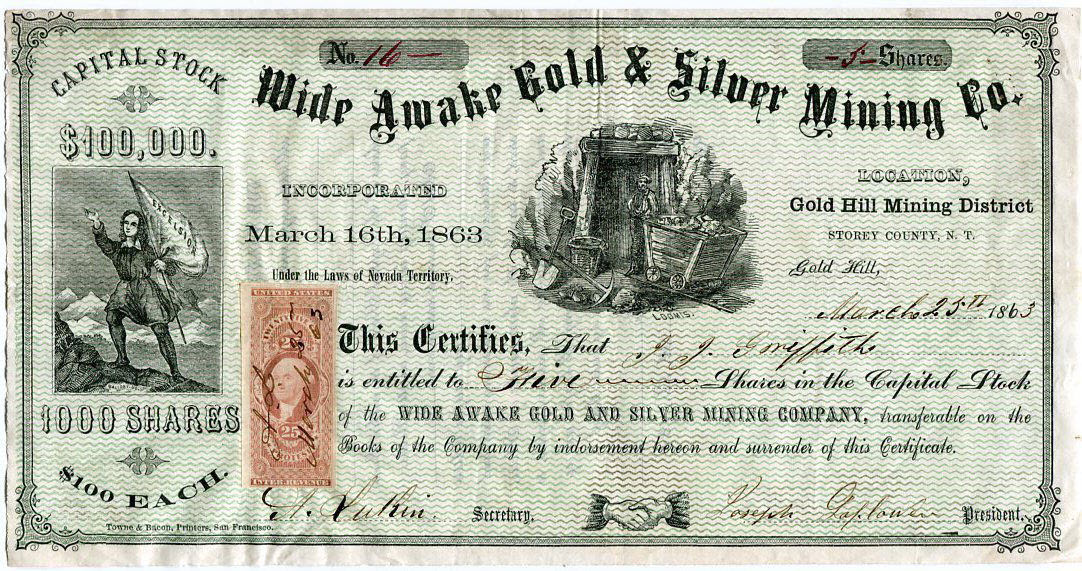
Mark Twain Falls for Silver Fever (A Study in Bubbles)

SilverStock_Certificate_1863

Silver FeverEvidence of bubbles has accelerated since the [2007-2009 financial] crisis.
~ Robert Shiller (“Irrational Exuberance,” 2015).The celebrated author and humorist Samuel Clemens (pen name Mark Twain) documented his experiences in the Nevada mining stock bubble, and his writings are one of the earliest (and certainly the most humorous) firsthand accounts of involvement in a speculative mania.

After a brief stint as a Confederate militiaman during the beginning of the U.S. Civil War, Clemens purchased stagecoach passage west, to Nevada, where his brother had been appointed Secretary of the Territory. In Nevada, Clemens began working as a reporter in Virginia City, in one of Nevada’s most productive silver- and gold-mining regions. He enviously watched prospecting parties departing into the wilderness, and he quickly became “smitten with the silver fever.”

Clemens and two friends soon went out in search of silver veins in the mountains. As Clemens tells it, they rapidly discovered and laid claim to a rich vein of silver called the Wide West mine. The night after they established their ownership, they were restless and unable to sleep, visited by fantasies of extravagant wealth: “No one can be so thoughtless as to suppose that we slept, that night. Higbie and I went to bed at midnight, but it was only to lie broad awake and think, dream, scheme.”

Clemens reported that in the excitement and confusion of the days following their discovery, he and his two partners failed to begin mining their claim. Under Nevada state law, a claim could be usurped if not worked within 10 days. As they scrambled, they didn’t start working, and they lost their claim to the mine.  His dreams of sudden wealth were momentarily set back.

But Clemens had a keen ear for rumors and new opportunities. Some prospectors who found rich ore veins were selling stock in New York City to raise capital for mining operations. In 1863, Clemens accumulated stocks in several such silver mines, sometimes as payment for working as a journalist. In order to lock in his anticipated gains from the stocks, he made a plan to sell his silver shares either when they reached $100,000 in total value or when Nevada voters approved a state constitution (which he thought would erode their long-term value).

In 1863, funded by his substantial (paper) stock wealth, Clemens retired from journalism. He traveled west to San Francisco to live the high life. He watched his silver mine stock price quotes in the newspaper, and he felt rich: “I lived at the best hotel, exhibited my clothes in the most conspicuous places, infested the opera. . . . I had longed to be a butterfly, and I was one at last.”

Yet after Nevada became a state, Clemens continued to hold on to his stocks, contrary to his plan. Suddenly, the gambling mania on silver stocks ended, and without warning, Clemens found himself virtually broke.

“I, the cheerful idiot that had been squandering money like water, and thought myself beyond the reach of misfortune, had not now as much as fifty dollars when I gathered together my various debts and paid them.”

Clemens was forced to return to journalism to pay his expenses. He lived on meager pay over the next several years. Even after his great literary and lecture-circuit success in the late nineteenth century, he continued to have difficulty investing wisely. In later life he had very public and large debts, and he was forced to work, often much harder than he wanted, to make ends meet for his family.

Clemens had made a plan to sell his silver stock shares when Nevada became a state. His rapid and large gains stoked a sense of invincibility. Soon he deviated from his stock sales plan, stopped paying attention to the market fundamentals, and found himself virtually broke.

Clemens was by no means the first or last person to succumb to mining stock excitement. The World’s Work, an investment periodical published decades later, in the early 1900s, was beset by letters from investors asking for advice on mining stocks. The magazine’s response to these letters was straightforward:  “Emotion plays too large a part in the business of mining stocks. Enthusiasm, lust for gain, gullibility are the real bases of this trading. The sober common sense of the intelligent businessman has no part in such investment.” (from Meir Statman)

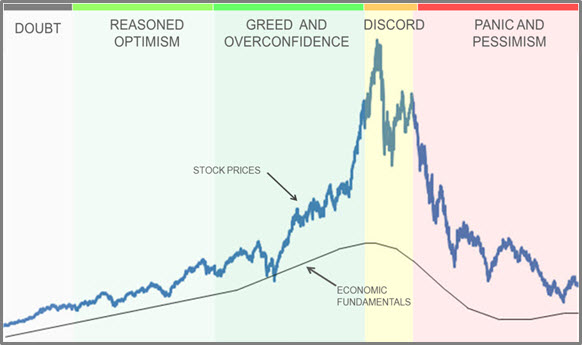
While the focus of market manias changes – mining, biotech, Chinese stocks, housing, etc… – the outline of a speculative bubbles remains remarkably similar over the centuries.  Today’s newsletter examines the latest research into speculative bubbles and looks at how we can apply that knowledge, with examples of the recent booms (bubbles?) in Chinese stocks and Biotech.  This newsletter is much longer than usual letter, in part because the topic is both complex and important.  Skip ahead to the end for the Chinese and Biotech conclusions.  Speculative bubbles_2

nasdaq bubble

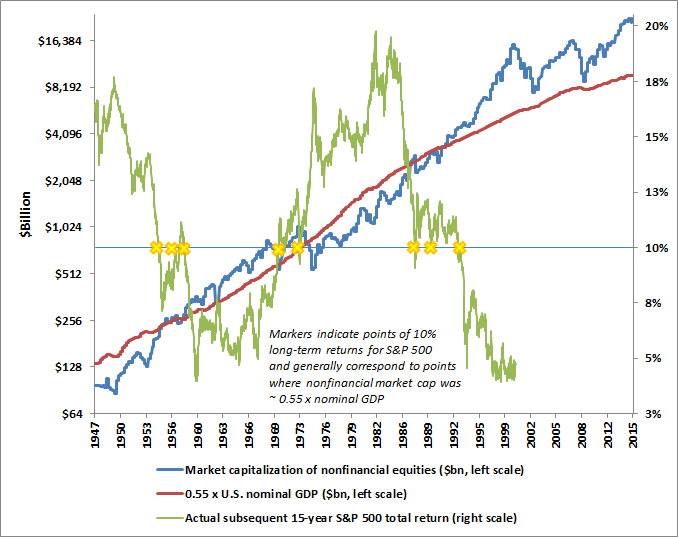
Hate Math

Poor future returns


Source: http://hussmanfunds.com/wmc/wmc150504.htm

Prof. Greenwald on Value Investing

OVERVIEW Value_Investing_Slides

Greenwald_2005_Inv_Process_Pres_Gabelli in London

Greenwald Overview of VI

A Value Investing Class in Three Minutes

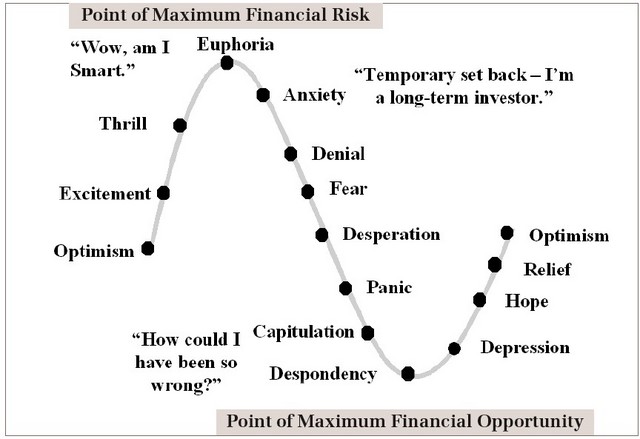
sentiment_cycles
Buying High

Next Week

I have been too busy to do another lesson but be ready next week! For those attending the Berkshire Hathaway Meeting in Omaha enjoy the experience. Flash your Deep-Value Group card for up to 95% discounts.

HAVE A GREAT WEEKEND!

Don’t Spare the Rod: Critique of Investment Research Reports

Time WarnerA beginning analyst sent me a research report to discuss: Ensco PLC Write-Up

Now before I start, realize that when I was beginning, my idea of a research report was to mimic Cramer.  Buy because the “chart” looks good and I gotta feelin’.  One time my hedge fund boss said his time was worth $1,000 an hour so the six minutes he took to read my incoherent report meant that I OWED HIM, $100.  Well, we all have to start somewhere.  The point of this exercise is to learn.

Buffett’s punch   idea may apply. If you only had twenty investment ideas over a lifetime–one every two to three years–would this be it? Would you put all of your money and family’s money into the idea and why?

Or, you pretend that you have a 45-second ride in the elevator to the top of the Time Warner building with Carl Icahn while selling your idea.

Bill Miller once said that money managers had the attention span of knats. You had to summarize your thesis and then give three or four supporting reasons within thirty seconds.

My critique of Ensco PLC

Instead of four paragraphs to tell me what Ensco does, perhaps you can be more succinct while putting forth what is compelling about your investment thesis.

ESV (Ensco, PLC) is an owner/operator of offshore contract drilling rigs/services that is trading at X% under tangible book value.  This is a cyclical, asset-intensive business subject to swings in natural gas and oil prices. Over a fully cycle, the company earns normal returns on capital of XX?

The price: Enterprise Value

Returns: over several prior cycles?

Capital structure and terms of debt?

Bottom line: this is a non-franchise or asset-based investment that is currently and cyclically out of favor.  OK.   But if this is an asset based business what are the assets worth?  You would need to dig into tangible book–what is there?   What is the current and expected replacement value of their assets? Liquidation value?  Is their fleet of rigs unique? Who are their competitors?  Any hidden assets or potential assets like, say, NOLs or assets outside their core business for example?

What is their cash flow and owner earnings?   I would like to see enterprise value over EBITDA-MCX over the past decade to get an idea of how the market priced ESV over a cycle.

Who is management? What skin do they have in the game? Are they good operators and capital allocators? Insider buying?  Who owns this company?  I don’t have much to go on in the above report so I jump to my handy VL: ESV_VL.  Whoa!  I see debt has jumped about 35% from 2013. How does their capital structure compare to competitors?   It seems like there isn’t much free cash flow. Capex eats up most of the company’s cash flow.

Where is the margin of safety? Book value has been growing but during an up-cycle in drilling. What happens in a prolonged down-cycle?  What are the risks?   You mention a DCF? Where did that come from? Your assumptions?

I will let others in the Deep-Value group chime in, but for a first-ever research report I give a D- which isn’t bad. At least the writer has good instincts to look at an out-of-favor company, but the core analysis of the assets needs to be provided. Also the competitive landscape.  Obviously, it is a business without a competitive advantage due to the low and cyclical nature of the returns, so how does this business compare operationally, financially and value-wise to their main competitors? Who are their customers and how are they faring?

The only way to improve is to write, practice and look at other reports. Go to www.valueinvestorsclub.com and sign up. Then look at the highest rated ideas and study those along side the 10-K of the company mentioned.

Study Other Examples of Research

Or The_Security_I_Like_Best_Buffett_1951  Warren Buffett on Geico.

https://sumzero.com/sp/bc_winner (you may have to paste into your browser) and as reference, Rockwell Automation Inc and ROK_VL from a Deep-Value member, Thomas Harris. We can critique this next if you wish.

Carl Icahn paid $500,000 for an investment bank to furnish a report on breaking up Time-Warner: lazard_twx (worth a look!) and Icahn was right about Time Warner

Analyzing Debt

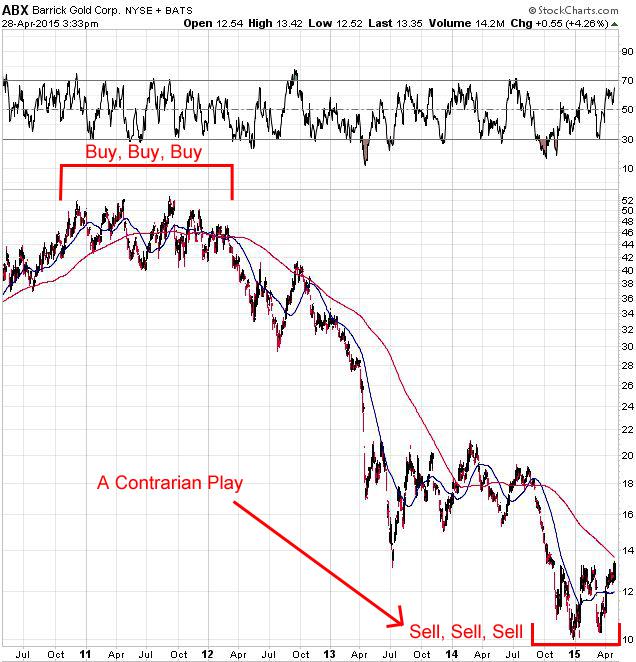
Sell ABX

ABX Sombull along with Barrick Annual Report 2014 and Barrick 1 Q 2015

https://www.coursera.org/learn/learning-how-to-learn

http://en.wikipedia.org/wiki/How_to_Read_a_Book

Stay with it………writing is hard and finding great ideas even harder.

I See Dead People

Dead people

https://youtu.be/QUYKSWQmkrg

I hooked up my accelerator pedal in my car to my brake lights. I hit the gas, people behind me stop, and I’m gone. Steven Wright


The Endless Search for Value

I know we have lessons to complete in Quantitative Value, but I also use this blog as a poster board to refer back to when assessing events, thoughts, and ideas.

After spending four hours groping through the Value Line’s 2,000 companies, I don’t find much of interest besides the uglies of Russian and Brazilian stocks, coal, uranium, silver and gold miners.  Most readers here are too refined even to think of investing in such cyclical companies.  What would your Momma say?

I find the relentless buying by insiders in small mining stocks to be interesting while corporate insiders in other companies want cash now and not stock. For example, https://www.canadianinsider.com/node/7?ticker=LYD

http://wolfstreet.com/2014/09/23/what-are-corporate-insiders-seeing-that-makes-them-dump-their-shares-like-this/

 Here is a company just pulled at random from Value-Line:

CPST_VL There is always hope   Value or Death Trap?  Going up the capitalization scale doesn’t help either: CRM The profits will come tomorrow. intc Will the bad news be priced in?

Where is the value 

Fair value on the S&P 500 has three digits

We don’t know when the movie ends, just that it will end badly.

Good Reading

https://www.santangelsreview.com/2014/06/16/interview-with-2014-ira-sohn-contest-winner-michael-guichon/

http://alephblog.com/

http://brontecapital.blogspot.com


A WHITE HAT’S STATEMENT ON BALTIMORE RIOTS

Wow, well said and rare. Doubt if control grid mainstream media will be having this white hat on the air.  Orioles Executive Vice President John Angelos, son of majority owner Peter Angelos:

“Speaking only for myself, I agree with your point that the principle of peaceful, non-violent protest and the observance of the rule of law is of utmost importance in any society. MLK, Gandhi, Mandela, and all great opposition leaders throughout history have always preached this precept. Further, it is critical that in any democracy investigation must be completed and due process must be honored before any government or police members are judged responsible.

That said, my greater source of personal concern, outrage and sympathy beyond this particular case is focused neither upon one night’s property damage nor upon the acts, but is focused rather upon the past four-decade period during which an American political elite have shipped middle class and working class jobs away from Baltimore and cities and towns around the U.S. to third-world dictatorships like China and others.

The outcome plunged tens of millions of good hard-working Americans into economic devastation. Then they followed that action by diminishing every American’s civil rights protections in order to control an unfairly impoverished population living under an ever-declining standard of living and suffering at the butt end of an ever-more militarized and aggressive surveillance state.

The innocent working families of all backgrounds whose lives and dreams have been cut short by excessive violence, surveillance, and other abuses of the Bill of Rights by government pay the true price, an ultimate price, and one that far exceeds the importance of any kids’ game played tonight, or ever, at Camden Yards.

We need to keep in mind people are suffering and dying around the U.S., and while we are thankful no one was injured at Camden Yards, there is a far bigger picture for poor Americans in Baltimore and everywhere who don’t have jobs and are losing economic civil and legal rights, and this makes inconvenience at a ball game irrelevant in light of the needless suffering government is inflicting upon ordinary Americans.”

Time Preference: The Future is Today

nq150425

I was walking down the street wearing glasses when the prescription ran out. —Steven Wright

Time Preference

People value present goods over future goods. Would you pay 50 cents for a glass of beer today or a year from now?

An increase in time preference implies that a higher ratio of income is devoted to consumption vs. savings and investment for the future. Central banks with their policy of financial repression (Zero Interest Rates Policy or “ZIRP”) want to “correct” underconsumption.  Please take me to meet an “underconsumer.”

While aggressively seeking to increase time preferences with all its negative implications, on the one hand, central banks are trying to give the impression that time preference is lower than it really is by making current levels of consumption seem more sustainable by forcing down interest rates and replacing savings with cheap credit. This artificially extends time horizons and increases confidence. However, a rising time preference is indicative of a weakening economy, not a strong one and one which is more vulnerable than it appears…..

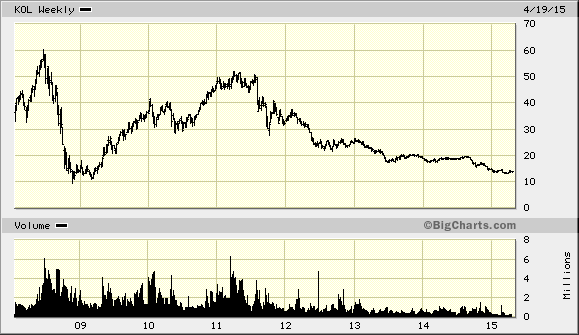
If central banks induce businesses to make incorrect capital investment decisions, the end result will be that production is out of line with consumption preferences. This will distort the ratio of capital and consumer goods. In such circumstances some of the increased capital goods will turn out to be mal-investment. Capital will decrease both in terms of physical wastage and loss of value, and decisions on new investment will be cancelled.  Look at the cyclical iron ore and coal markets today! Note KOL (Coal ETF)

big

If you invest in any business that is cyclical then read this:

Selling-Time What is happening today due to central bank distortion of time preferences. Must Read!

The Pure Time-Preference Theory of Interest_2 The following essays parse through the uniquely Austrian insight of the pure time-preference theory of interest, but more importantly go to the core of why modern central bank monetary engineering leaves the economy further from recovery while at the same time providing a Petri-dish for speculation and mal-investment–Douglas French

For those who want to go even further:


The Gold Market

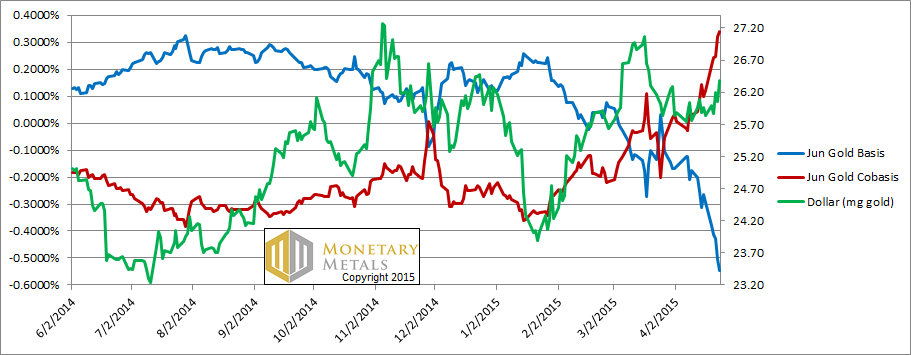
The twilight zone in gold (from Monetary-Metals): Spot Gold trades at a premium to distant contracts.  Financial historians will look back in fifty years and ask what were they thinking? We live in the biggest global credit bubble in history.

For each metal, we will look at a graph of the basis and cobasis overlaid with the price of the dollar in terms of the respective metal. It will make it easier to provide brief commentary. The dollar will be represented in green, the basis in blue and cobasis in red.

Here is the gold graph: The Gold Basis and Cobasis and the Dollar Price

letter-apr-26-gold

Along with the rising dollar (green line), we see rising scarcity in gold (i.e. cobasis, the red line or the bid for spot gold is rising relative to the offer for future delivery). One could now earn 0.34% annualized, to sell a bar of gold and buy a June contract. Where else can one get that kind of return on a two-month bill or note? This opportunity should  never exist in the gold market, but it does. The August contract is not backwardated yet, but it’s close.  (Source: www.monetary-metals.com).

A scramble to obtain physical gold is indicative of a rising time preference or time horizons are becoming shorter in the gold market. I want possession of my gold NOW rather than not risk obtaining it in the future. A sign of increasing risk awareness.

We live in interesting times.


Time-Out: Special Situation of a Capital Change (BB) GWW

Thin ICe

 I spilled spot remover on my dog. Now he’s gone. — Steven Wright

W. W. Grainger (GWW)

Someone asked what data tools do I use.  My brain and a Value-Line.

Try to look at the Value-Lines WITHOUT looking at the price of the stock. What would you pay for this entire business–not knowing what it did and the current price of the company?  Start with the numbers (excluding the stock price, at first) so to keep your prejudices at bay.   Maybe have a friend print out the Vale-Line and cut off the top of the page.

GWW_VL Jul 2014 and GWW_VL   Something should strike you about this business. What?  Asset or franchise?

A competitor: Fast VL

Grainger_ Capital Allocation-FINAL Whoa? An announcement of a capital structure change–so a type of special situation.  What does this mean?

Grainger_ 2015FactBook Time to dig deeper Grainger_2014_ARGrainger 14BALSTGrainger 14EARN

Ok, about what is this company worth and what type of return could I expect at today’s _____ price?

Not a recommendation! Do your own thinking because then you learn from your mistakes AND successes.

If you don’t know or are not sure; it is just too tough, difficult, or confusing, then you can always do this:

Lyrics

And when I see the sign that points one way
The lot we used to pass by every day

Just walk away, Renee
You won’t see me follow you back home
The empty sidewalks on my block are not the same
You’re not to blame

From deep inside the tears that I’m forced to cry
From deep inside the pain that I chose to hide

Just walk away, Renee
You won’t see me follow you back home
Now, as the rain beats down upon my weary eyes
For me, it cries

Just walk away, Renee
You won’t see me follow you back home
Now, as the rain beats down upon my weary eyes
For me, it cries

Your name and mine inside a heart upon a wall
Still finds a way to haunt me though they’re so small

Just walk away, Renee
You won’t see me follow you back home
The empty sidewalks on my block are not the same
You’re not to blame