Category Archives: Valuation Techniques

Valuing a Coal Company: How Do We Start?

hALLODOR

From a reader: Hi John,

Thank you for the library access to VL. Responses about Value-Line from the group have been underwhelming. Got zero replies for discussion about coal or other topics. Most people just ask for certain industries (REIT, Insurance, Chemicals), so I tried to make it interesting by asking for a “quick and dirty” valuation in return for VLs, but I did not get the promised short write ups. So I have stopped uploading to the group for now.

John Chew: Sorry to hear that, but, on the other hand, most folks are too busy and distracted to do the hard work–therein lies our opportunity.

I’m trying to value Cloud Energy and am not sure how to go about it. Its proven and probable reserves are 1.1billion tons. With an average margin of $3.2 since 2010 (selling price per ton – average cost per ton), this works out to 1.1×3 or 3.3 total value of coal. But the variation low is about 2.24. Cloud makes money and is able to service debt. It is also trying to cut cost. The coal value works out to 3.3/61mil sh outstanding or about 40-$51/sh.  The highest it has traded is half this value. I understand the problems with coal now (cheap oil, natural gas, environment, competition from other suppliers), but would like to know what it is worth.

I’ve looked on your blog for examples for asset type companies, but you have not posted some like RGLD, FNV, SLV etc. The case studies on CRR and other nuggets like determining the per unit value and spread (for gold) were helpful. Could I get your write up for coal and gold?

John Chew: Ask what would you need to know to own a coal company outright? If this was one of your lifetime investments what would you look for?

If I wanted to buy a coal company outright, I would want a productive asset. How much coal is it selling, price, what it costs them to dig it out of the ground and get to market, and how much it has left, whether it is sustaining itself and has costs under control.

CLD operates ok and management is doing what it can to cut costs to weather the industry downturn.

EV/EBITDA is 4.54, almost half 8.9 industry EV/EBITDA multiple. This works out to about 38.25-40.5.

Tangible Book Value is around 17.2.  Price is significantly below. I’m surprised it went so much below tangible book.

John Chew: So why is the market pricing CLD at $4.50? (June 17th 2015). What is the market implying by the current price?

There is even cash flow and decreasing capex, So 2.4-.31 with no growth and 10% return req is about $20.

Margin between cost to mine of 10-10.19 and sell price of 13 is 2.81. Taking off tax considerations, leaves 1.9 approx. With no growth, I would pay 19. It’s 4.5 now.

Its per ton cost is 10.2 and 2015 sell price is estimated 12+ to 13. The 3.5 mines it owns are productive. Thermal coal is 44/ton but using their 10.2 sale price is more relevant. Sales to Asia seems to be the demand driver.

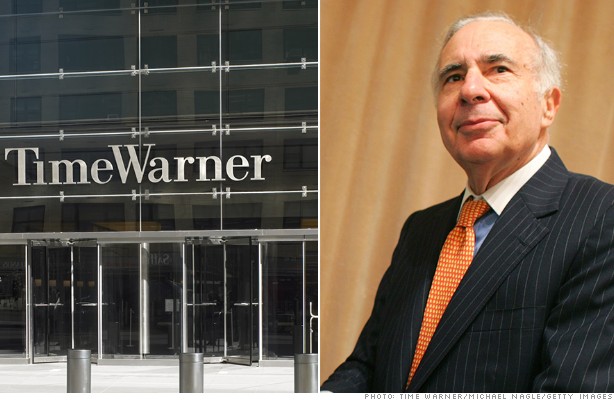
Vulture funds also seem to be waiting for some industry consolidation (which has not materialized yet) before buying.
http://www.smh.com.au/business/coal-vultures-await-further-pain-before-pouncing-on-assets-20150616-ghotux.html

Thank you. Appreciate your help.

John Chew: You ask the right questions.  If we buy a coal company we have to know how much (in total on a sustaining basis) does it take to find, mine and replenish reserves. What influences the customer’s decision to buy?  What does the demand and supply of coal look like in the past, present and what might influence the future?

Let’s start by:

1. getting an overview of the coal market

http://www.peabodyenergy.com/content/107/about-coal

Search out all the negatives on coal like: Obama’s War on Coal https://youtu.be/a-wCC0Szx4g

Coal-Financial-Trends-ETA

To survive in an industry consolidation/shakeout, you must find the lowest cost producers on the cost curve:  http://www.fool.com/investing/general/2013/09/21/oil-and-coal-stock-valuation-what-youre-missing.aspx

Despite the hysteria of pension fund divestitures, cheap natural gas, global warming, what is actually going on?

Primary energy consumption continues to grow and will be dominated by fossil fuels and nuclear power for many years, but renewables continue to post the highest growth rates by far. In 2014, renewables comprised 2% of primary energy consumption, with hydropower adding another 7%. Nuclear power accounted for 4% of the world’s primary energy consumption, while oil continues to be the world’s leading primary energy source at 33% of overall consumption. Coal is responsible for another 30%, while natural gas makes up 24% of the world’s primary energy consumption. See statistics:

http://www.bp.com/en/global/corporate/about-bp/energy-economics/statistical-review-of-world-energy.html

Also, http://www.eia.gov/coal/

Also, review the past annual reports and presentations of:

Arch coal, Peabody, Consol Energy, Cloud Peak Energy.

Thoughts on valuation of mining companies: http://www.avoidglasses.com/valuing-a-mining-company-using-net-present-value/

Valuation_of_Metals_and_Mining_Companies

Also, an EXCELLENT annual report on the operations of Hallador Energy:

http://media.corporate-ir.net/media_files/IROL/98/98288/CorpOverview_Shareholders_Meeting_04232015.pdf

HNRG_VL

HNRG_VL 2013

CLD_VL

ANR_VL

The Gloves Are Off in Mining

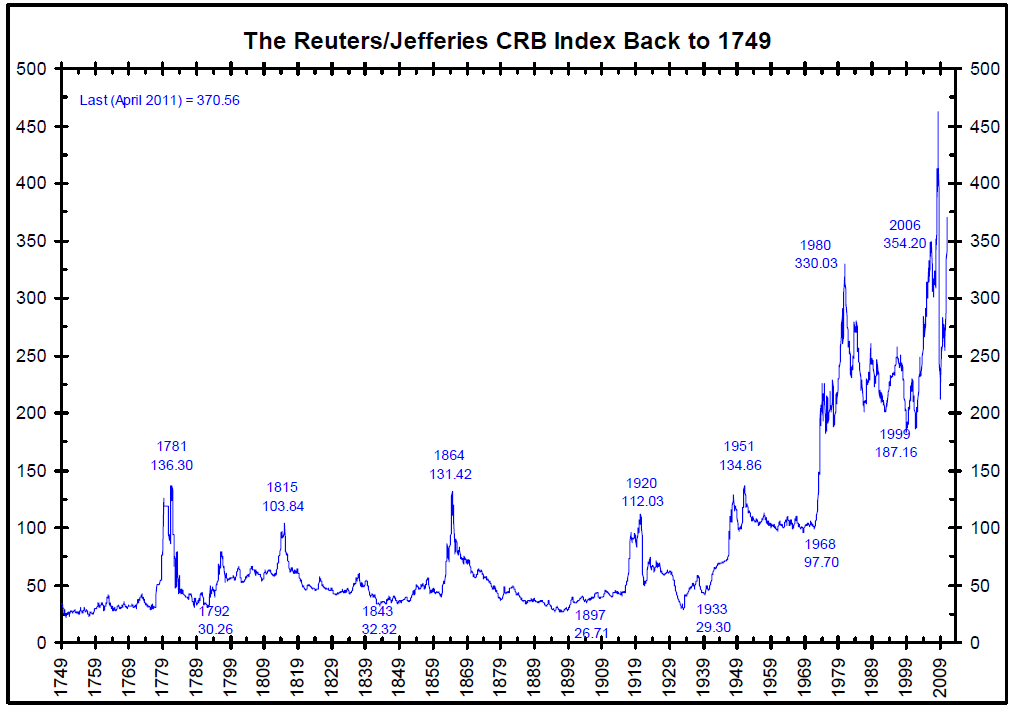
We probably need to look at a history of met. coal prices (Newcastle) for the past 20 years and various Thermal Coal prices and compare how companies did.

We want companies that will survive/thrive in this chaos.   Right now the coal market is suffering a cascading amount of bad news: pension fund divestitures, low natural gas prices, China not importing as much, unknown environmental laws, impending bankruptcies, and falling stock prices.

Ask who is on the other side of the trades?

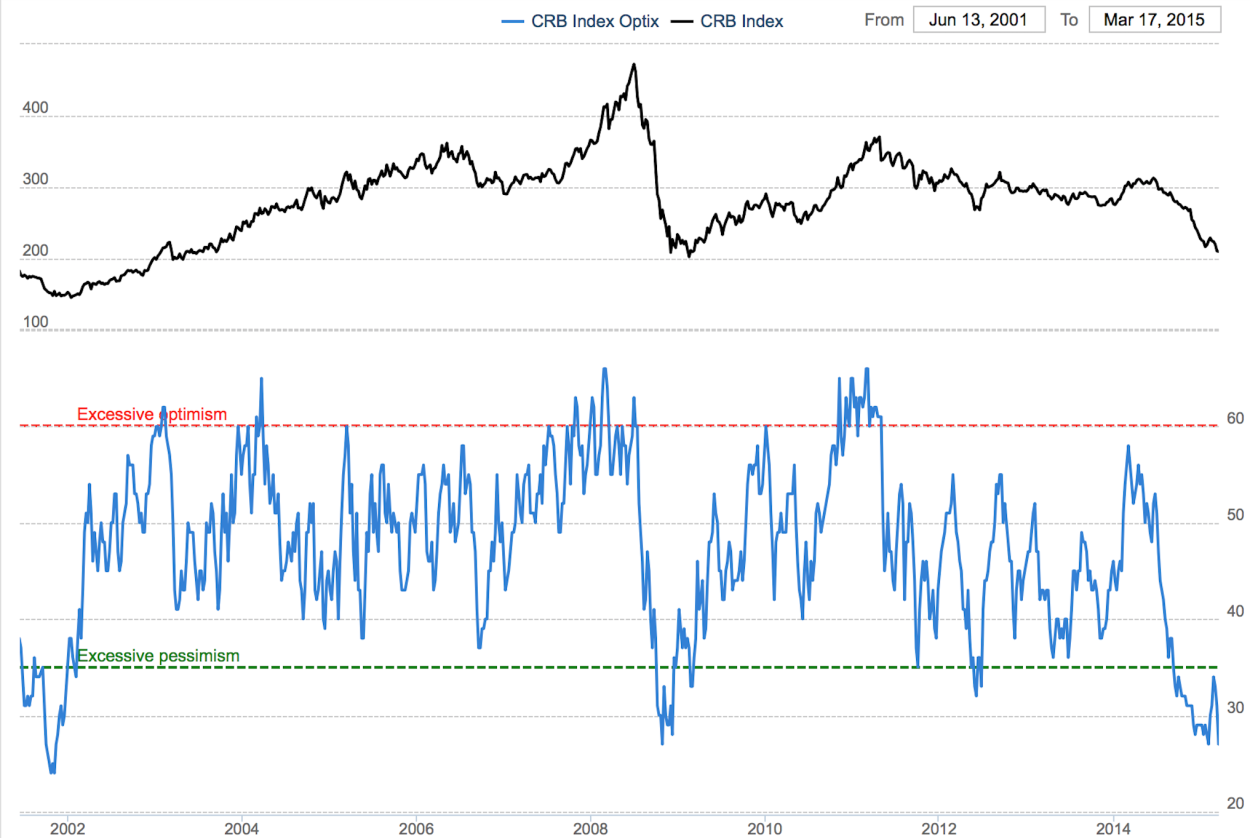
By next week, let’s lay out the financials and operating metrics of both Hallador Energy (HNRG) and Cloud Peak Energy (CLD).   Are we at the trough of the cycle and how long would it take for a peak in the cycle based on history?

If you use EV/EBITDA don’t forget to also deduce maintenance capex or the capex needed to sustain operations.  Since coal is a bulky/low cost product, the cost of shipping to the customer may be a major part of the final cost to the customer, so where are the mines located in relation to the customer?

What are our companies worth in various scenarios: Bad Cast, Base case, Good case?  

What is the cure for low prices of coal?  What signs to look for?

WEDNESDAY, APRIL 11, 2007 http://stockmarketnotes.blogspot.com/2007/04/costton-is-appropriate-measure.html

Cost/Ton is the Appropriate Measure to Compare Coal Companies

The Wheel of Fortune: Mean Reversion (Part 1)

graves

Last post on Chapter 4 in Quantitative Valuehttp://csinvesting.org/?p=10730 . Let’s get back to our course on Deep Value.

Let’s go back to DEEP VALUE, Chapter 5: A Clockwork Market: Mean reversion and the Wheel of Fortune.

As a value investor you are doing either:

  1. Buying a franchise, where barriers to entry allow for profitable growth, before mean reversion sets in or
  2. Buying assets where the normalized earnings’ power of those assets is below norm (Asset value = Earnings Power Value) and earnings’ power will mean revert to normal.

Therefore the concept of Regression to the Mean is powerful.  By putting the words, “Many shall be restored that now are fallend and many shall fall that now are in honor” on the facing page of Security Analysis, Graham gave the most prominent position in his seminal text to the idea that Fortuna’s wheel turns too for securities, lowering those that have risen and lifting those that have fallen.  The line, from Horace’s Ars Poetica, echoes the phrase spoken by the wise men of legend who boiled down the history of mortal affairs into the four words, “This too will pass.”  This is regression toward the mean. (p. 79).

The more extreme the initial price movement, the greater will be the subsequent adjustment in the opposite direction. There tends to be a price trend before reversal. The reasons are manifold, but the most obvious is that the trials aren’t independent—our own trading decisions are affected by the buying or selling preceding our trade.

Keynes discussed this phenomenon here:

https://www.marxists.org/reference/subject/economics/keynes/general-theory/ch12.htm or John Maynard Keynes and his life as an investor, Keynes as an investor

Two economists known for research into both market behavior and individual decision-making, Werner De Bondt and Richard Thaler, theorized that it is this overreaction to meaningless price movements that creates the conditions for mean reversion. Note page 800 in the link Does Stock Market Overreact—  the loser and winner portfolios.  Losers win out.

In a second study, Further Evidence of Inv Overreaction Thaler, Thaler and De Bondt revisited the research from a new perspective.  They hypothesized that the mean reversion they obserbed in stock prices in the first study might have been caused by investors focusing too much on the short-term. this fixation on the recent past and failure to look beyond the immediate future would cause investors to miscalculate future earnings by failing to account for mean reversion.  If earnings were also mean reversing, then extreme stock price increases and decreases might, paradoxically, be predictive of mean-reversion not just in stock prices, but in earnings too.  A stock price that has fallen a great deal becomes a good candidate for subsequent earnings growth, a vice versa for a stock price that has gone up a lot.  As you can see from the two research reports that the undervalued portfolio delivered better earnings and price performance.

The above research stand the conventional wisdom on its head and show compelling evidence for mean reversion in stocks in a variety of forms.

Buffett Discusses Mean Reversion in the Stock Market

Buffett_on_1999_Stock_Market_-_Fortune_Article & 2008 Market Call and a MUST READ: A Study of Market History through Graham Babson Buffett and Others

In the 1964 to 1981 period, Buffett wrote, U.S. GNP almost quintuples, rising 373 percent. The market, by contrast, went nowhere.

The evidence is that valuation, rather than economic growth, determines investment returns at the market and country level. Research suggests that chasing growth economies is akin to chasing overvalued stocks, and generates disappointing results. See

The growth illusion

Alas, this is not the case. Work done by Elroy Dimson, Paul Marsh and Mike Staunton at the London Business School established this back in 2005. Over the 17 countries they studied, going back to 1900, there was actually a negative correlation between investment returns and growth in GDP per capita, the best measure of how rich people are getting.  In a second test, they took the five-year growth rates of the economies and divided them into quintiles. The quintle of countries with the highest growth rate over the previous five years, produced average returns over the following year of 6%; those in the slowest-growing quintile produced returns of 12%. In a third test, they looked at the countries and found no statistical link between one year’s GDP growth rate and the next year’s investment returns.

Why might this be? One likely explanation is that growth countries are like growth stocks; their potential is recognised and the price of their equities is bid up to stratospheric levels. The second is that a stockmarket does not precisely represent a country’s economy – it excludes unquoted companies and includes the foreign subsidiaries of domestic businesses. The third factor may be that growth is siphoned off by insiders – executives and the like – at the expense of shareholders.

Paul Marson, the chief investment officer of Lombard Odier, has extended this research to emerging markets. He found no correlation between GDP growth and stockmarket returns in developing countries over the period 1976-2005. A classic example is China; average nominal GDP growth since 1993 has been 15.6%, the compound stockmarket return over the same period has been minus 3.3%. In stodgy old Britain, nominal GDP growth has averaged just 4.9%, but investment returns have been 6.1% per annum, more than nine percentage points ahead of booming China.

What does work? Over the long run (but not the short), it is valuation; the higher the starting price-earnings ratio when you buy a market, the lower the return over the next 10 years. That is why buying shares back in 1999 and 2000 has provided to be such a bad deal.

High Growth Depresses Future Stock Returns

Why does high growth seem to depress stock market returns and low growth seem to generate high stock market returns?  The market ALREADY recognizes the high growth nation’s potential, and bids the price of its equities too high. Market participants become overly optimistic during periods of high growth, driving up the prices of stocks and lowering long term returns, and become too pessimistic during busts, selling down stocks and creating e conditions for high long-term returns.  More research on that here:

  1. Jay_Ritter_paper_14_August Economic Growth and Stock Returns
  2. value-vs-glamour-a-global-phenomenon
  3. Blinded by Growth

I will finish this chapter in the next post. If you do not have DEEP VALUE or Quantitative Value, then join the deep value group found here: http://csinvesting.org/2015/01/14/deep-value-group-at-google/ and I will send.

If you only understand one concept besides Margin of Safety in investing then let it be Reversion to the Mean.

Lesson on Franchises in Cyclical Markets

Gold-Miners-vs-200-MA


Mining-Stocks-Sentiment

Money Managers Are Price Chasers

Markets can do ANYTHING in the short-term, so the following is not a prediction that miners will rise in price. However, what comes first–the price rising or the buying? 🙂 Miners chop around in a trading range as money managers flee the sector and now sit with record low allocations to this sector. * How good are money managers (on the whole) picking the right sector to invest in?  I leave it to you to find that out.

Wedgewood Partners: Franchises in Cyclical Market and a Lesson on Diversification

wedgewood partners fourth quarter 2014 client letter Look at pages 12-20 where David Rolfe, the manager, discusses NOV, SLB and CLB–high-quality companies in the cyclical oil sector.

  1. clb_vl
  2. slb_vl
  3. nov_vl

He points out diversification may mean the sources of profitability can be different among companies within a particular sector.  (Refer to Competition Demystified by Bruce Greenwald for a course on this distinction). Note the high revenue conversion to free cash flow (page-14) for those companies compared to other companies in the oil services sector.

Now move on to wedgewood partners first quarter 2015 client letter crude realities.  Note on page 13 how he looks at the oil services market–the structural attribute to focus on is drilling intensity.  Interesting…. Look at pages 18 and 19 for a further discussion on NOV and CLB.

To learn, you might download those company’s recent annual reports and try to figure out their revenue to free cash flow conversion.  Look at what the companies use for maintenance capex.  Note how Core Labs is a free cash flow gusher (Charlie Munger would smile on this).  Core Labs is a different business than SLB and NOV, but is grouped in the same industry/index.  When sellers of ETF sell, they don’t distinguish among companies and therein lies opportunity for us. Yeah!

I do the opposite of this:

**Merrill Lynch Fund Managers Survey May 4, 2015

Today’s chart of the day focuses on sentiment in the basic materials sector. Regular readers of the blog already know that I have been closely following Merrill Lynch’s Fund Manager Survey for years now. This months survey was conducted in a period between 2nd to 9th April 2015 with a total of 177 panellists, with $494 billion of assets under management. The survey should be used as a very good contrarian indicator.

According to the recent survey, global fund manager allocation towards global materials declined sharply in the month of April to net 27% underweight from net 16% underweight the previous month. As we can clearly see from todays chart of the day, sentiment is very depressed right now. Merrill Lynch states that the current allocation is 1.8 standard deviation below its long term average.

Furthermore, the overall commodity and natural resources theme is very much disliked by global money managers. Commodity allocation is unchanged for the third straight month and remains at net 20% underweight. That is 1.2 standard deviations below its long term average and even more interestingly, fund managers remain underweight commodities for the 28th month in the row.

(Source: www.shortsideoflong.com)

Prof. Greenwald on Value Investing

OVERVIEW Value_Investing_Slides

Greenwald_2005_Inv_Process_Pres_Gabelli in London

Greenwald Overview of VI

A Value Investing Class in Three Minutes

sentiment_cycles
Buying High

Next Week

I have been too busy to do another lesson but be ready next week! For those attending the Berkshire Hathaway Meeting in Omaha enjoy the experience. Flash your Deep-Value Group card for up to 95% discounts.

HAVE A GREAT WEEKEND!

Don’t Spare the Rod: Critique of Investment Research Reports

Time WarnerA beginning analyst sent me a research report to discuss: Ensco PLC Write-Up

Now before I start, realize that when I was beginning, my idea of a research report was to mimic Cramer.  Buy because the “chart” looks good and I gotta feelin’.  One time my hedge fund boss said his time was worth $1,000 an hour so the six minutes he took to read my incoherent report meant that I OWED HIM, $100.  Well, we all have to start somewhere.  The point of this exercise is to learn.

Buffett’s punch   idea may apply. If you only had twenty investment ideas over a lifetime–one every two to three years–would this be it? Would you put all of your money and family’s money into the idea and why?

Or, you pretend that you have a 45-second ride in the elevator to the top of the Time Warner building with Carl Icahn while selling your idea.

Bill Miller once said that money managers had the attention span of knats. You had to summarize your thesis and then give three or four supporting reasons within thirty seconds.

My critique of Ensco PLC

Instead of four paragraphs to tell me what Ensco does, perhaps you can be more succinct while putting forth what is compelling about your investment thesis.

ESV (Ensco, PLC) is an owner/operator of offshore contract drilling rigs/services that is trading at X% under tangible book value.  This is a cyclical, asset-intensive business subject to swings in natural gas and oil prices. Over a fully cycle, the company earns normal returns on capital of XX?

The price: Enterprise Value

Returns: over several prior cycles?

Capital structure and terms of debt?

Bottom line: this is a non-franchise or asset-based investment that is currently and cyclically out of favor.  OK.   But if this is an asset based business what are the assets worth?  You would need to dig into tangible book–what is there?   What is the current and expected replacement value of their assets? Liquidation value?  Is their fleet of rigs unique? Who are their competitors?  Any hidden assets or potential assets like, say, NOLs or assets outside their core business for example?

What is their cash flow and owner earnings?   I would like to see enterprise value over EBITDA-MCX over the past decade to get an idea of how the market priced ESV over a cycle.

Who is management? What skin do they have in the game? Are they good operators and capital allocators? Insider buying?  Who owns this company?  I don’t have much to go on in the above report so I jump to my handy VL: ESV_VL.  Whoa!  I see debt has jumped about 35% from 2013. How does their capital structure compare to competitors?   It seems like there isn’t much free cash flow. Capex eats up most of the company’s cash flow.

Where is the margin of safety? Book value has been growing but during an up-cycle in drilling. What happens in a prolonged down-cycle?  What are the risks?   You mention a DCF? Where did that come from? Your assumptions?

I will let others in the Deep-Value group chime in, but for a first-ever research report I give a D- which isn’t bad. At least the writer has good instincts to look at an out-of-favor company, but the core analysis of the assets needs to be provided. Also the competitive landscape.  Obviously, it is a business without a competitive advantage due to the low and cyclical nature of the returns, so how does this business compare operationally, financially and value-wise to their main competitors? Who are their customers and how are they faring?

The only way to improve is to write, practice and look at other reports. Go to www.valueinvestorsclub.com and sign up. Then look at the highest rated ideas and study those along side the 10-K of the company mentioned.

Study Other Examples of Research

Or The_Security_I_Like_Best_Buffett_1951  Warren Buffett on Geico.

https://sumzero.com/sp/bc_winner (you may have to paste into your browser) and as reference, Rockwell Automation Inc and ROK_VL from a Deep-Value member, Thomas Harris. We can critique this next if you wish.

Carl Icahn paid $500,000 for an investment bank to furnish a report on breaking up Time-Warner: lazard_twx (worth a look!) and Icahn was right about Time Warner

Analyzing Debt

Sell ABX

ABX Sombull along with Barrick Annual Report 2014 and Barrick 1 Q 2015

https://www.coursera.org/learn/learning-how-to-learn

http://en.wikipedia.org/wiki/How_to_Read_a_Book

Stay with it………writing is hard and finding great ideas even harder.

Time-Out: Special Situation of a Capital Change (BB) GWW

Thin ICe

 I spilled spot remover on my dog. Now he’s gone. — Steven Wright

W. W. Grainger (GWW)

Someone asked what data tools do I use.  My brain and a Value-Line.

Try to look at the Value-Lines WITHOUT looking at the price of the stock. What would you pay for this entire business–not knowing what it did and the current price of the company?  Start with the numbers (excluding the stock price, at first) so to keep your prejudices at bay.   Maybe have a friend print out the Vale-Line and cut off the top of the page.

GWW_VL Jul 2014 and GWW_VL   Something should strike you about this business. What?  Asset or franchise?

A competitor: Fast VL

Grainger_ Capital Allocation-FINAL Whoa? An announcement of a capital structure change–so a type of special situation.  What does this mean?

Grainger_ 2015FactBook Time to dig deeper Grainger_2014_ARGrainger 14BALSTGrainger 14EARN

Ok, about what is this company worth and what type of return could I expect at today’s _____ price?

Not a recommendation! Do your own thinking because then you learn from your mistakes AND successes.

If you don’t know or are not sure; it is just too tough, difficult, or confusing, then you can always do this:

Lyrics

And when I see the sign that points one way
The lot we used to pass by every day

Just walk away, Renee
You won’t see me follow you back home
The empty sidewalks on my block are not the same
You’re not to blame

From deep inside the tears that I’m forced to cry
From deep inside the pain that I chose to hide

Just walk away, Renee
You won’t see me follow you back home
Now, as the rain beats down upon my weary eyes
For me, it cries

Just walk away, Renee
You won’t see me follow you back home
Now, as the rain beats down upon my weary eyes
For me, it cries

Your name and mine inside a heart upon a wall
Still finds a way to haunt me though they’re so small

Just walk away, Renee
You won’t see me follow you back home
The empty sidewalks on my block are not the same
You’re not to blame

Investment Checklists-Adapt Them for Yourself. GOODHAVEN

sacr

Someone sent me a postcard picture of the earth.
On the back it said, “Wish you were here.” — Steven Wright

Investment Checklists 

We left-off here Last Lesson on Gross Profitability and Magic Formula and in that post, the next focus would be on investment checklists.  We have been reading Chapter 2: A Blueprint to a Better Quantitative Value Strategy in Quantitative Value (I will email the Book to new students if they are in the Deep-Value Group at GOOGLE. Go here: https://groups.google.com/forum/#!overview then type: DEEP-VALUE and ask to join.).

On pages 56 to 59 of this chapter the author discusses the case for a checklist. Atul Gawande in his book The Checklist Manifesto: How to Get Things Right argues for a broader implementation of checklists. The author believes that in many fields, the problem is not a lack of knowledge but in making sure we apply our knowledge consistently and correctly. 

The Quantitative Value Checklist

  1. Avoid Stocks that can cause a permanent loss of capital or avoid frauds and financial distress/bankruptcy.
  2. Find stocks with the cheapest quality.
  3. Find stocks with the cheapest prices.
  4. Find stocks with corroborative signals like insider buying, buyback announcements, etc.

Below are several books on checklists.

As students may know, I throw A LOT of information at you to force a choice on your part.   You have to focus on what material can be adapted to your needs. In the three books above, you will find many interesting ideas that may be helpful in learning how to build your own list.

The more experienced you are, then the shorter the checklist.  The point of a checklist is to be disciplined and not overlook the obvious while freeing up your mind for the big picture.   Yes, you check off if there is insider buying, but if insiders are absent, but the company has a strong franchise and the price is attractive, then those factors may be overwhelmingly positive.  You may ask, “Do I understand this business?” Then it may take weeks of industry reading to say yes or no.

Checklists are helpful, but only if you adapt them to your method.

Next, we will be reading Chapter 3, Eliminating Frauds in Quantitative Value. We are trying to improve our ability to build a margin of safety.

goodx

The Problem with Investor Time-frames

Note the dark line in the chart above representing the returns of the Goodhaven Fund. Two analysts/PMs split off from Fairholme and started in mid-2011. They had a big inflow in early 2014 and then some of their investors panicked as they vastly “underperformed the market.”  I don’t know if these managers are good or bad but making a decision on twelve to twenty-four months of data is absurd unless the managers completely changed their stripes (method of investing).  Therein lies opportunity for those with longer holding periods like five years or more.

holding-period

Shareholder_Message_1114 (Some investors run for the door)

2014_AR

2013_AR

HAVE A GREAT EASTER and WEEKEND!

fredgraphcreditmarketdebtgdp

Commodities Carnage; Reversion to the Mean and the Growth Illusion; Net/Nets

Reuters

CRBSearch Strategy: Go where the outlook is bleakest (John Templeton). Keep his wisdom by your side: Sixteen Rules for Investment Success_Templeton

Commodities (CRB Index) fall back to a 40-year support zone ($185/$205)

while:Commodities-Sentiment

As global commodities prices plummet, it’s incredibly convenient to pronounce the commodities super-cycle dead, isn’t it?  Yet banks from Goldman Sachs to Citigroup to Deutsche Bank are on record as saying it’s over.   http://www.wallstreetdaily.com/2014/12/08/jim-rogers-commodities-interview/

The point is not to follow the “experts” but search where there is carnage. I am looking at Templeton’s Russian and Eastern Europe Fund TRF Semi Annual Report because:

  • Hated Countries (Russia, Ukraine)
  • Currencies Down,
  • Commodity Exporters and
  • trading at a 10% discount so the 1.4% management fee is covered for six years.
  • Poor performance for the past few years

Things can and will probably get worse. So please don’t follow the blind (me) off the cliff. This is meant as an example of a SEARCH STRATEGY.

More on Reversion to the Mean and the Growth Illusion

We are beating this subject to death but you can’t understand how investing in bargains works without grasping these concepts.

Contrarian Strategy Extrapolation and Risk  Abstract: Value strategies yield higher returns because these strategies exploit the sub-optimal behavior of the typical investor and not because these strategies are fundamentally riskier.  Yes, this is an academic paper, but worth reading to understand WHY and HOW value (buying stocks with low expectations/and low price to business metrics like earnings, cash flow, EBITDA, etc.) provide better returns.

Growth Illusion

The Two Percent Dilution It is widely believed that economic growth is good for stockholders. However, the cross-country correlation of real stock returns and per capita GDP growth over 1900–2002 is negative. Economic growth occurs from high personal savings rates and increased labor force participation, and from technological change. If increases in capital and labor inputs go into new corporations, these do not boost the present value of dividends on existing corporations. Technological change does not increase profits unless firms have lasting monopolies, a condition that rarely occurs. Countries with high growth potential do not offer good equity investment opportunities unless valuations are low.

value-vs-glamour-a-global-phenomenon (Brandes Institute)

Thick as a Bric by Efficient Frontier

Does the Stock Market Over React

Discussion of Does the Stock Market Over React

Criticism of the Over Reaction Theory

The above is meant to supplement your reading in Deep Value Chapter 5, A Clockwork Market


Ben Graham’s Net-Net Strategy Revisited

Ben Graham Net Current Asset Values A Performance Update

R-T-M, Gross Profitability, Magic Formula

Our last lesson was in Mean Reversion (Chapter 5 in Deep Value) discussed http://wp.me/p2OaYY-2Ju  View this video on a very MEAN Reversion.

We must understand full cycles and reversion to the mean.  Let’s move on to reading Chapter 2: A Blueprint to a better Quantitative Value Strategy in Quantitative Value.

Investors should be skeptical of history-based models. Constructed by a nerdy-sounding priesthood using esoteric terms such as beta, gamma, sigma and the like, these models tend to look impressive. Too often, though, investors forget to examine the assumptions behind the symbols. Our advice: Beware of geeks bearing formulas. -Warren Buffett, Shareholder Letter, 2000.

A WONDERFUL BUSINESS

Greenblatt defined Buffett’s definition of a good business as a high Return on Capital (ROC) – EBIT/Capital

Capital is defined as fixed asses + working capital (current assets minus current liabilities) minus excess cash.

ROC measures how efficiently management has used the capital employed in the business. The measure excludes excess cash and interest-bearing assets from this calculation to focus only on those assets actually used in the business to generate the return.

A BARGAIN PRICE

High earning yield = EBIT/TEV

TEV + Market Cap. + Total debt – minus excess cash + Preferred Stock + minority interests, and excess cash means cash + current assets – current liabilities.EBIT/TEV enables and apples-to-apples comparison of stock with different capital structures.

Improving on the Magic Formula?

ROC defined as Gross profitability to total assets.

GPA = (Revenue – Cost of Goods Sold)/Total Assets

GPA is the “cleanest” measure of true economic profitability.

See this study Gross Profitability a Better Metric and see pages 46-49 in Quant. Value. (the book was sent to deep-value group on Google)

The authors found GPA outperformed as a quality measure the magic formula.  Note on page 48, Table 2.3: Performance Stats for Common Quality Measures (1964 – 2011) that most simple quality measures do NOT provide any differentiation from the market!

FINDING PRICE, Academically–Book value/Market Price

The authors found that analyzing stocks along price and quality contours using the Magic Formula and its generic academic brother Quality and Price can produce market beating results 

The authors: “Our study demonstrates the utility of a quantitative approach to investing. Relentlessly pursuing a small edge over a long period of time, through booms and busts, good economies and bad, can lead to outstanding investment results.”

Ok, let’s come back to quality and avoiding value/death traps in the later chapters (3 and 4) in Quantitative Value.  We are just covering material in Chapter 2. 

INVESTORS BEHAVING BADLY

Investors and the Magic Formula

Adding Your Two Cents May Cost a Lot Over the Long Term by Joel Greenblatt
01-18-2012  (Full article: Adding Your Two Cents

Gotham Asset Management managing partner and Columbia professor Joel Greenblatt explains why investors who ‘self-managed’ his Magic Formula using pre-approved stocks underperformed the professionally managed systematic accounts.

So, what happened? Well, as it turns out, the self-managed accounts, where clients could choose their own stocks from the pre-approved list and then follow (or not) our guidelines for trading the stocks at fixed intervals didn’t do too badly. A compilation of all self-managed accounts for the two-year period showed a cumulative return of 59.4% after all expenses. Pretty darn good, right? Unfortunately, the S&P 500 during the same period was actually up 62.7%.

“Hmmm….that’s interesting”, you say (or I’ll say it for you, it works either way), “so how did the ‘professionally managed’ accounts do during the same period?” Well, a compilation of all the “professionally managed” accounts earned 84.1% after all expenses over the same two years, beating the “self managed” by almost 25% (and the S&P by well over 20%). For just a two-year period, that’s a huge difference! It’s especially huge since both “self-managed” and “professionally managed” chose investments from the same list of stocks and supposedly followed the same basic game plan.

Let’s put it another way: on average the people who “self-managed” their accounts took a winning system and used their judgment to unintentionally eliminate all the outperformance and then some! How’d that happen?

1. Self-managed investors avoided buying many of the biggest winners.

How? Well, the market prices certain businesses cheaply for reasons that are usually very well-known (The market is a discounting mechanism). Whether you read the newspaper or follow the news in some other way, you’ll usually know what’s “wrong” with most stocks that appear at the top of the magic formula list. That’s part of the reason they’re available cheap in the first place! Most likely, the near future for a company might not look quite as bright as the recent past or there’s a great deal of uncertainty about the company for one reason or another. Buying stocks that appear cheap relative to trailing measures of cash flow or other measures (even if they’re still “good” businesses that earn high returns on capital), usually means you’re buying companies that are out of favor.

These types of companies are systematically avoided by both individuals and institutional investors. Most people and especially professional managers want to make money now. A company that may face short-term issues isn’t where most investors look for near term profits. Many self-managed investors just eliminate companies from the list that they just know from reading the newspaper face a near term problem or some uncertainty. But many of these companies turn out to be the biggest future winners.

2. Many self-managed investors changed their game plan after the strategy under-performed for a period of time.

Many self-managed investors got discouraged after the magic formula strategy under-performed the market for a period of time and simply sold stocks without replacing them, held more cash, and/or stopped updating the strategy on a periodic basis. It’s hard to stick with a strategy that’s not working for a little while. The best performing mutual fund for the decade of the 2000’s actually earned over 18% per year over a decade where the popular market averages were essentially flat. However, because of the capital movements of investors who bailed out during periods after the fund had underperformed for a while, the average investor (weighted by dollars invested) actually turned that 18% annual gain into an 11% LOSS per year during the same 10 year period.[2]

3. Many self-managed investors changed their game plan after the market and their self-managed portfolio declined (regardless of whether the self-managed strategy was outperforming or underperforming a declining market).

This is a similar story to #2 above. Investors don’t like to lose money. Beating the market by losing less than the market isn’t that comforting. Many self-managed investors sold stocks without replacing them, held more cash, and/or stopped updating the strategy on a periodic basis after the markets and their portfolio declined for a period of time. It didn’t matter whether the strategy was outperforming or underperforming over this same period. Investors in that best performing mutual fund of the decade that I mentioned above likely withdrew money after the fund declined regardless of whether it was outperforming a declining market during that same period.

4. Many self-managed investors bought more AFTER good periods of performance.

You get the idea. Most investors sell right AFTER bad performance and buy right AFTER good performance. This is a great way to lower long-term investment returns.

Luck-versus-skill-in-mutual-fund-performance by Fama

….We will finish the chapter with a study of checklists in the next post.

Interesting reading: The Crescent Fund (note reversion to the mean)  Oil Crash Pzena and http://aswathdamodaran.blogspot.com/

Go-where-it-is-darkest-when-company.html (Vale-Brazilian Iron Ore Producer).   Prof. Damordaran values Vale and Lukoil on Nov. 20, 2015.  I am looking at Vale because they have some of the lowest cost assets of Iron Ore in the world.  They have good odds of surviving the downturn but where the trough is–who knows. 

Valuing Cyclical Companies:

Valuing Cyclical Commodity Companies

CS on a Cyclical Business or Thinking About Cypress Stock

Letter to Cypress Shareholders about Price vs Value

download_t_j__rodgers__cdc_2002_keynote_presentation

CY_VL

39_studie_value_creation_in_chemical_industry

vale

I think the author at least knew of the risks, but underestimated the extent of the cycle due to massive distortions caused by the world’s central banks.  It did get darker..as iron prices fell another 10% and still falling. 

Month Price Iron Ore Change
Aug 2014 92.63
Sep 2014 82.27 -11.18 %
Oct 2014 80.09 -2.65 %
Nov 2014 73.13 -8.69 %
Dec 2014 68.80 -5.92 %
Jan 2015 67.39 -2.05 %
Feb 2015 62.69 -6.97

vale

Damodaran: I have not updated my valuation of Vale (as of Feb. 20th), but I have neither sold nor added to my position. It is unlikely that I will add to my position for a simple reason. I don’t like doubling down on bets, even if I feel strongly, because I feel like I am tempting fate. 

Prof. Damodaran is responding to a poster who is asking about Vale’s plummeting stock price.  If you are a long-term bull you want declining prices to bankrupt weak companies in the industry so as to rationalize supply.

HAVE A GREAT WEEKEND!

Dollar Panic; Valuation Ratios; Buyback Mania, CEFs

USbills_3228903b

If you think nobody cares about you, try missing a couple of payments.- Wright.

Long-term view of the Dollar (DXY)

Oil service, oil producers, mining companies etc. are being hammered by a dollar “shortage.”  Opportunity may be knocking. Remember what Klarman said about forced selling.

An overview of the situation: Dollar Shortage. With money supply rising in the US there is no dollar “shortage”, but there is a fear of inter-bank lending.

Dollar Leverage BIS Report

Dollar Crisis 2009

JPM-dollar-shortage funding

A Guide to the Swap Market

Now the “experts” say confidently cnbc Dollar Euro Parity. Perhaps a bit late in a trend!   If you are to follow a trend then The Whipsaw Song

A Reader’s Question on Valuation Ratios.  This sheet may be good as a guide to go through an annual report, but none of those ratios means anything without context.   Is growth good? It depends. Only profitable growth within a franchise.  How about asset turnover?   For some companies like Costco asset turnover is critical but not for Boeing (gross margin).   Why not take those ratios and work through the financials of these trucking companies.  Which company is doing the best? Why? Follow the money!   Those ratios may help you structure the information you pull out from the financials. But first focus on how does the company provide a service to its customers and then trace the financial effects back to your returns as an investor.

  1. HTLD VL
  2. JBHT VL
  3. KNX_VL

Buy-Back Mania (a yellow light of caution)

davidstockmanscontracorner.com-February Stock Buybacks Hit RecordTotal 2 Trillion Since 2009

Emultate Henry Singleton

Case Study in capital allocation: Dr. Singleton and Teledyne A Study of an Excellent Capital Allocator (must read!)

Gold is in a hyper bubble……………….

Gold Bubble

But now not so much…………………Gold Bubble Not Quite as much

Gold is stupid-cheap compared to all the money out there…………………Gold hyper undervalued

What determines the price of gold

2010-06-21 IE Special Report GOLD

A Case Study in investing in Closed-End Funds

Prof. Greenblatt once said that sometimes people just go crazy.

A Lesson in CEF Investing TRF

trf

Investors ran to pay a 90% PREMIUM to NAV AFTER a six-year boom and now after a seven-year decline they sell at a 10.5% DISCOUNT. Go figure.

http://www.cefconnect.com/Details/Summary.aspx?Ticker=TRF

Interesting video on China–a country brimming with centrally planned mal-investment. Is China Already in a Hard Landing?

Read more at reality-check-how-fast-is-china-growing.

We will get back to Deep Value next week and I will post links to valuation class videos.  Have a great weekend and if you do try to emulate someone, then: